CloudNativePG Part 4: Breaking a Throwaway Database on Purpose
Extending Prometheus and Alertmanager to cover CloudNativePG, then chaos-testing failover, node loss, and restores against a throwaway database.
Introduction
bletchley-pg has been sitting on the cluster since Part 3: three instances spread across two TuringPi boards, external access through pg.vluwte.nl, daily backups confirmed firing. And completely untested. No database has been created on it, no application has connected, and nobody has ever tried to restore from one of those backups. Everything about it is, in the most literal sense, theoretical.
Part 4 is where that changes. Before anything real lands on this cluster — lldap in Part 5, the Umami migration in Part 6 — I wanted to deliberately break bletchley-pg a few specific ways and see what happened. Kill the primary. Force a failover. Remove a node. Restore from a backup. All against a throwaway database that exists for exactly this purpose and gets deleted at the end.
But breaking things without watching them properly doesn't prove much. This cluster has already taught me that lesson twice, the hard way, with two other services entirely. So before touching bletchley-pg, this post is about making sure something is actually watching it — and only then finding out what it does when things go wrong.
This post is part of the CloudNativePG sub-series sub-series.
- Part 1: Planning HA PostgreSQL Across Two Boards
- Part 2: Labeling Nodes and Auditing Existing Workloads
- Part 3: Installation and Exposing It with MetalLB
- Part 4: Breaking a Throwaway Database on Purpose
🏠 This is part of the Homelab Journey series - building a production Kubernetes cluster from scratch.
This post assumes bletchley-pg is already installed and reachable, per CloudNativePG Part 3. It also leans on the existing Prometheus/Alertmanager stack from the Cluster Observability series and on OpenBao/External Secrets from the Secret Management series.Why Monitor Before You Break Something on Purpose
I've been burned by this exact failure shape before. Garage silently came back from a reboot in a broken state, and the fallout — a backup target that failed for fifteen hours with nobody watching — is the whole subject of Closing the Backup Loop. I'm not retelling it here, but the lesson carried straight over: "came back from restart broken, no signal" is a failure class this cluster has hit before, and I have no reason to think CNPG is immune to it.
That's exactly the failure class I'm trying to provoke in bletchley-pg with this round of chaos testing — and if I run these tests without monitoring in place first, all I'll prove is "it recovered" or "it didn't," watched live in a terminal. That tells me nothing about whether it would be caught automatically, unattended, at 3am. So the plan for Part 4 is strict about ordering: instrument first, break second, tune third.
- Extend the existing Prometheus/Alertmanager stack to cover
bletchley-pgand the CNPG operator, with an alert set adapted from CNPG's own recommended rules plus a couple specific to what Part 3 already taught me about this cluster. - Run the chaos tests against a throwaway database, with the new monitoring watching the whole time.
- Tune thresholds and severities based on what actually happened, and close out.
Building the monitoring first turns the chaos tests into the monitoring's own acceptance test. If a failure I trigger on purpose doesn't page, the alert config is wrong, and I want to know that before anything real is behind it — not after.
Wiring Up Prometheus for CNPG
This cluster runs the plain prometheus-community/prometheus Helm chart, not kube-prometheus-stack, so there's no Prometheus Operator and no ServiceMonitor/PodMonitor CRDs. Every scrape target here — Longhorn, smartctl, Garage, OpenBao — is hand-written kubernetes_sd_configs plus relabel_configs in extraScrapeConfigs, and CNPG followed the same pattern:
# apps/monitoring/prometheus/prometheus-values.yaml — extraScrapeConfigs
- job_name: cnpg
  kubernetes_sd_configs:
    - role: pod
      namespaces:
          names:
            - databases
  relabel_configs:
    # Only CNPG-managed pods (currently bletchley-pg's 3 instances)
    - source_labels: [__meta_kubernetes_pod_label_cnpg_io_cluster]
      action: keep
      regex: .+
    # Named 'metrics' port only (9187) — pods also expose 5432, not HTTP
    - source_labels: [__meta_kubernetes_pod_container_port_name]
      action: keep
      regex: metrics
    - source_labels: [__meta_kubernetes_pod_label_cnpg_io_instanceRole]
      target_label: role
    - source_labels: [__meta_kubernetes_pod_node_name]
      target_label: node
    - source_labels: [__meta_kubernetes_pod_name]
      target_label: pod

- job_name: cnpg-operator
  kubernetes_sd_configs:
    - role: pod
      namespaces:
          names:
            - cnpg-system
  relabel_configs:
    - source_labels: [__meta_kubernetes_pod_label_app_kubernetes_io_name]
      action: keep
      regex: cloudnative-pg
    - source_labels: [__meta_kubernetes_pod_container_port_name]
      action: keep
      regex: metrics
Every CNPG instance pod exposes Prometheus metrics on port 9187 through the built-in instance-manager exporter — no sidecar needed. The operator itself exposes controller-runtime metrics separately, on port 8080 in cnpg-system. On top of that, cnpg-default-monitoring installs a standard set of PostgreSQL-level queries automatically (replication lag, transaction age, deadlocks, and so on) unless the Cluster explicitly disables them, which bletchley-pg doesn't.
On top of the scrape config, I added a cnpg alerting rule group: instance and HA health (CNPGInstanceDown, CNPGClusterHADegraded), primary placement (CNPGPrimaryNotOnPreferredNode, CNPGManualSwitchoverRequired), backups, and replication/query health ported mostly as-is from CNPG's own sample rules. Thirteen rules in total, applied via the usual helm upgrade.
Backup Metrics Aren't the Metrics I Expected
The backup alerts are the one place I couldn't just copy CNPG's sample rules. The obvious metrics — cnpg_collector_last_available_backup_timestamp, cnpg_collector_last_failed_backup_timestamp, cnpg_collector_first_recoverability_point — are deprecated and only populate for the legacy in-core barmanObjectStore backup method, or for volume snapshots. bletchley-pg uses neither. It uses the Barman Cloud Plugin (barman-cloud.cloudnative-pg.io), which is what Part 3 settled on after the in-tree method turned out to be the wrong call for this setup.
An alert built on those deprecated metrics would sit there looking correct and simply never fire — the exact "looks fine, isn't" trap this whole exercise is meant to avoid. The plugin exposes its own equivalents under a barman_cloud_cloudnative_pg_io_* prefix, through the same 9187 exporter, and that's what CNPGBackupMissing and CNPGBackupFailed are built on instead:
- alert: CNPGBackupMissing
  expr: time() - barman_cloud_cloudnative_pg_io_last_available_backup_timestamp > 90000
  for: 5m
  labels:
    severity: warning
  annotations:
    summary: "No successful bletchley-pg backup in the last 25 hours"
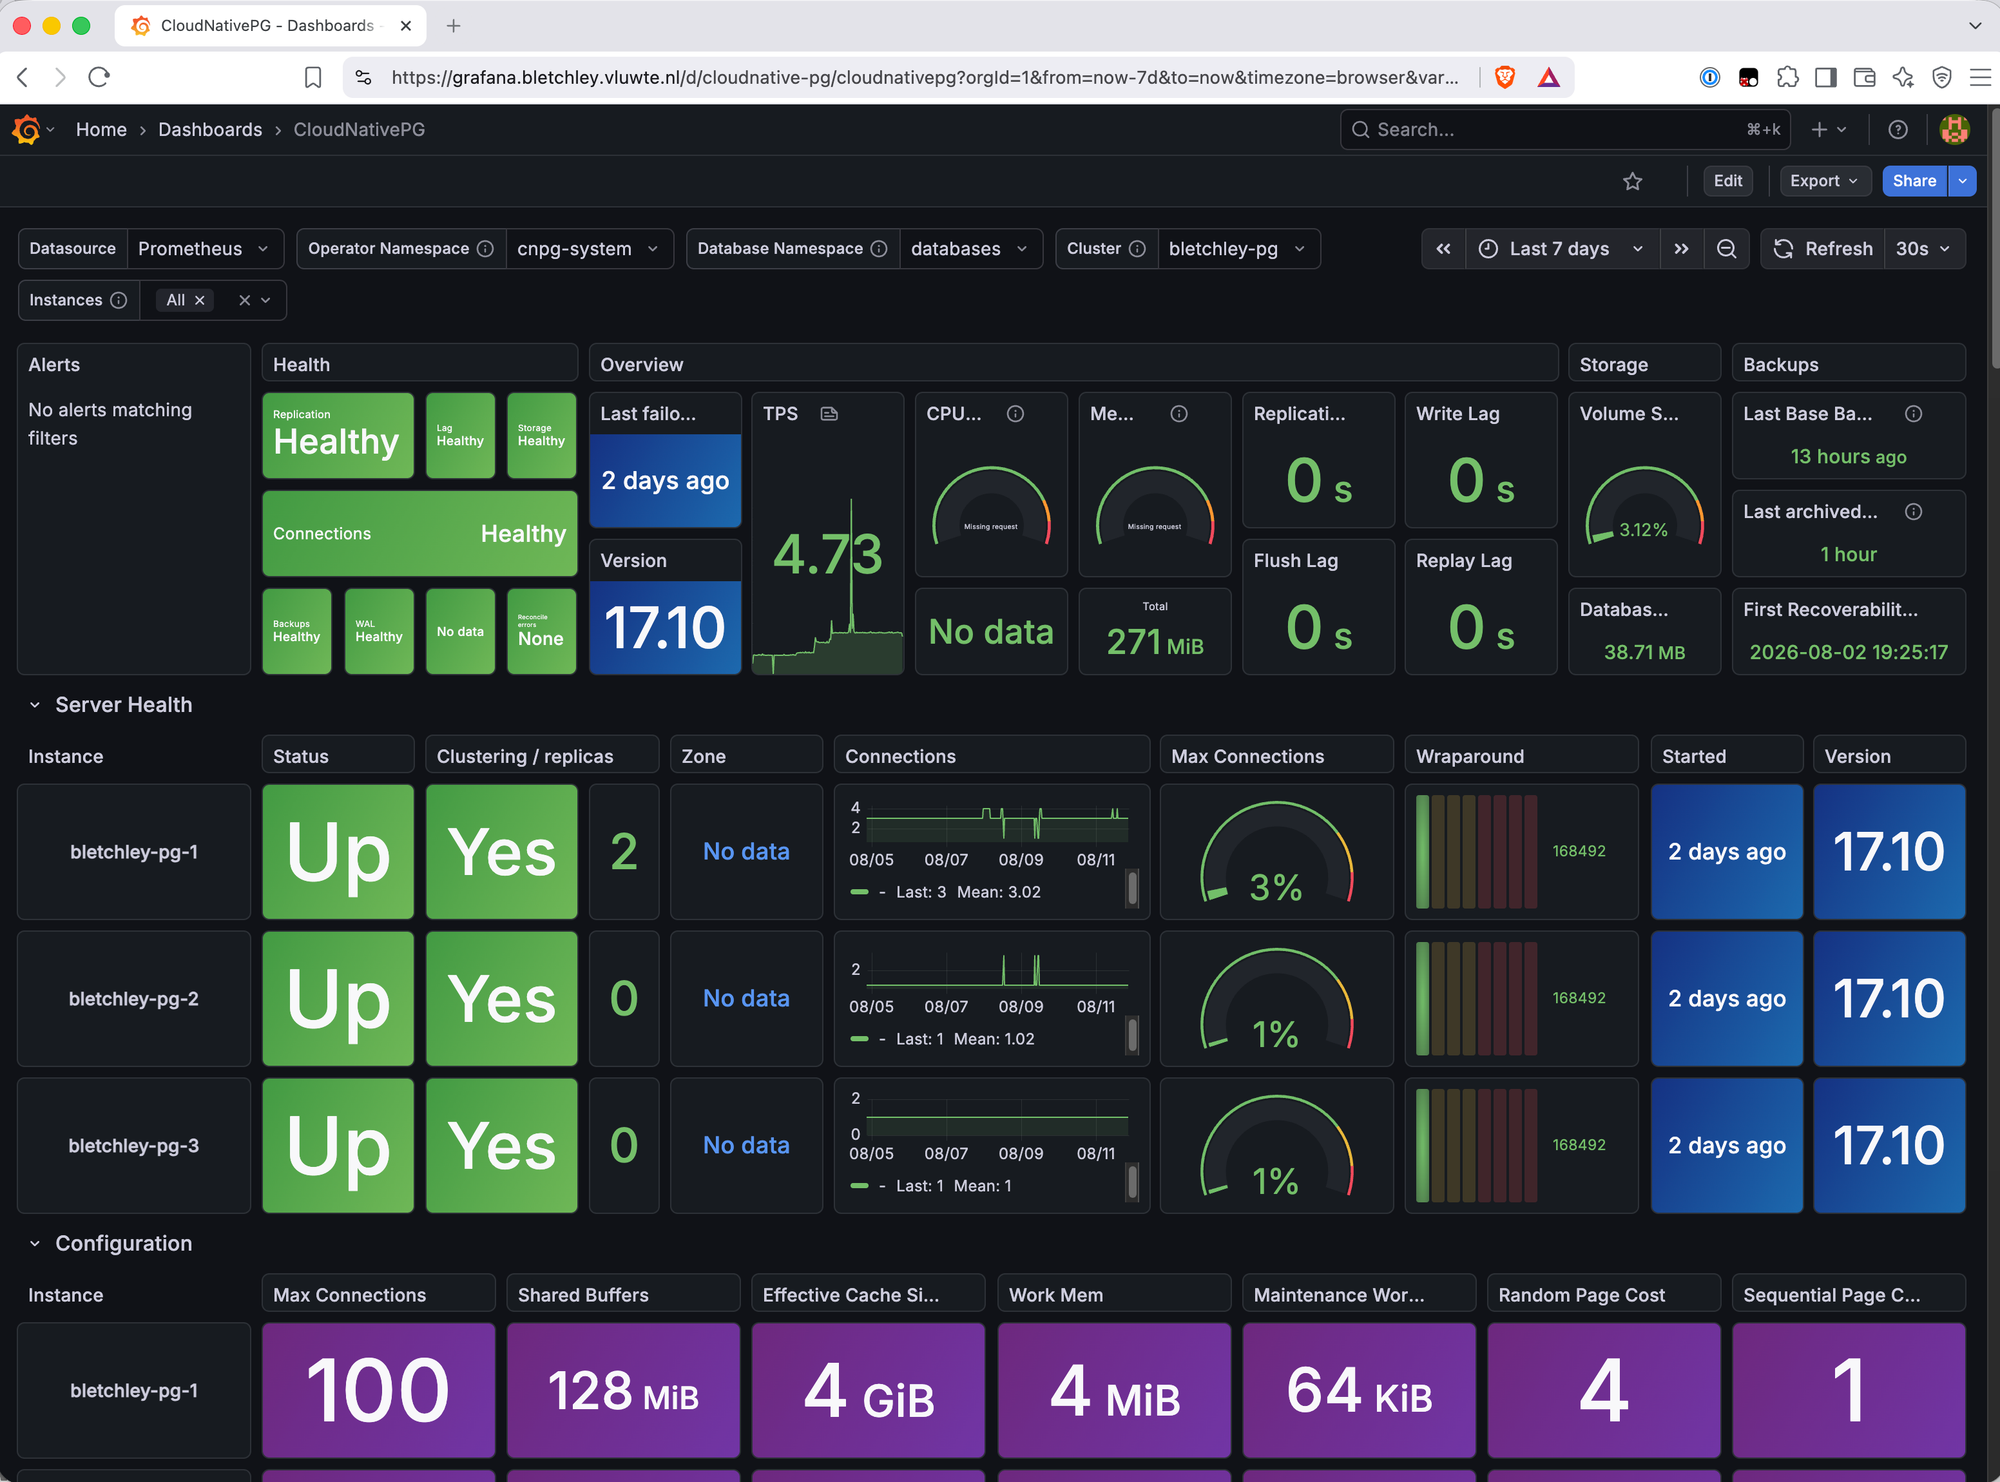
Confirming those plugin metrics actually populate turned into its own small check once I imported the official CloudNativePG Grafana dashboard, which is built for the deprecated metric family by default. Two of its panels — "Last Base Backup" and "First Recoverability Point" — read N/A on import, exactly as expected since the deprecated metrics are genuinely zero on this cluster. Repointing both panels at the plugin's own metrics fixed them immediately, and confirmed barman_cloud_cloudnative_pg_io_* exists and populates correctly on plugin v0.14.0 — direct proof the alert rules above are built on the right foundation.
The Official Dashboard Wasn't Quite Plug-and-Play
Importing that same dashboard surfaced a second, unrelated problem — nothing to do with deprecated metrics, just a gap in my own scrape config. The per-instance Status, Zone, and Volume Size panels all showed "No data," because the official dashboard's queries assume a namespace label that Prometheus Operator's PodMonitor convention adds automatically. My hand-written scrape job didn't add one. Adding __meta_kubernetes_namespace → namespace to both the cnpg and cnpg-operator jobs (two separate scrape targets, so the fix needed applying twice) fixed the "Database Namespace" and "Operator Namespace" selectors and most of the affected panels.
With both fixes in — the right metrics behind the backup panels, the right label behind the per-instance panels — everything reads clean:
Something to Actually Break
Monitoring in place, the next step was giving myself something to break. That meant a real, if throwaway, database — with its own OpenBao secret, its own Kubernetes role via CNPG's DatabaseRole/Database CRDs, and its own SecretStore wiring through External Secrets.
Unexpected failure #1: I nearly broke backups before the chaos test even started.
The one genuinely dangerous moment here had nothing to do with chaos testing. Applying the new SecretStore for the throwaway workload's namespace returned configured, not created — meaning an object with that exact name (openbao, in the databases namespace) already existed. It turned out Part 3 had already created a SecretStore named openbao in that same namespace, for the Barman Cloud Plugin's own backup credentials. My apply had just silently overwritten its role field, repointing it at the throwaway workload's Vault role instead — and since the throwaway policy doesn't even cover the path the backup credentials live at, the next scheduled resync would very likely have broken backups entirely, quietly, exactly the kind of thing this whole post is about catching. Fixed by renaming my new SecretStore to something that didn't collide, and confirming the original object was restored via kubectl apply -f returning created this time — proof it was now genuinely a separate object.
With the database and secrets in place, I built a small write/read/compare harness: a writer pod inserting a row every couple of seconds, a reader polling for new rows, and a one-shot comparator job that reports written vs. read counts and read latency. It's the thing that turns "the cluster looks healthy in kubectl get pods" into an actual measurement of data loss and propagation delay during each chaos test.
Getting the harness right took longer than expected — table ownership landing on postgres instead of the app role after a manually-seeded table, psql's command-tag output corrupting CSV files under -t, and a reader that re-queried the entire table every poll, which worked fine at low row counts and quietly became an O(n²) crawl once the table passed a few thousand rows and the reader fell twelve minutes behind the writer with no way to catch up on its own. All fixed — the reader now tracks a last-seen ID and only queries forward from there — but worth mentioning as the kind of thing that's obvious in hindsight and invisible until the row count gets large enough to expose it.
With a clean baseline (251 writes, avg latency 1.3s, max 3.0s, zero missing), Part 4's actual chaos tests could start.
Failover Under Real Write Load
Phase 1 — Manual Promote
The gentlest failover CNPG supports: a coordinated promote, with the old primary demoted cleanly rather than killed.
igor@granite bletchley % kubectl cnpg promote bletchley-pg bletchley-pg-2 -n databases
{"level":"info","ts":"2026-08-08T12:14:29.628013+02:00","msg":"Cluster has become unhealthy"}
Node bletchley-pg-2 in cluster bletchley-pg will be promoted
The writer logged a handful of WRITE FAILED lines for about eight seconds while it reconnected through bletchley-pg-rw to the new primary on rock5, then picked straight back up. The comparator afterward showed one row genuinely missing out of 1,325 written — an in-flight write that landed during the handover window — with read latency spiking to 45 seconds for the batch that arrived right after reconnection, against a 3-second baseline max. Not free, but recoverable in well under a minute.
The alert side is the more interesting part. CNPGPrimaryNotOnPreferredNode — the rule I added to flag when the primary isn't on rock4, its soft-preferred node — showed as pending in Grafana within about a minute of the promote:
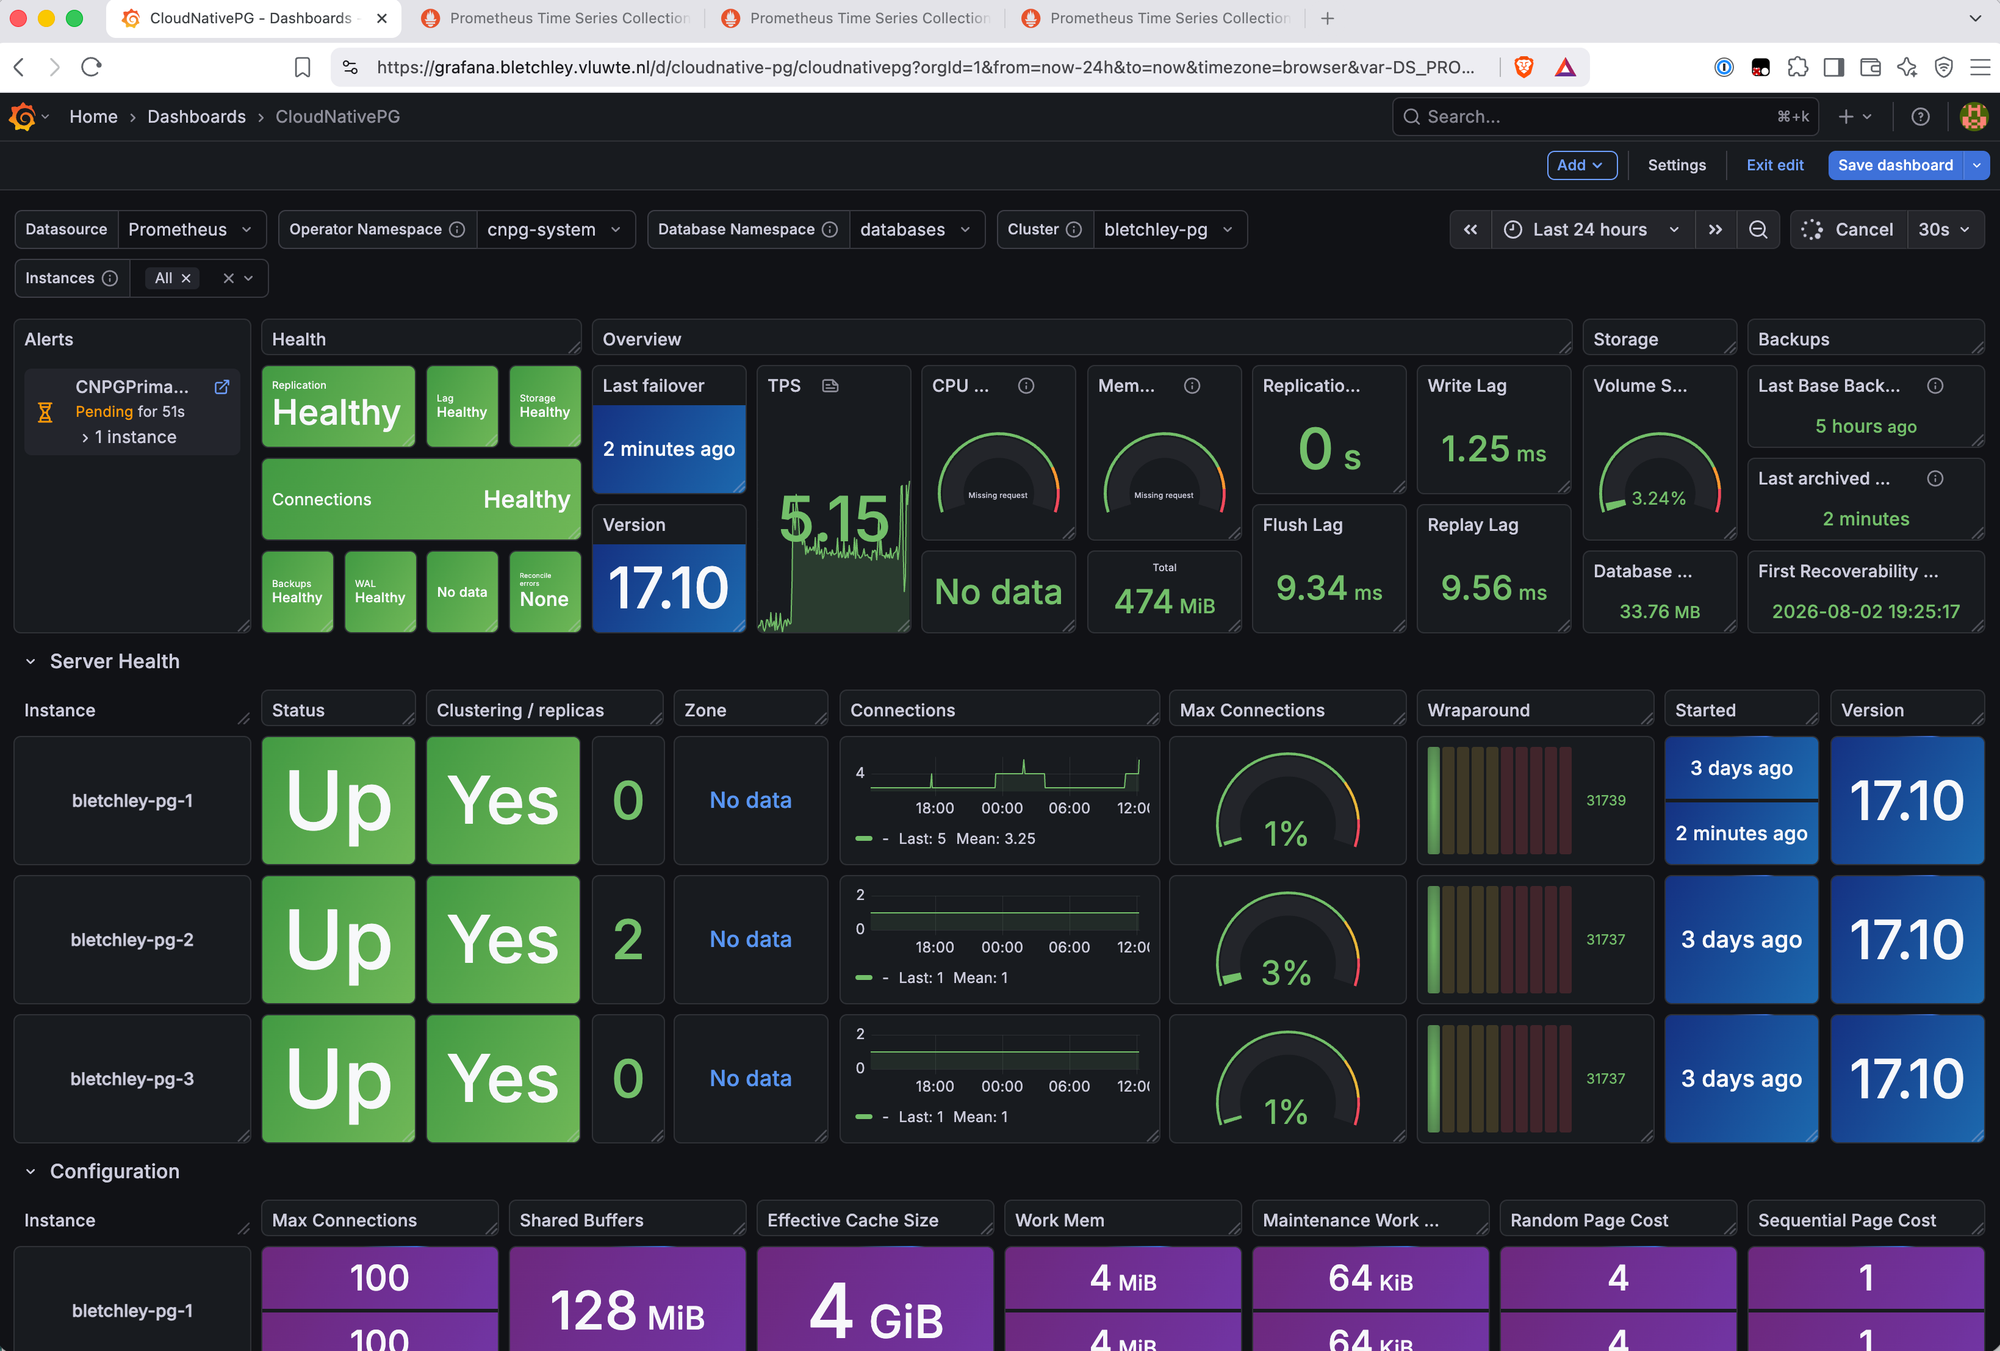
The email notification didn't arrive until twenty minutes later, because the alert has a for: 20m window — deliberately long, to outlast a normal failover-and-promote cycle without paging over something informational:
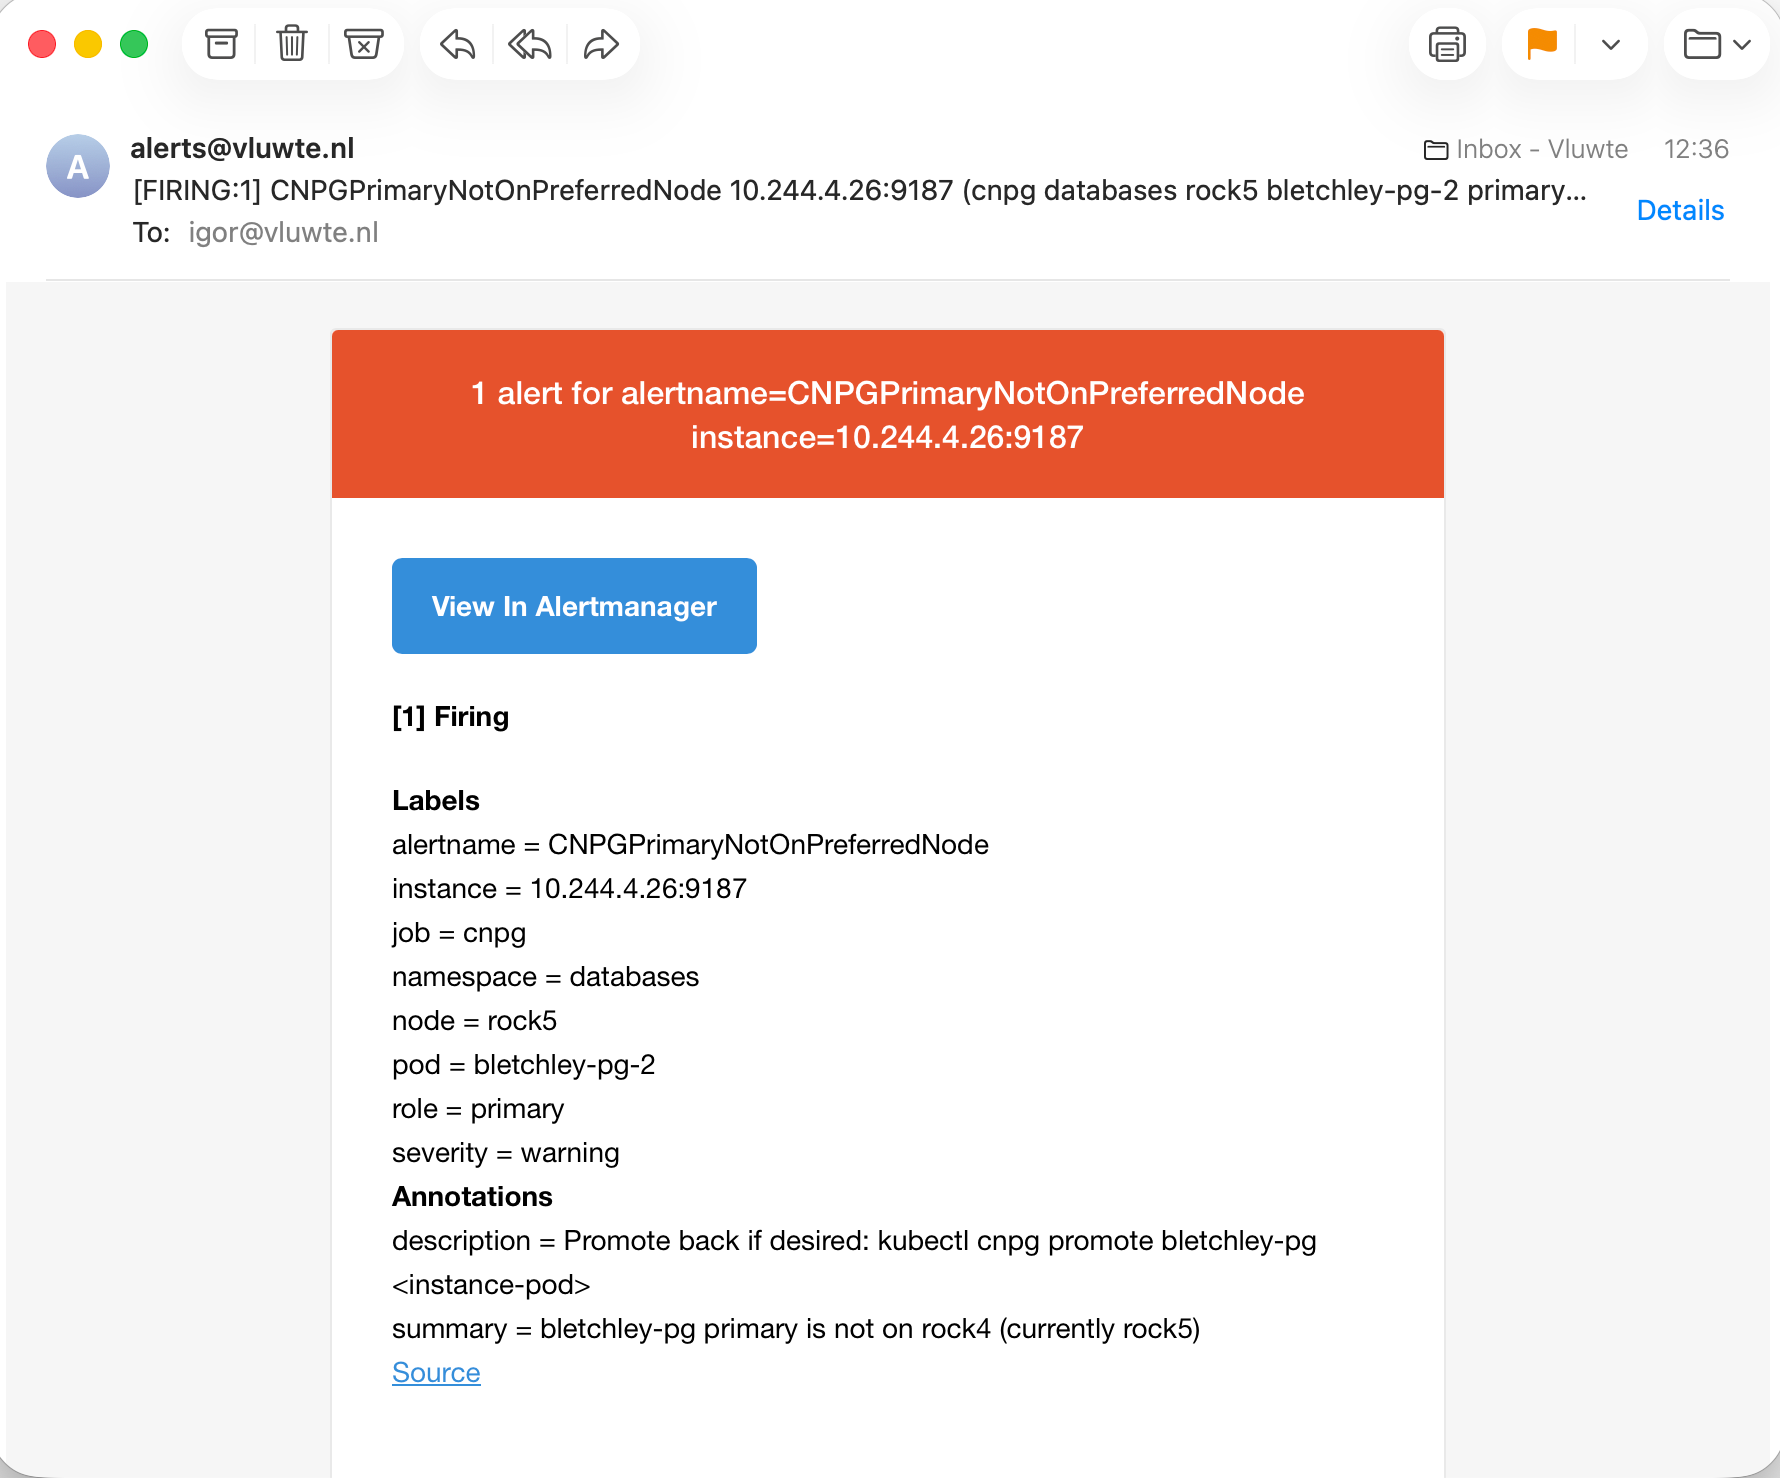
That gap between "the dashboard already knows" and "the email finally says something" is exactly the point of having both. Grafana is for when I'm already looking. Alertmanager is for when I'm not.
Phase 2 — Hard Kill
A force-deleted pod is a much closer approximation of an actual crash than a plain delete, which sends SIGTERM and waits out the graceful termination window:
igor@granite bletchley % kubectl delete pod bletchley-pg-2 -n databases --grace-period=0 --force
pod "bletchley-pg-2" force deleted from databases namespace
This time, CNPGReplicaFailingReplication fired — the alert most likely to catch something real, and it did, arriving by email within minutes rather than twenty:
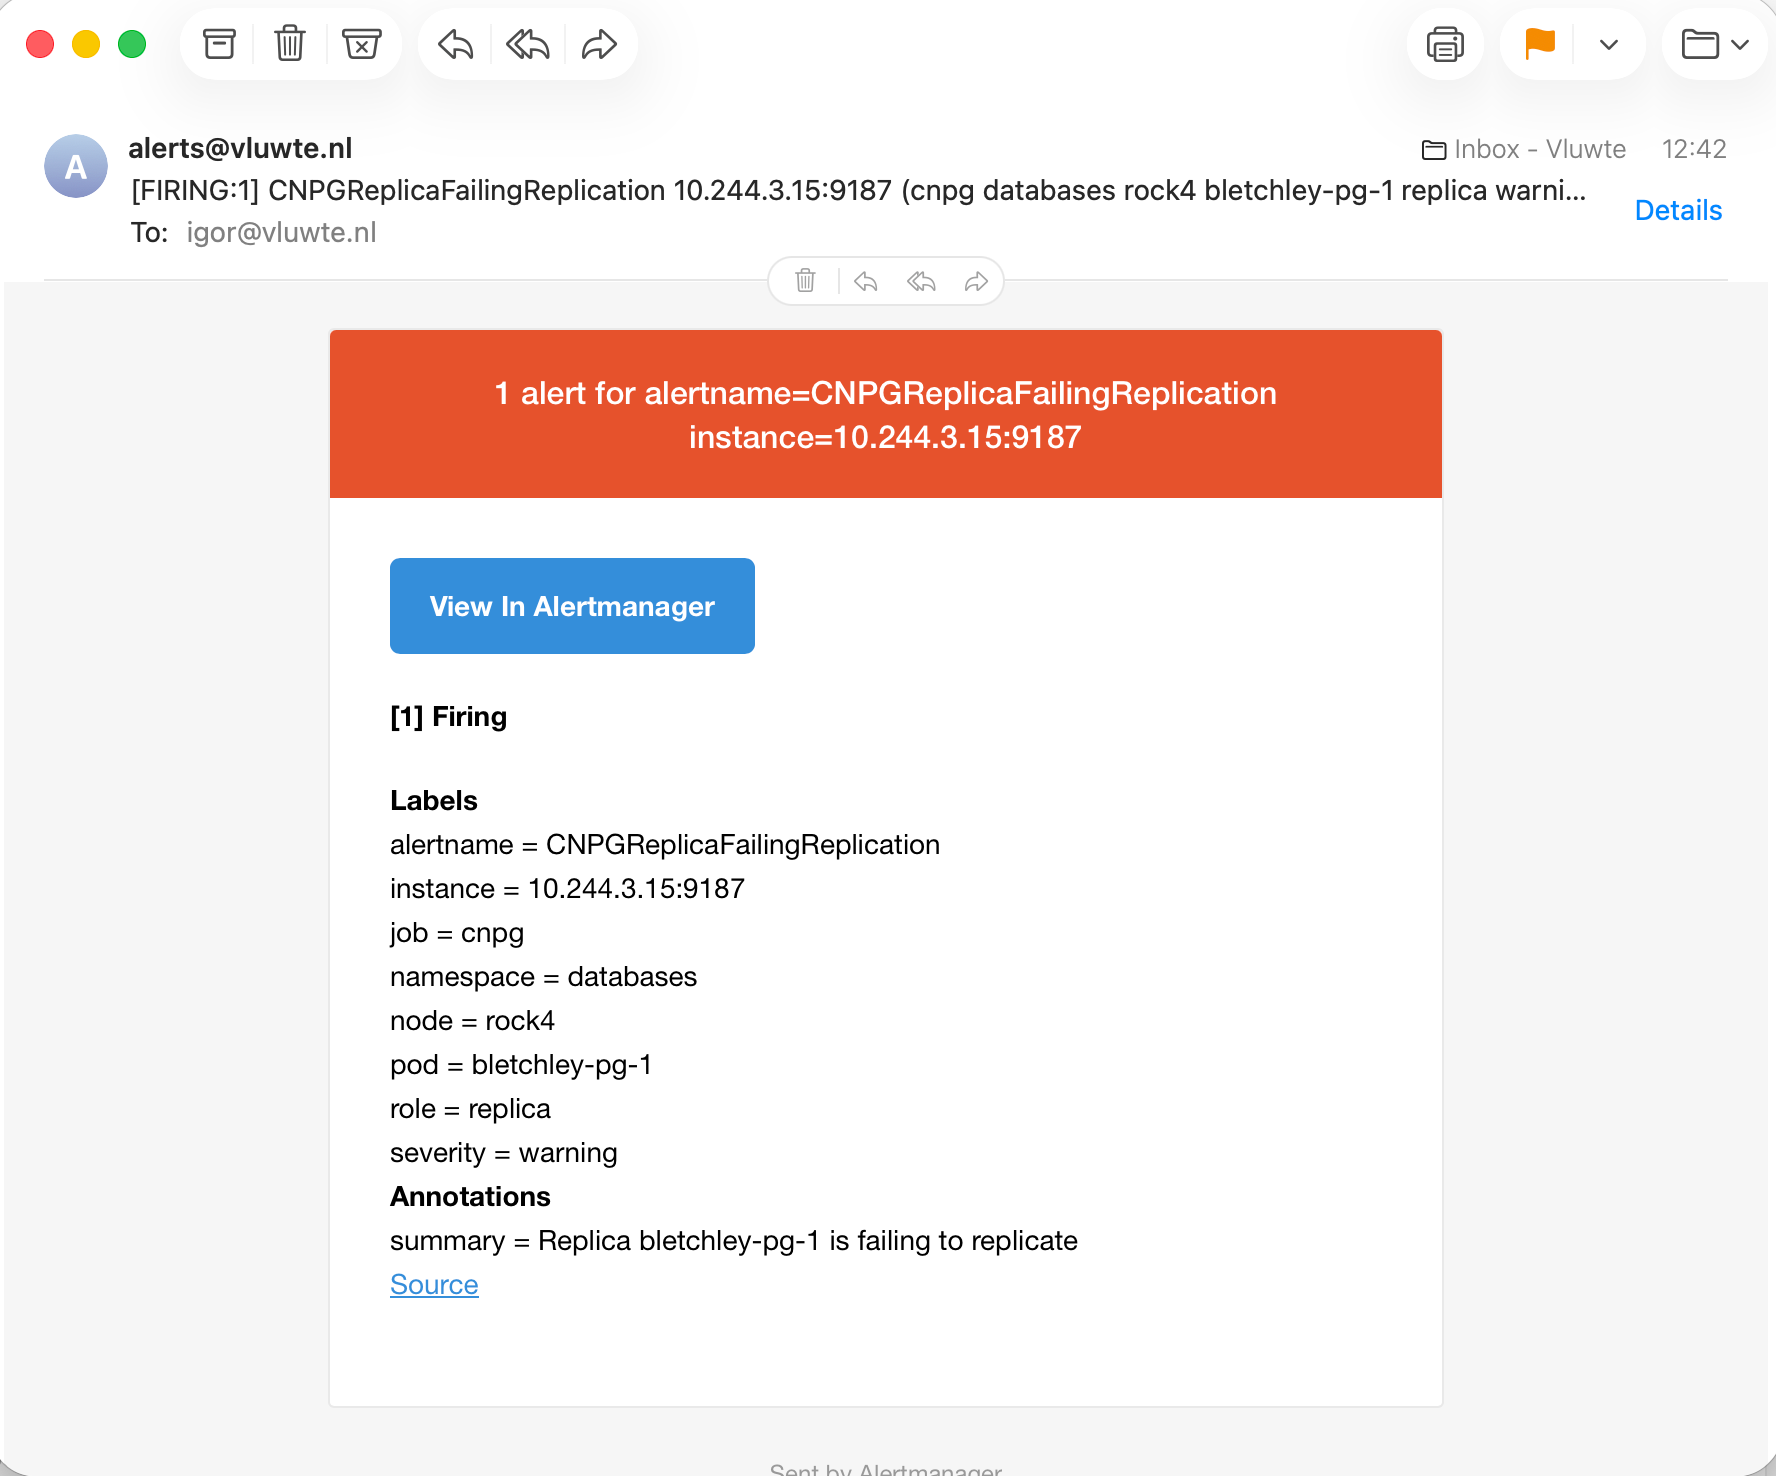
Two different alerts, two very different notification speeds, both doing exactly what they were designed to do.
The Failure Mode I Didn't Expect
Bletchley's seven nodes span two physical TuringPi boards, and bletchley-pg uses topologySpreadConstraints to enforce a hard split — no more than one instance imbalance between boards. The next test was meant to check that directly: identify whichever board currently has the minority instance, kill it, and confirm the replacement lands back on the same board rather than piling onto the majority side.
The instance that turned out to be in the minority was the primary itself, not a replica — a coincidence of how the previous tests had shuffled placement, not something this one controlled for. That turned it into an accidental third failover test, run with what I expected to be the gentlest trigger of the three:
igor@granite bletchley % kubectl delete pod bletchley-pg-1 -n databases
pod "bletchley-pg-1" deleted from databases namespace
No flags. No force. Just a plain delete — the same command I'd use to bounce almost anything else on this cluster without a second thought. It was, by a wide margin, the worst outage of the entire post:
| Trigger | Command | Recovery time |
|---|---|---|
| Coordinated promote | kubectl cnpg promote |
14s |
| Force delete | kubectl delete pod --grace-period=0 --force |
23s |
| Graceful delete | kubectl delete pod (no flags) |
187s |
The two triggers that look more aggressive on paper — a forced kill, a deliberate cutover — both recovered in under 25 seconds. The one that looks the most cautious took over three minutes. The reason is that a plain delete does exactly what it's designed to do: it sends SIGTERM and waits out terminationGracePeriodSeconds before giving up on the pod. CNPG, in turn, won't declare the old primary gone — and start failing over — until it's actually sure it's gone. Politely waiting for a graceful shutdown is the right default for a stateless web pod. For the primary of a database cluster, it's 187 seconds of nobody able to write, because the safe-looking command is the one thing standing between "it's dead" and "it might still be there." A hard kill or a coordinated promote both settle that question immediately; a graceful delete defers it for as long as Kubernetes is willing to wait.
The comparator's read-latency figure told the same story from the data side: max 187.0 seconds, tracing to a single gap between two consecutively-read rows that lined up exactly with the outage window. One more detail worth recording: the ID sequence itself jumped from 175 to 198 during that gap, skipping 176 through 197 entirely. That's not lost data — Postgres sequences aren't transactional, so every insert attempt that reached the database consumed a sequence value even if its transaction never committed. Most of the roughly ninety WRITE FAILED attempts logged during the outage never reached the database at all; only the handful that landed in the brief window where a connection was accepted but then aborted mid-transaction actually consumed an ID.
Board placement, at least, held up: the replacement instance came back on the correct, minority board both times I ran this test. Node-level placement, on the other hand, did not — which is where the next test picks up.
The Anti-Affinity Bug
The following test cordoned and drained an entire node (rock7) to simulate losing it outright, then uncordoned it afterward. The board-level split survived. But the replacement for the evicted instance landed on rock4 — the same node already hosting the primary. A single node failure at that point would have taken out two of three instances at once, which is exactly the scenario CNPG's node-level anti-affinity is supposed to prevent.
What I thought I had: "Never put two CNPG instances on the same node."
What I actually had: "Prefer not to put two CNPG instances on the same node — unless another scheduling preference wins."
Those two sentences describe the same YAML, and I'd genuinely believed I'd written the first one:
spec:
  affinity:
    nodeAffinity:
      preferredDuringSchedulingIgnoredDuringExecution:
      - preference:
          matchExpressions:
          - key: kubernetes.io/hostname
            operator: In
            values:
            - rock4
        weight: 100
    podAntiAffinityType: preferred
  topologySpreadConstraints:
  - labelSelector:
      matchLabels:
        cnpg.io/cluster: bletchley-pg
    maxSkew: 1
    topologyKey: topology.bletchley/board
    whenUnsatisfiable: DoNotSchedule
The confusion starts with two separate topology keys living in the same manifest. spec.affinity's own topologyKey defaults to kubernetes.io/hostname — node level — and that's a completely different field from topologySpreadConstraints' own topologyKey below it, which is set explicitly to topology.bletchley/board. Two independent rules, two independent notions of "topology," easy to read as one rule doing double duty when they're not.
That distinction is what actually broke things. The rock4 node-affinity preference from Part 3 (meant to softly bias the primary onto rock4) applies to every instance pod CNPG schedules, not just whichever one happens to be primary — there's one shared pod template, no per-role targeting. Meanwhile podAntiAffinityType: preferred — the default — means CNPG's own node-level anti-affinity is only a soft scoring input, competing on the same pass as that rock4 preference rather than ruling it out. With rock4 already hosting an instance and scoring +100 from the node preference, nothing outweighed it. "Preferred" plus "preferred" doesn't add up to "required" — it just means whichever preference scores higher wins, and rock4's did.
I'd left podAntiAffinityType at preferred deliberately, based on a mistaken assumption that required would demand "no two instances share a board" — which really would be impossible with three instances and two boards. Now that the two topology keys are untangled, it's clear that's not what it does: required only enforces "no two instances share the exact same node" (the hostname-level default), which is trivially satisfiable across six schedulable nodes on two boards:
affinity:
  podAntiAffinityType: required   # was: preferred
Since affinity lives in the pod template, Kubernetes can't hot-patch it on running pods — applying the change forced a full rolling restart of all three instances on its own, replicas first and primary last. Node-level separation held cleanly after that.
Restore Tests: Proving the Backups Are Real
The whole point of Part 3's backup configuration was useless until something actually tried to restore from it. So the last chaos test built a fresh, single-instance Cluster pointed at the same Barman Cloud object store, with no shared state or credentials with the live bletchley-pg:
apiVersion: postgresql.cnpg.io/v1
kind: Cluster
metadata:
  name: bletchley-pg-restore
  namespace: databases
spec:
  instances: 1
  storage:
    storageClass: longhorn-single-replica
    size: 20Gi
  bootstrap:
    recovery:
      source: bletchley-pg-source
  externalClusters:
    - name: bletchley-pg-source
      plugin:
        name: barman-cloud.cloudnative-pg.io
        parameters:
          barmanObjectName: cnpg-backups-store
          serverName: bletchley-pg
It reached a healthy state in 89 seconds and restored to the latest available WAL, not the most recent named backup — an important distinction I hadn't fully internalized going in. The row count came out a little ahead of the number I'd noted as the live baseline before the test, simply because the writer kept running the whole time; in a real restore scenario you'd stop writes first, and "restore to latest" and "restore to last write" would be the same thing.
Pinning a restore to one specific, named backup turned out to need more than I expected. My first attempt just set backupID on the recovery target — and got essentially the same "restore to latest" result, because backupID only chooses which base backup to physically restore from; it says nothing about how far WAL replay should continue afterward. Without an explicit stopping point, recovery just keeps replaying every WAL segment it can find. The fix was adding recoveryTarget.targetImmediate: true, which tells CNPG to stop as soon as that backup reaches a consistent state:
bootstrap:
  recovery:
    source: bletchley-pg-source
    recoveryTarget:
      backupID: 20260809T115456
      targetImmediate: true
The second attempt landed within twelve rows of the expected count, and the difference was visible in more than just row counts — the restored cluster came up at 119MB instead of 712MB, in 56 seconds instead of 99, because far less WAL had to be downloaded and replayed to reach an earlier stopping point.
One last check, run once rather than per-phase since it's a static security posture rather than something a chaos test would change: confirming the documented "superuser access disabled" rule actually holds from outside the cluster too, not just internally.
igor@granite bletchley % psql "host=10.0.140.101 port=5432 dbname=throwaway user=postgres sslmode=require"
Password for user postgres:
psql: error: connection to server at "10.0.140.101", port 5432 failed: FATAL:  password authentication failed for user "postgres"
Expected to fail, and it did.
It's worth being precise about what these restore tests actually prove. Garage — the S3-compatible object store all of this backs up to — runs inside this same cluster, on rock3. A restore that reads from Garage proves CNPG's recovery mechanism works. It doesn't prove the cluster would survive losing everything at once, since Garage would go down with it. Proving that means restoring from a genuinely offsite copy into a genuinely clean environment — real work I've already started (syncing the CNPG backup bucket to the NAS alongside the existing Longhorn backups), but it's a big enough topic, and honest enough about what it would take to get right, that it deserves its own post rather than a rushed paragraph here. It'll land after lldap (Part 5), the Umami migration (Part 6), and retiring the legacy postgres StatefulSet.
Chaos Test Results at a Glance
Five triggers, one throwaway database, measured against the harness's write/read/compare numbers rather than just "did kubectl get pods look healthy afterward":
| Test | Trigger | Outage | Data loss | Result |
|---|---|---|---|---|
| Manual promote | kubectl cnpg promote |
~14s | 1 row | Pass |
| Hard kill | kubectl delete pod --grace-period=0 --force |
~23s | 0 rows | Pass |
| Pod delete (primary) | kubectl delete pod (graceful) |
~187s | 1 row | Unexpected — slowest by far |
| Node drain (rock7) | cordon + drain |
none (replica only) | 0 rows | Anti-affinity bug found |
| Restore to latest | Barman Cloud Plugin | 89s to healthy | — | Pass |
"Outage" is wall-clock time until the writer stopped logging WRITE FAILED. "Data loss" is what the comparator actually confirmed missing — rows the writer logged as written but the reader never saw — not an estimate. The one row lost in the manual promote and the plain-delete test both trace to a write in flight at the exact moment of the cutover, not a bug; the hard kill and the node drain lost nothing at all, for the two very different reasons covered above.
Tuning the Alerts
With every test run and logged, tuning was a single deliberate pass through what actually fired, rather than judging each test in isolation:
| Test | Alert fired | Notification |
|---|---|---|
| Manual promote | CNPGPrimaryNotOnPreferredNode |
Grafana within ~1 min; email after 20 min |
| Hard kill | CNPGReplicaFailingReplication |
Email quickly |
| Board-rebalancing | None | Transition too fast to cross any for: window |
| Cordon/drain | Brief replication-lag flash (Grafana only) | None emailed — sub-threshold, as expected |
CNPGInstanceDown (for: 5m) and CNPGClusterHADegraded (for: 15m) never fired once across any test — every real transition resolved well inside both windows. That's the correct outcome for what those two alerts are meant to catch: sustained degradation, not clean, fast recoveries.
The one real decision was whether to shorten CNPGPrimaryNotOnPreferredNode's twenty-minute email delay, flagged live as a candidate during Phase 1. On reflection, I left it as-is — the alert is informational, a placement preference rather than a health condition, so a slower notification cadence is the right call. I did fix a real bug in it, though: the description had bletchley-pg hardcoded instead of templated, which meant it displayed the wrong cluster name when the same alert (deliberately left unscoped, so it stays generically useful for future clusters) later fired for a temporary restore-test cluster. Now templated with {{ $labels.cluster }} throughout.
Lessons Learned
- Build the alerting before the chaos, not after. Otherwise the tests only prove something recovered — never whether anything would have noticed if it hadn't.
- The gentlest-looking failure trigger isn't necessarily the gentlest outcome. A plain
kubectl delete podhonoring graceful termination produced the longest outage of the whole post — worse than a force-delete or a coordinated promote, both of which signal unavailability faster. - Soft preferences and soft anti-affinity can outscore each other. A
weight: 100node preference andpodAntiAffinityType: preferredcompete on the same scoring pass — nothing stops them from landing two instances on the same node. If node-level separation actually matters, it needs to berequired, notpreferred. backupIDalone doesn't pin a restore. It only picks the base backup; withouttargetImmediate: true(or another recovery target), replay continues to the latest available WAL regardless.- A backup you've never restored from is a hypothesis, not a backup. Every one of these findings — the deprecated metrics, the anti-affinity bug, the
backupIDbehavior — was invisible until something actually exercised it for real.
What's Next
bletchley-pg is now instrumented, and it's been through a coordinated promote, a force-killed primary, an accidental failover via plain delete, a full node drain, and a restore from its own backups — every one of them monitored, measured, and survived. The throwaway database and its harness are decommissioned — DatabaseRole/Database deleted first to confirm the retain reclaim policy actually behaves as documented, then the underlying Postgres role and database dropped manually, followed by the OpenBao secret and the Kubernetes-side objects.
Two things are still loose ends, not blocking anything: writing up the offsite restore work (already done, just not posted yet — its own write-up later in this series), and updating my running cluster todo list to reflect that bletchley-pg now joins Garage, OpenBao, and Longhorn on the list of services I check by hand after any cluster-wide event, rather than trusting alerting alone. The decision's made — this post is the reasoning behind it — the list itself just hasn't caught up yet.
Part 5 is next: lldap. The safe, nothing-to-lose first real workload on this cluster.
← Previous: CloudNativePG Part 3
Questions or suggestions? Leave a comment below or reach out at igor@vluwte.nl.