Longhorn Snapshot Overhead: Why the Alerts Were Right and Wrong
prometheus-server at 90% allocated, 5.6 GiB of real data. The alerts fired — but were they firing on the right thing? Snapshots, unreclaimed blocks, trim, and a PromQL join.
Introduction
A few weeks ago the cluster started throwing LonghornVolumeAlmostFull and LonghornVolumeCriticallyFull alerts for the prometheus-server PVC. Longhorn was reporting ~35.8 GiB of allocated space. The filesystem inside the volume had 5.6 GiB of data. The PVC was 40 GiB. By any reasonable measure, there was plenty of room — and yet the alerts kept firing.
The mismatch had a specific cause: Longhorn's reported allocation includes not just the live data in the volume, but also the snapshot chain from the backup job. If you've been searching for why your Longhorn PVC usage far exceeds filesystem size, or why longhorn_volume_actual_size_bytes is much larger than kubelet_volume_stats_used_bytes for the same volume, this is likely why.
This post walks through both the diagnosis and the fix.
🏠 This is part of the Homelab Journey series - building a production Kubernetes cluster from scratch.
- Enabling fstrim on Longhorn Volumes in Talos Linux
- Longhorn Snapshot Overhead: Why the Alerts Were Right and Wrong (you are here)
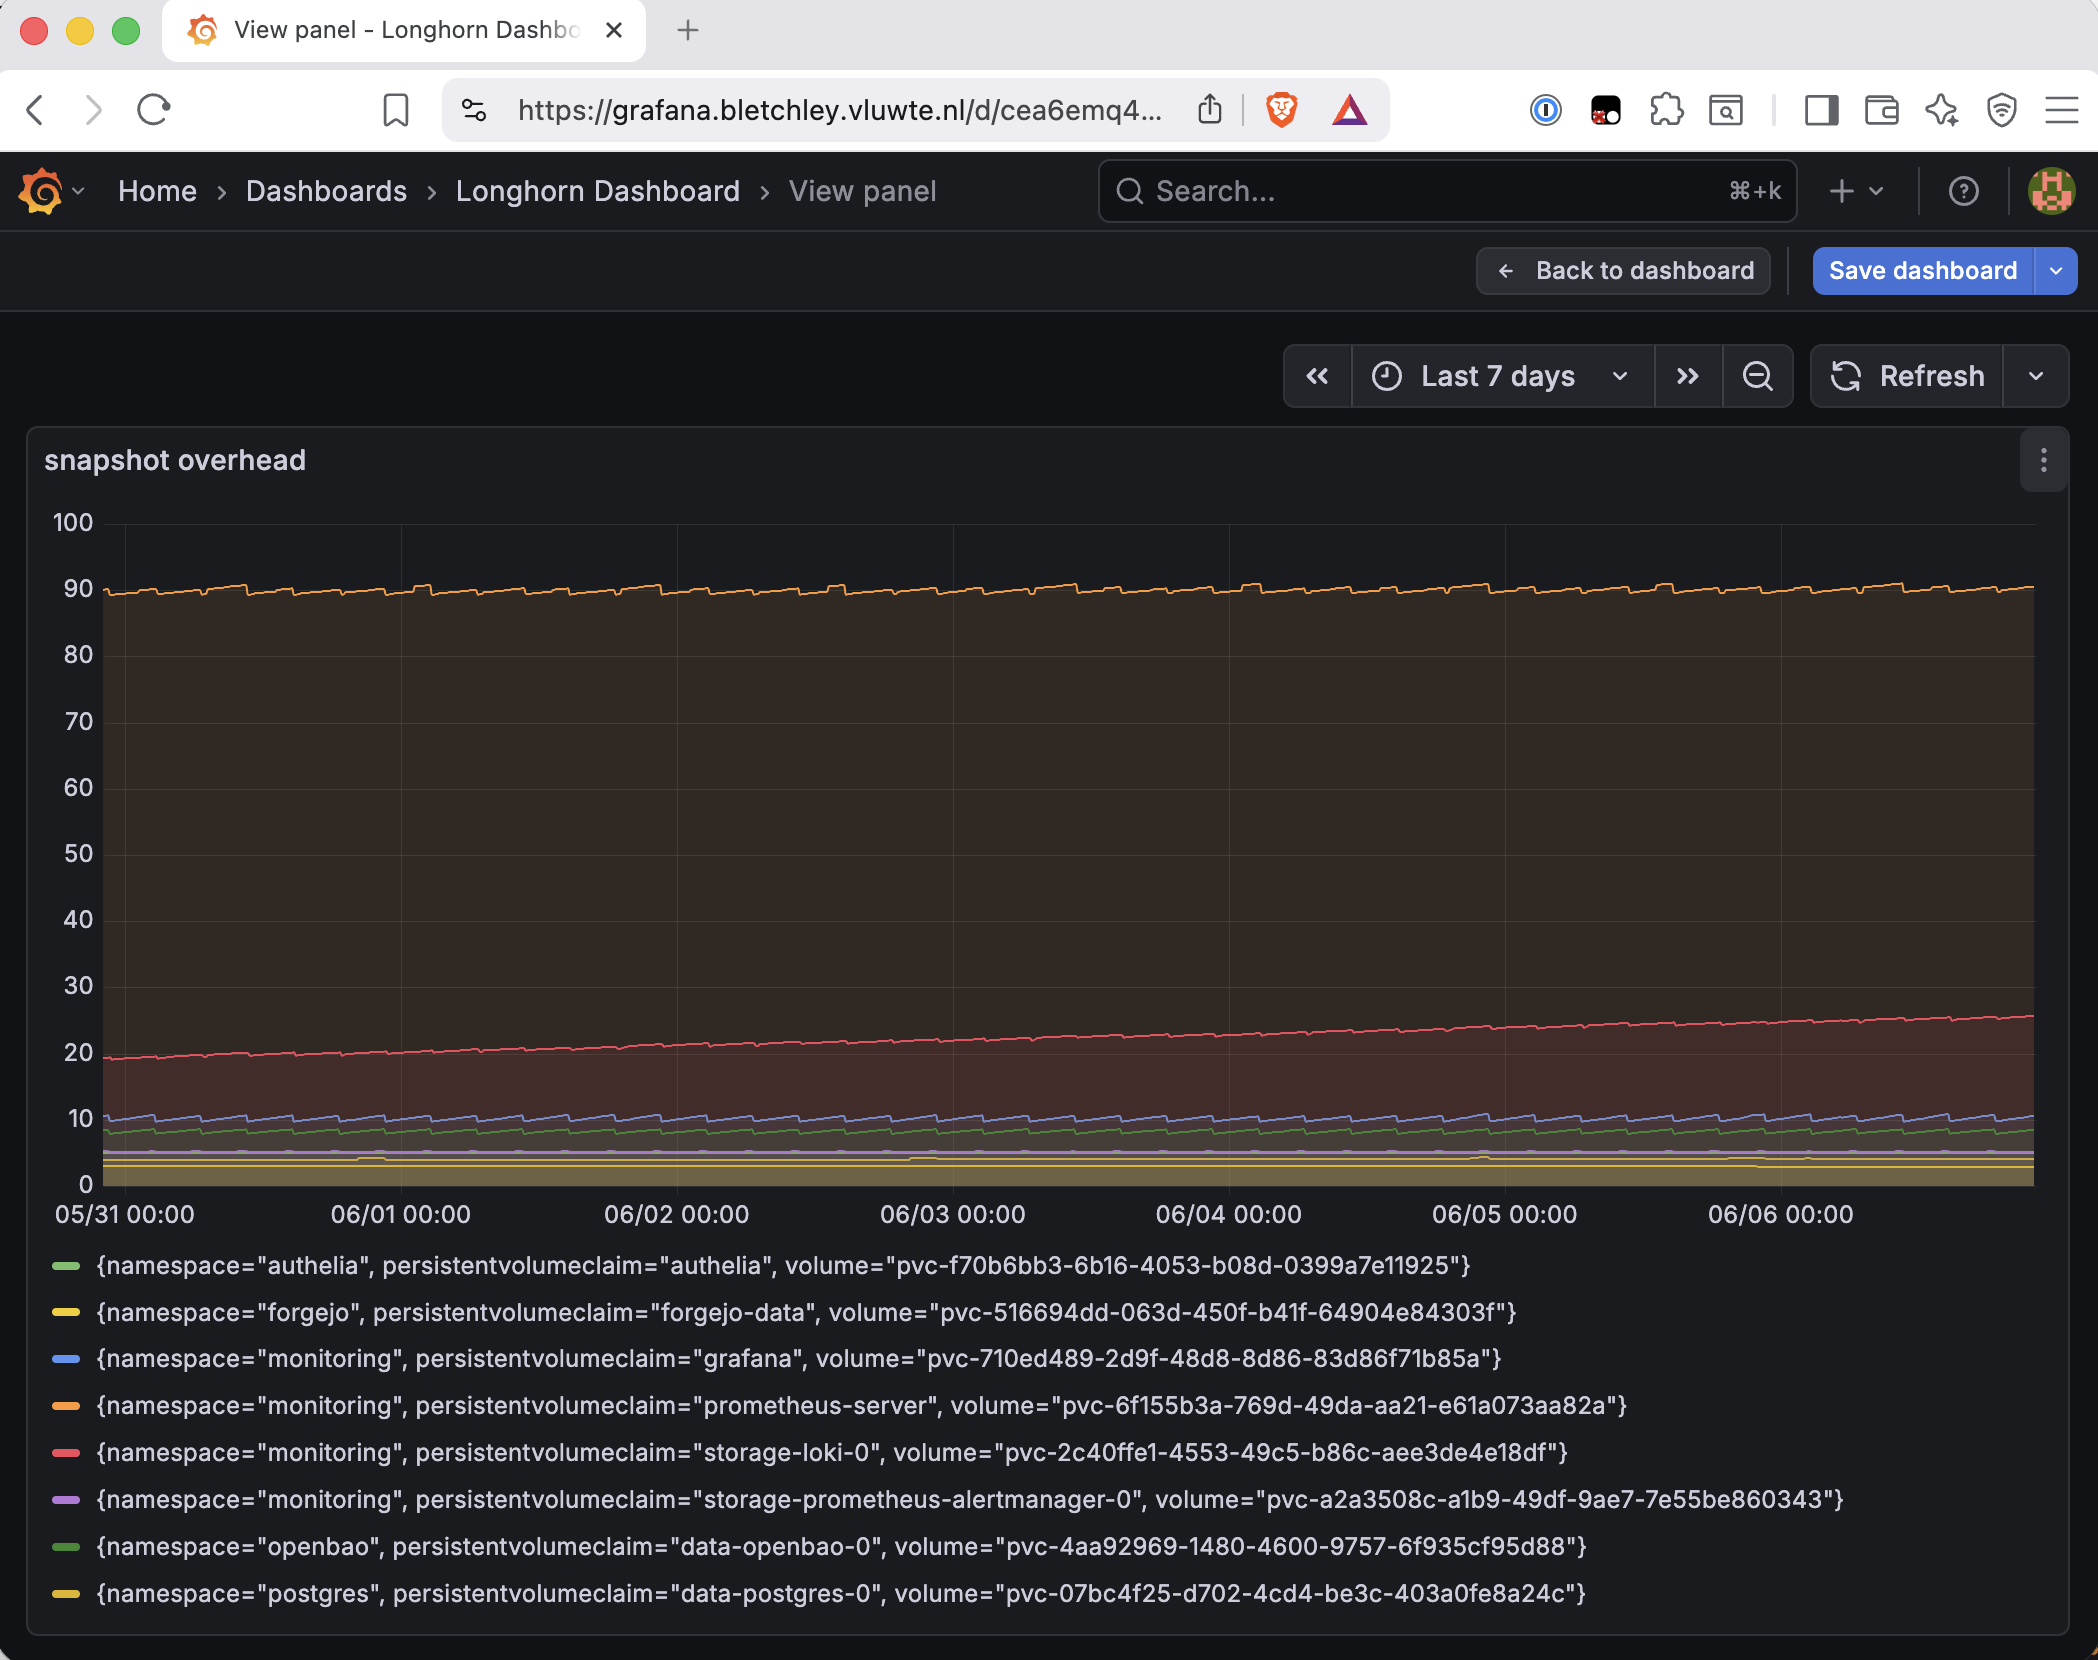
This post follows on directly from Enabling fstrim on Longhorn Volumes in Talos Linux. That post covered what fstrim does and how to set it up. This post covers what happens when fstrim wasn't in place — and the snapshot overhead it leaves behind.
What Is Longhorn Actually Reporting?
longhorn_volume_actual_size_bytes is the sum of all blocks allocated across the volume head and every snapshot on each replica. It is a measure of on-disk block allocation, not filesystem usage. The two numbers are related but not equivalent, and the gap between them depends entirely on write patterns and snapshot history.
The first thing to understand is what Longhorn does with deleted files. Longhorn is a block-level storage system. When a workload deletes a file, the filesystem marks those blocks as free — but Longhorn has no visibility into that. From Longhorn's perspective the blocks are still allocated. This is exactly what fstrim addresses: it signals to Longhorn which blocks the filesystem considers free, so Longhorn can reclaim them. Without fstrim, deleted blocks accumulate indefinitely.
The second thing to understand is how snapshots work. When a snapshot is taken, Longhorn freezes the current volume head into a snapshot and creates a new, nearly-empty volume head for new writes. The snapshot holds all allocated blocks at that moment — including any blocks the filesystem had deleted but fstrim had never told Longhorn about.
Put those two pieces together and the situation on prometheus-server becomes clear. The volume had been running for weeks without fstrim. Prometheus TSDB writes and rewrites blocks continuously — compaction deletes old blocks and writes new ones constantly. Without fstrim, every one of those deleted-but-not-reclaimed blocks accumulated in the volume head. Each backup cycle then created a snapshot of that bloated volume head, capturing all the unreclaimed blocks faithfully.
The 40 GiB nominal size is also not a hard ceiling — per the Longhorn documentation, actual_size can exceed it if enough snapshots are retained — so there was nothing preventing this from growing further.
Looking at the snapshot directly made the problem obvious:
kubectl -n longhorn-system get snapshots.longhorn.io \
  -l longhornvolume=pvc-6f155b3a-769d-49da-aa21-e61a073aa82a \
  -o custom-columns=\
NAME:.metadata.name,\
CREATED:.metadata.creationTimestamp,\
SIZE:.status.size,\
READYTOUSE:.status.readyToUse,\
REMOVED:.status.markRemoved

NAME                                            CREATED                SIZE          READYTOUSE   REMOVED
backup-m-c1785c3b-dee0-4caa-acd7-b1d7d033f72f   2026-06-06T08:30:01Z   38513410048   true         false
Snapshot SIZE: 38513410048 bytes — 35.87 GiB. The entire discrepancy, sitting in one snapshot. 5.6 GiB of actual Prometheus data; 35.87 GiB of blocks that Longhorn had never been told were free.
With UnmapMarkSnapChainRemoved disabled (the default), fstrim only reaches the volume head. It cannot touch snapshot blocks. Those blocks stay allocated until the snapshot chain is superseded by a clean one — which requires enabling the setting and letting several trim + backup cycles run through.
The Alert Problem
With that diagnosis confirmed, the original alert problem became clearer. LonghornVolumeAlmostFull and LonghornVolumeCriticallyFull use longhorn_volume_actual_size_bytes — so they were firing at 90% allocated because 90% of the 40 GiB PVC was genuinely allocated on disk, mostly in the snapshot. The alerts fired as configured. Whether they were firing on the right thing is a different question.
Both rules measure actual_size against the nominal PVC size — but as the Longhorn documentation notes, actual_size can exceed that nominal size entirely. The real ceiling is node disk space, which these rules don't measure at all. Neither rule gave any indication of why actual_size was high — whether the workload was writing a lot of data, or whether unreclaimed snapshot blocks were the culprit.
Building the Alert Rule
Adding a dedicated signal for the snapshot case was the right first step. The goal is to detect when the total Longhorn allocation is disproportionately large relative to the PVC size — and for that, only Longhorn metrics are needed:
(
  longhorn_volume_actual_size_bytes
  * on(volume) group_left(namespace, persistentvolumeclaim)
  label_replace(kube_persistentvolumeclaim_info, "volume", "$1", "volumename", "(.*)")
)
/ on(volume, namespace, persistentvolumeclaim)
(
  longhorn_volume_capacity_bytes
  * on(volume) group_left(namespace, persistentvolumeclaim)
  label_replace(kube_persistentvolumeclaim_info, "volume", "$1", "volumename", "(.*)")
)
* 100 > 15
The label_replace + kube_persistentvolumeclaim_info join is necessary because longhorn_volume_actual_size_bytes uses a volume label containing the PVC UID (e.g. pvc-6f155b3a-...), while most Kubernetes-facing metrics use namespace + persistentvolumeclaim. These two label sets can't be directly joined. kube_persistentvolumeclaim_info from kube-state-metrics has both volumename (the PVC UID) and persistentvolumeclaim + namespace — it's the bridge.
The expression also needed explicit parentheses to get operator precedence right. PromQL evaluates binary operations left to right, so without the outer grouping the division applies only to part of the expression. After the first correction the rule fired on all 8 volumes (wrong parenthesis placement). After the second it narrowed to prometheus-server and loki only — which is exactly right.
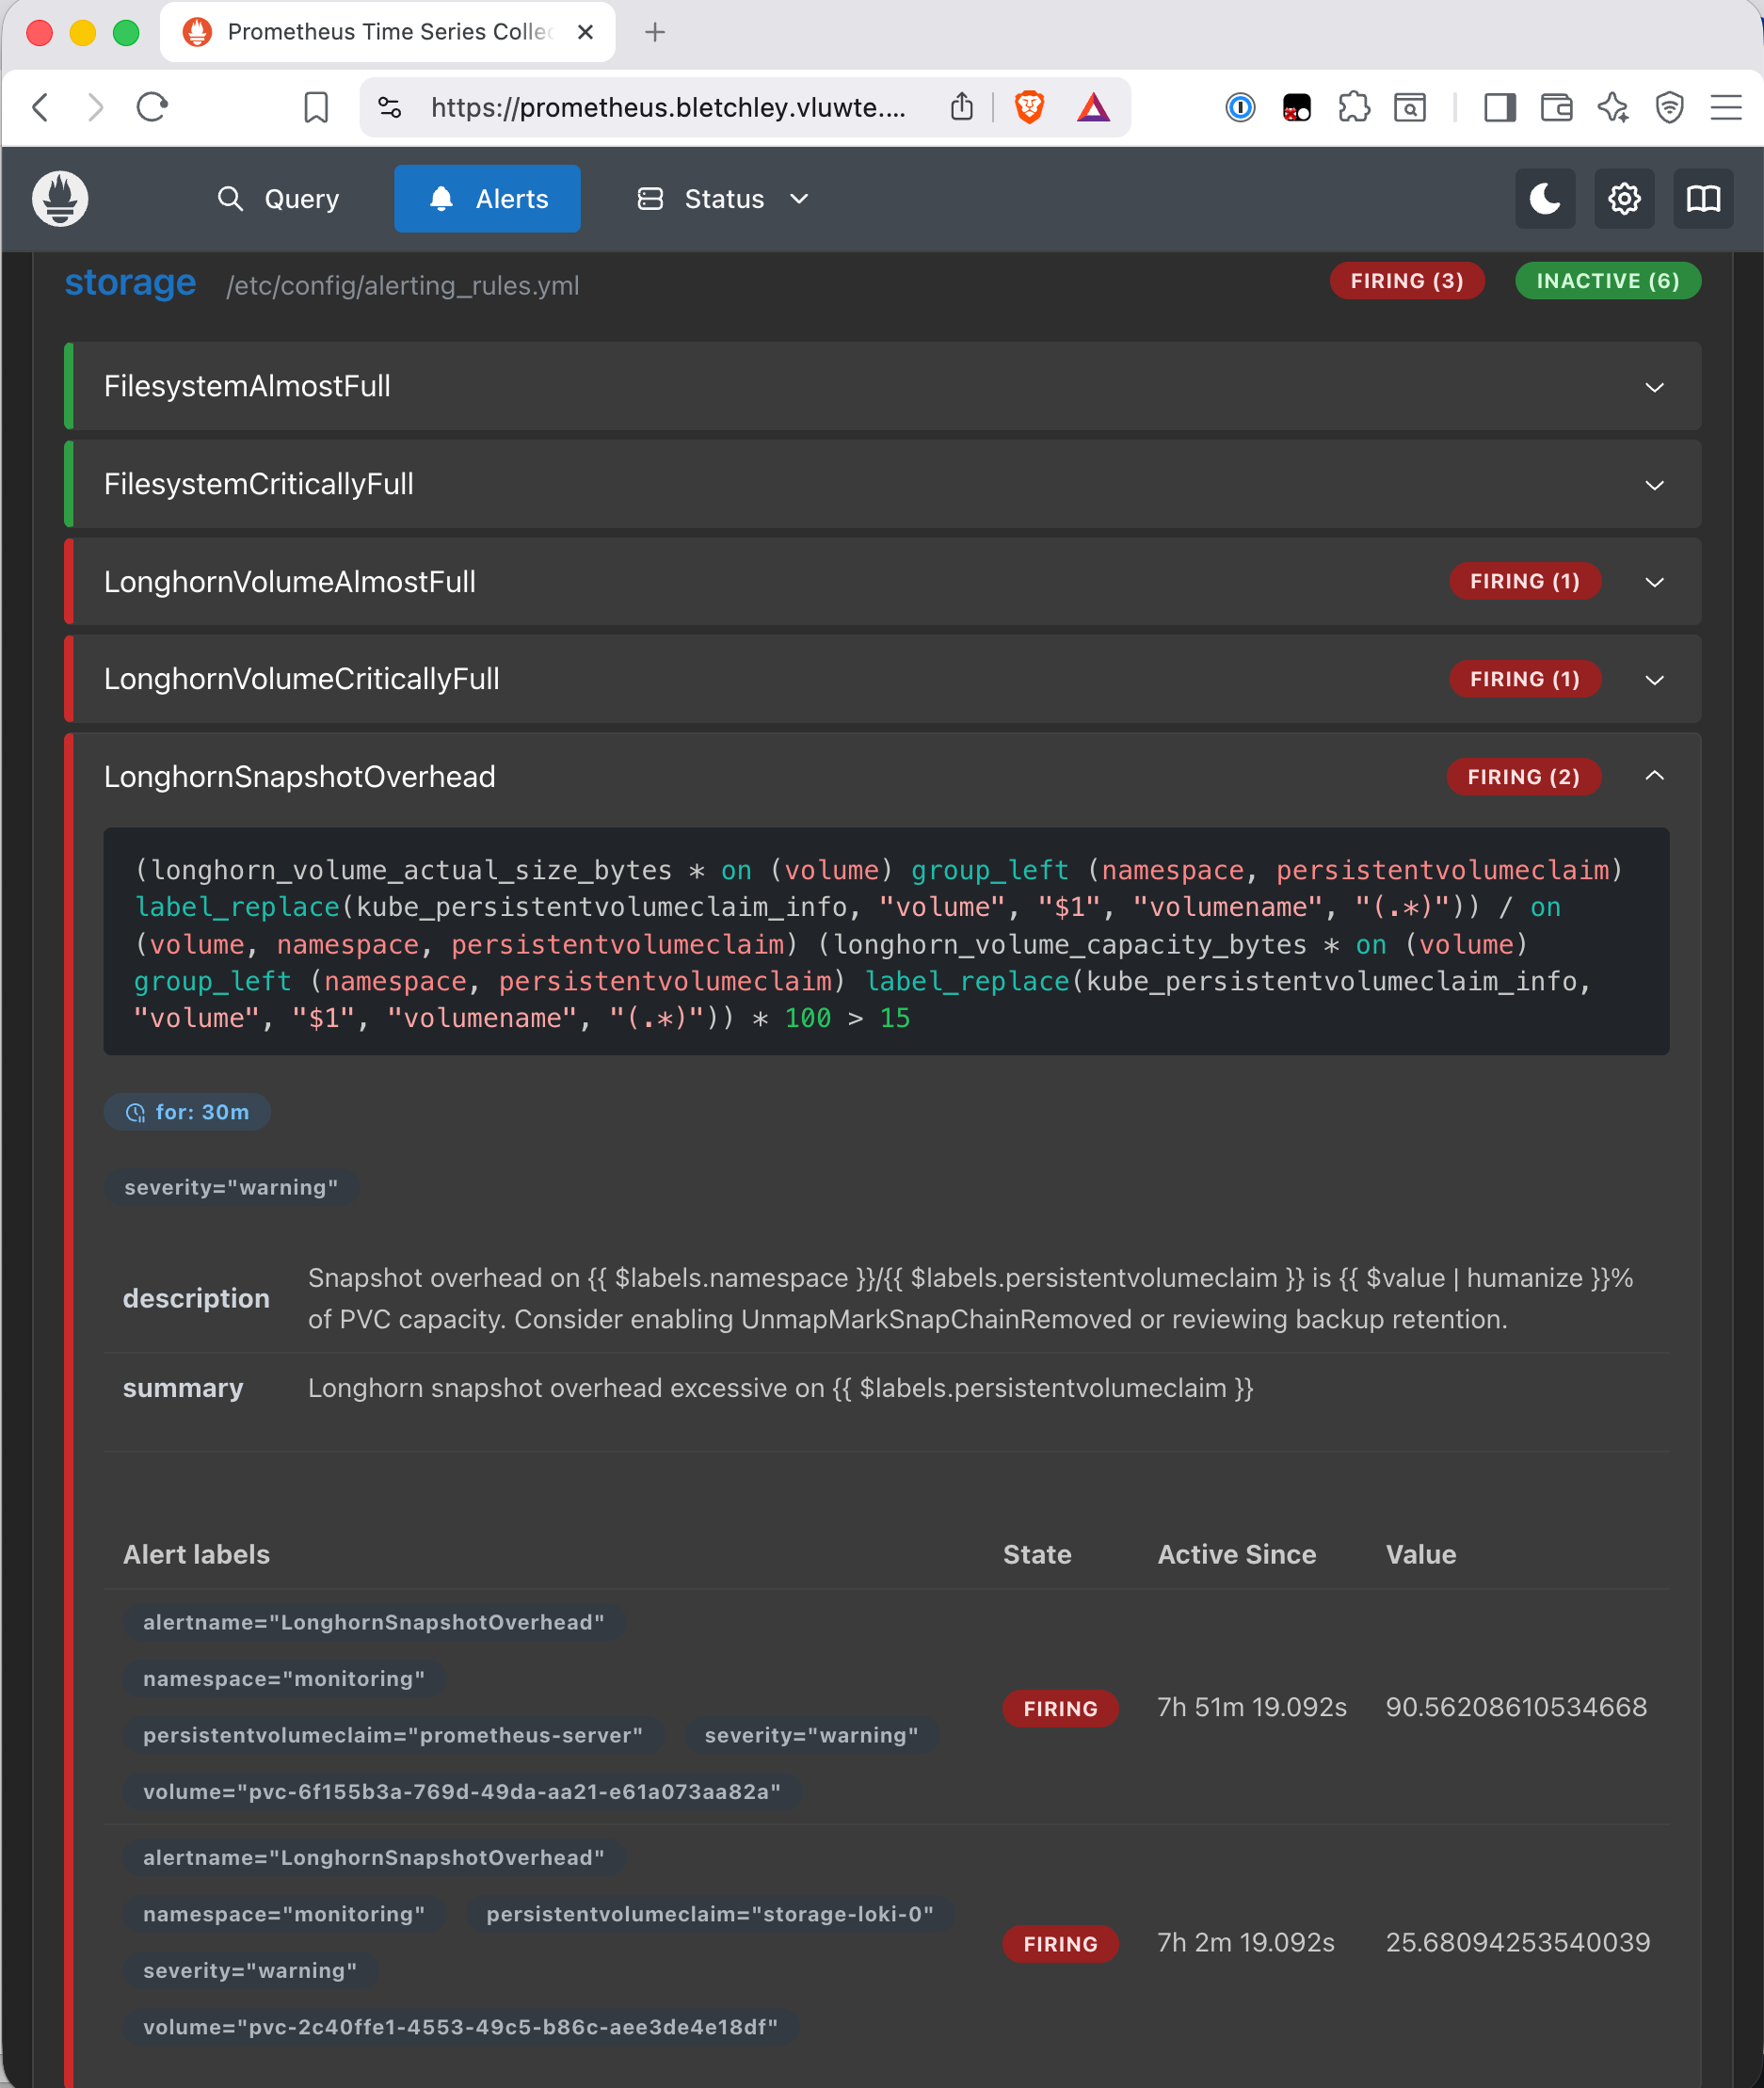
The full alert rule added to apps/monitoring/prometheus/rules/longhorn.yaml:
- alert: LonghornSnapshotOverhead
  expr: |
    (
      longhorn_volume_actual_size_bytes
      * on(volume) group_left(namespace, persistentvolumeclaim)
      label_replace(kube_persistentvolumeclaim_info, "volume", "$1", "volumename", "(.*)")
    )
    / on(volume, namespace, persistentvolumeclaim)
    (
      longhorn_volume_capacity_bytes
      * on(volume) group_left(namespace, persistentvolumeclaim)
      label_replace(kube_persistentvolumeclaim_info, "volume", "$1", "volumename", "(.*)")
    )
    * 100 > 15
  for: 30m
  labels:
    severity: warning
  annotations:
    summary: "Longhorn snapshot overhead excessive on {{ $labels.persistentvolumeclaim }}"
    description: >
      Snapshot overhead on {{ $labels.namespace }}/{{ $labels.persistentvolumeclaim }}
      is {{ $value | humanize }}% of PVC capacity.
      Consider enabling UnmapMarkSnapChainRemoved or reviewing backup retention.
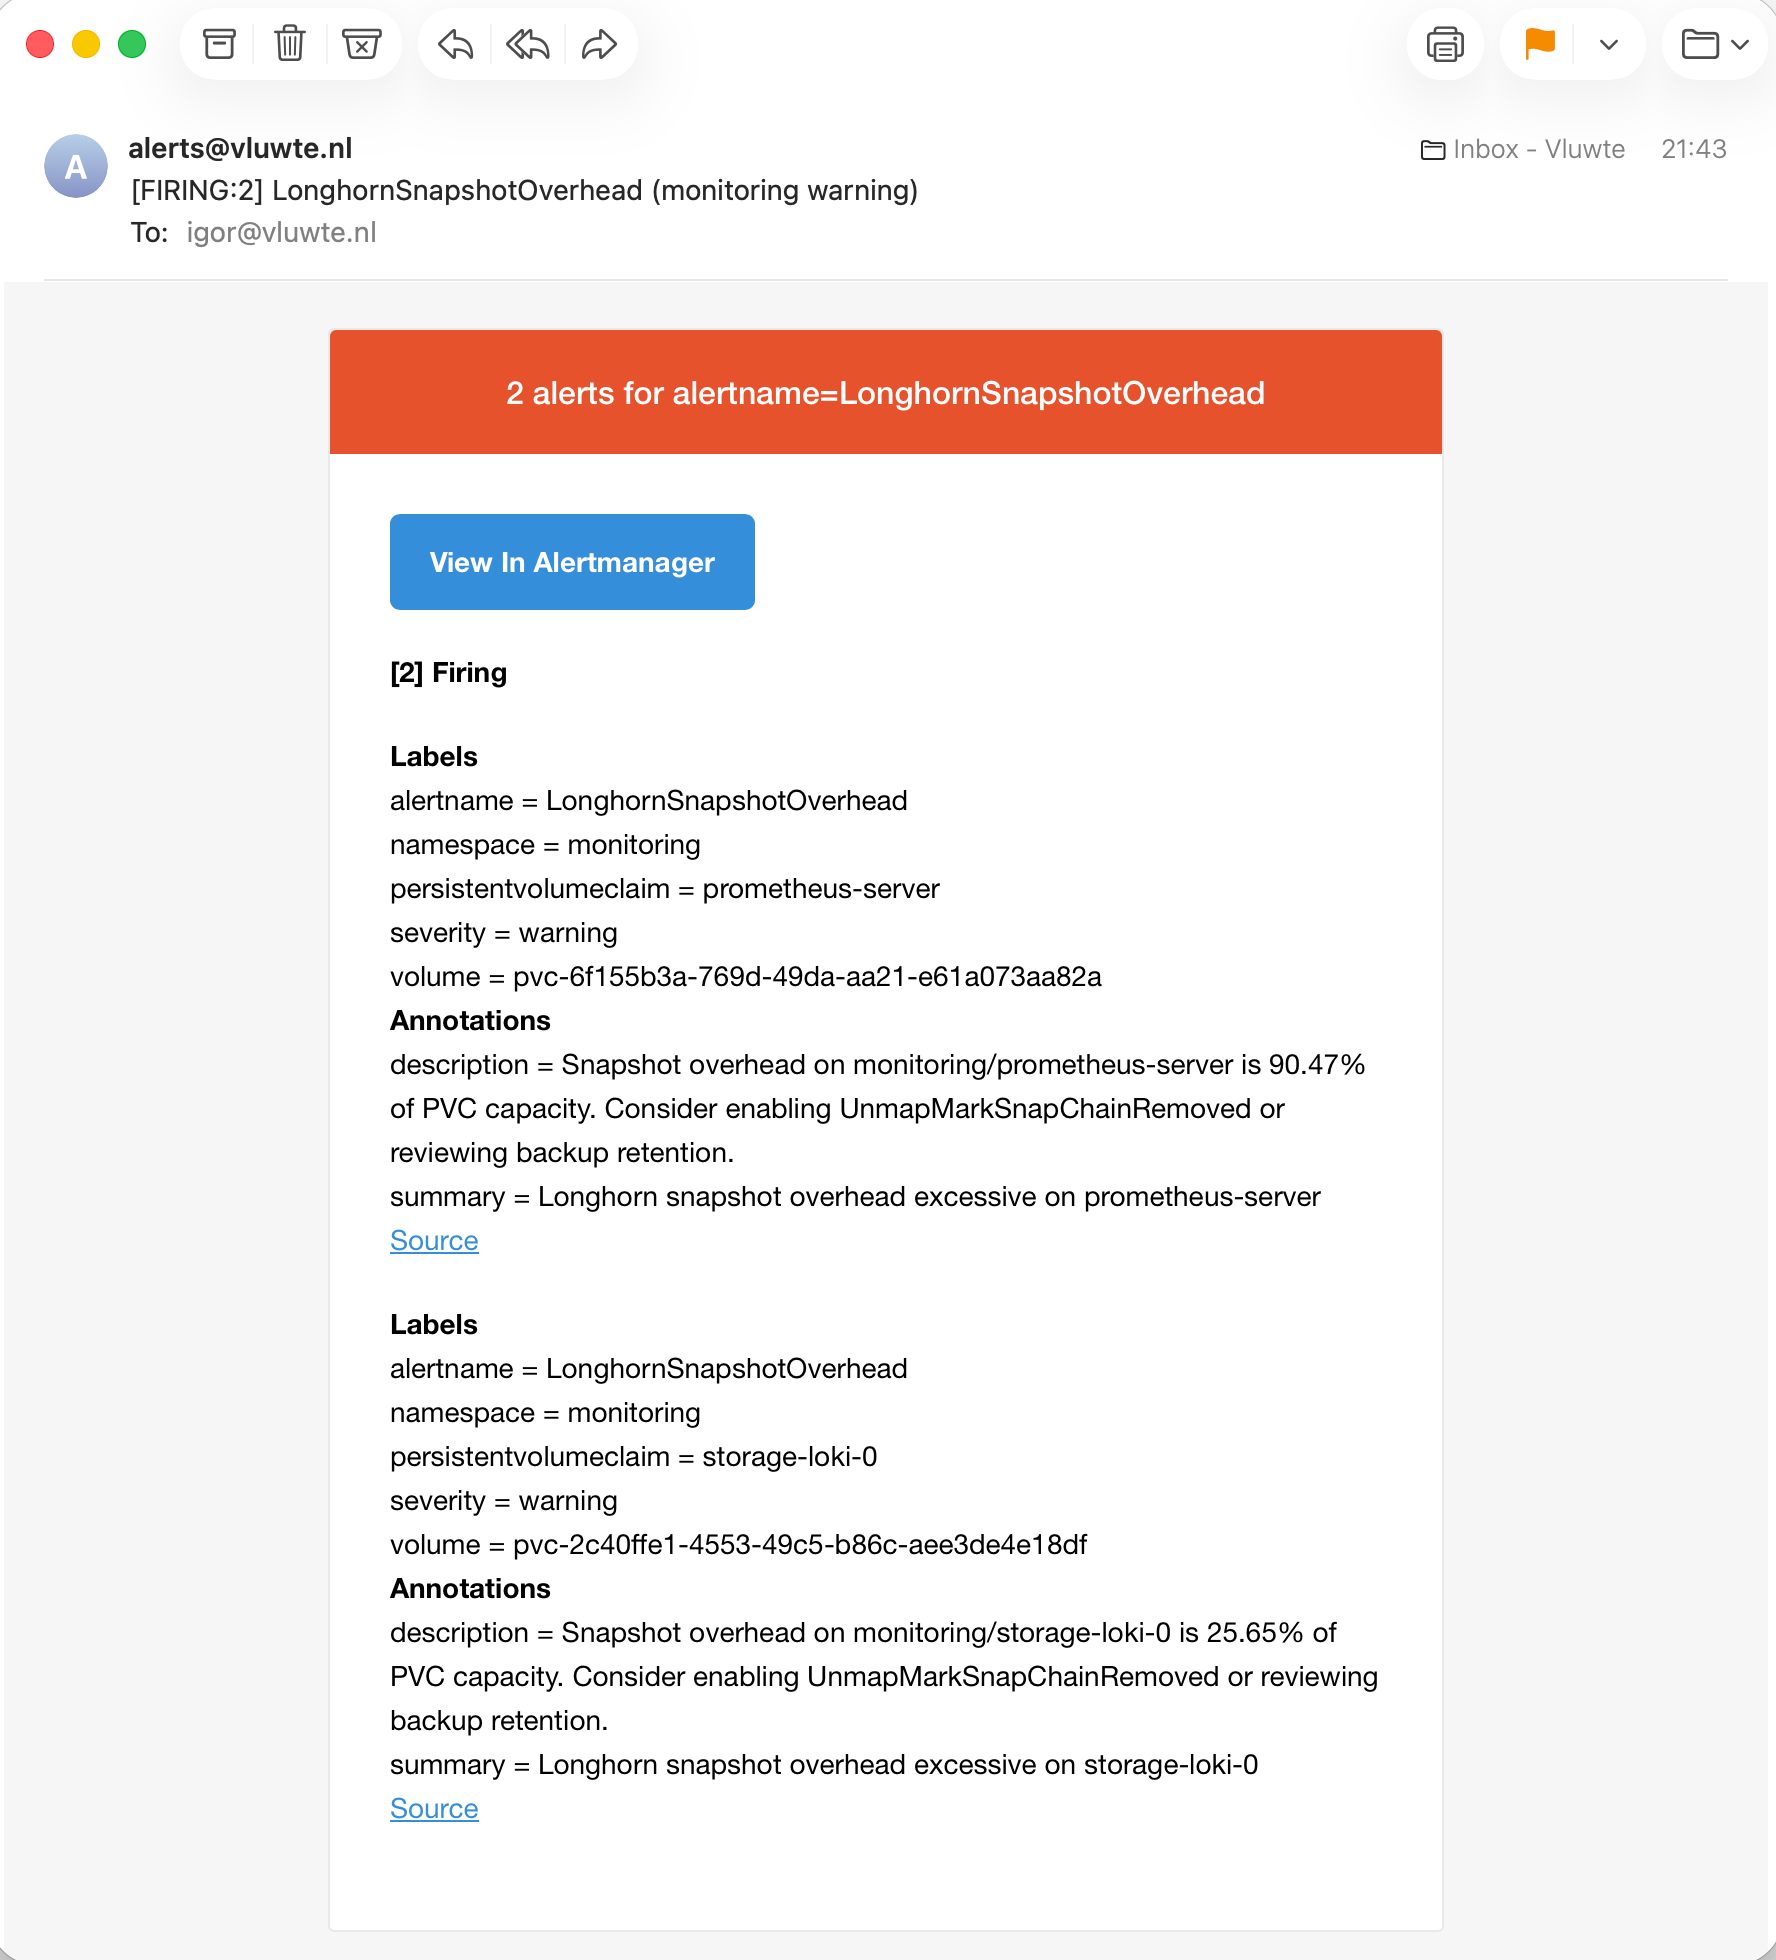
After deploying via helm upgrade, the alert fired as expected and the email confirmed Alertmanager routing was working end to end.
Enabling Snapshot Removal During Trim
With the alert rule in place and confirmed firing correctly, the next step was enabling UnmapMarkSnapChainRemoved per-volume so the daily trim job at 03:15 could actually reach the snapshot blocks.
The planned approach was a kubectl label command:
kubectl -n longhorn-system label volumes.longhorn.io \
  pvc-6f155b3a-769d-49da-aa21-e61a073aa82a \
  setting.longhorn.io/remove-snapshots-during-filesystem-trim=enabled \
  --overwrite
The command returned success. Re-checking the labels showed the value back at ignored. Longhorn reconciles that label back immediately — the label is read by the controller and translated into internal state, but the label value itself is always reset to reflect the controller's current understanding, not the requested value. A kubectl patch on the spec field gave the same result.
The Longhorn UI is the source of truth for this setting. Under Volumes → select the volume → the operations menu → Allow Snapshots Removal During Trim → set to enabled. The actual confirmation that the setting was active came from the Longhorn controller log:
Controller checked and corrected flag unmapMarkSnapChainRemoved=true for backend replicas
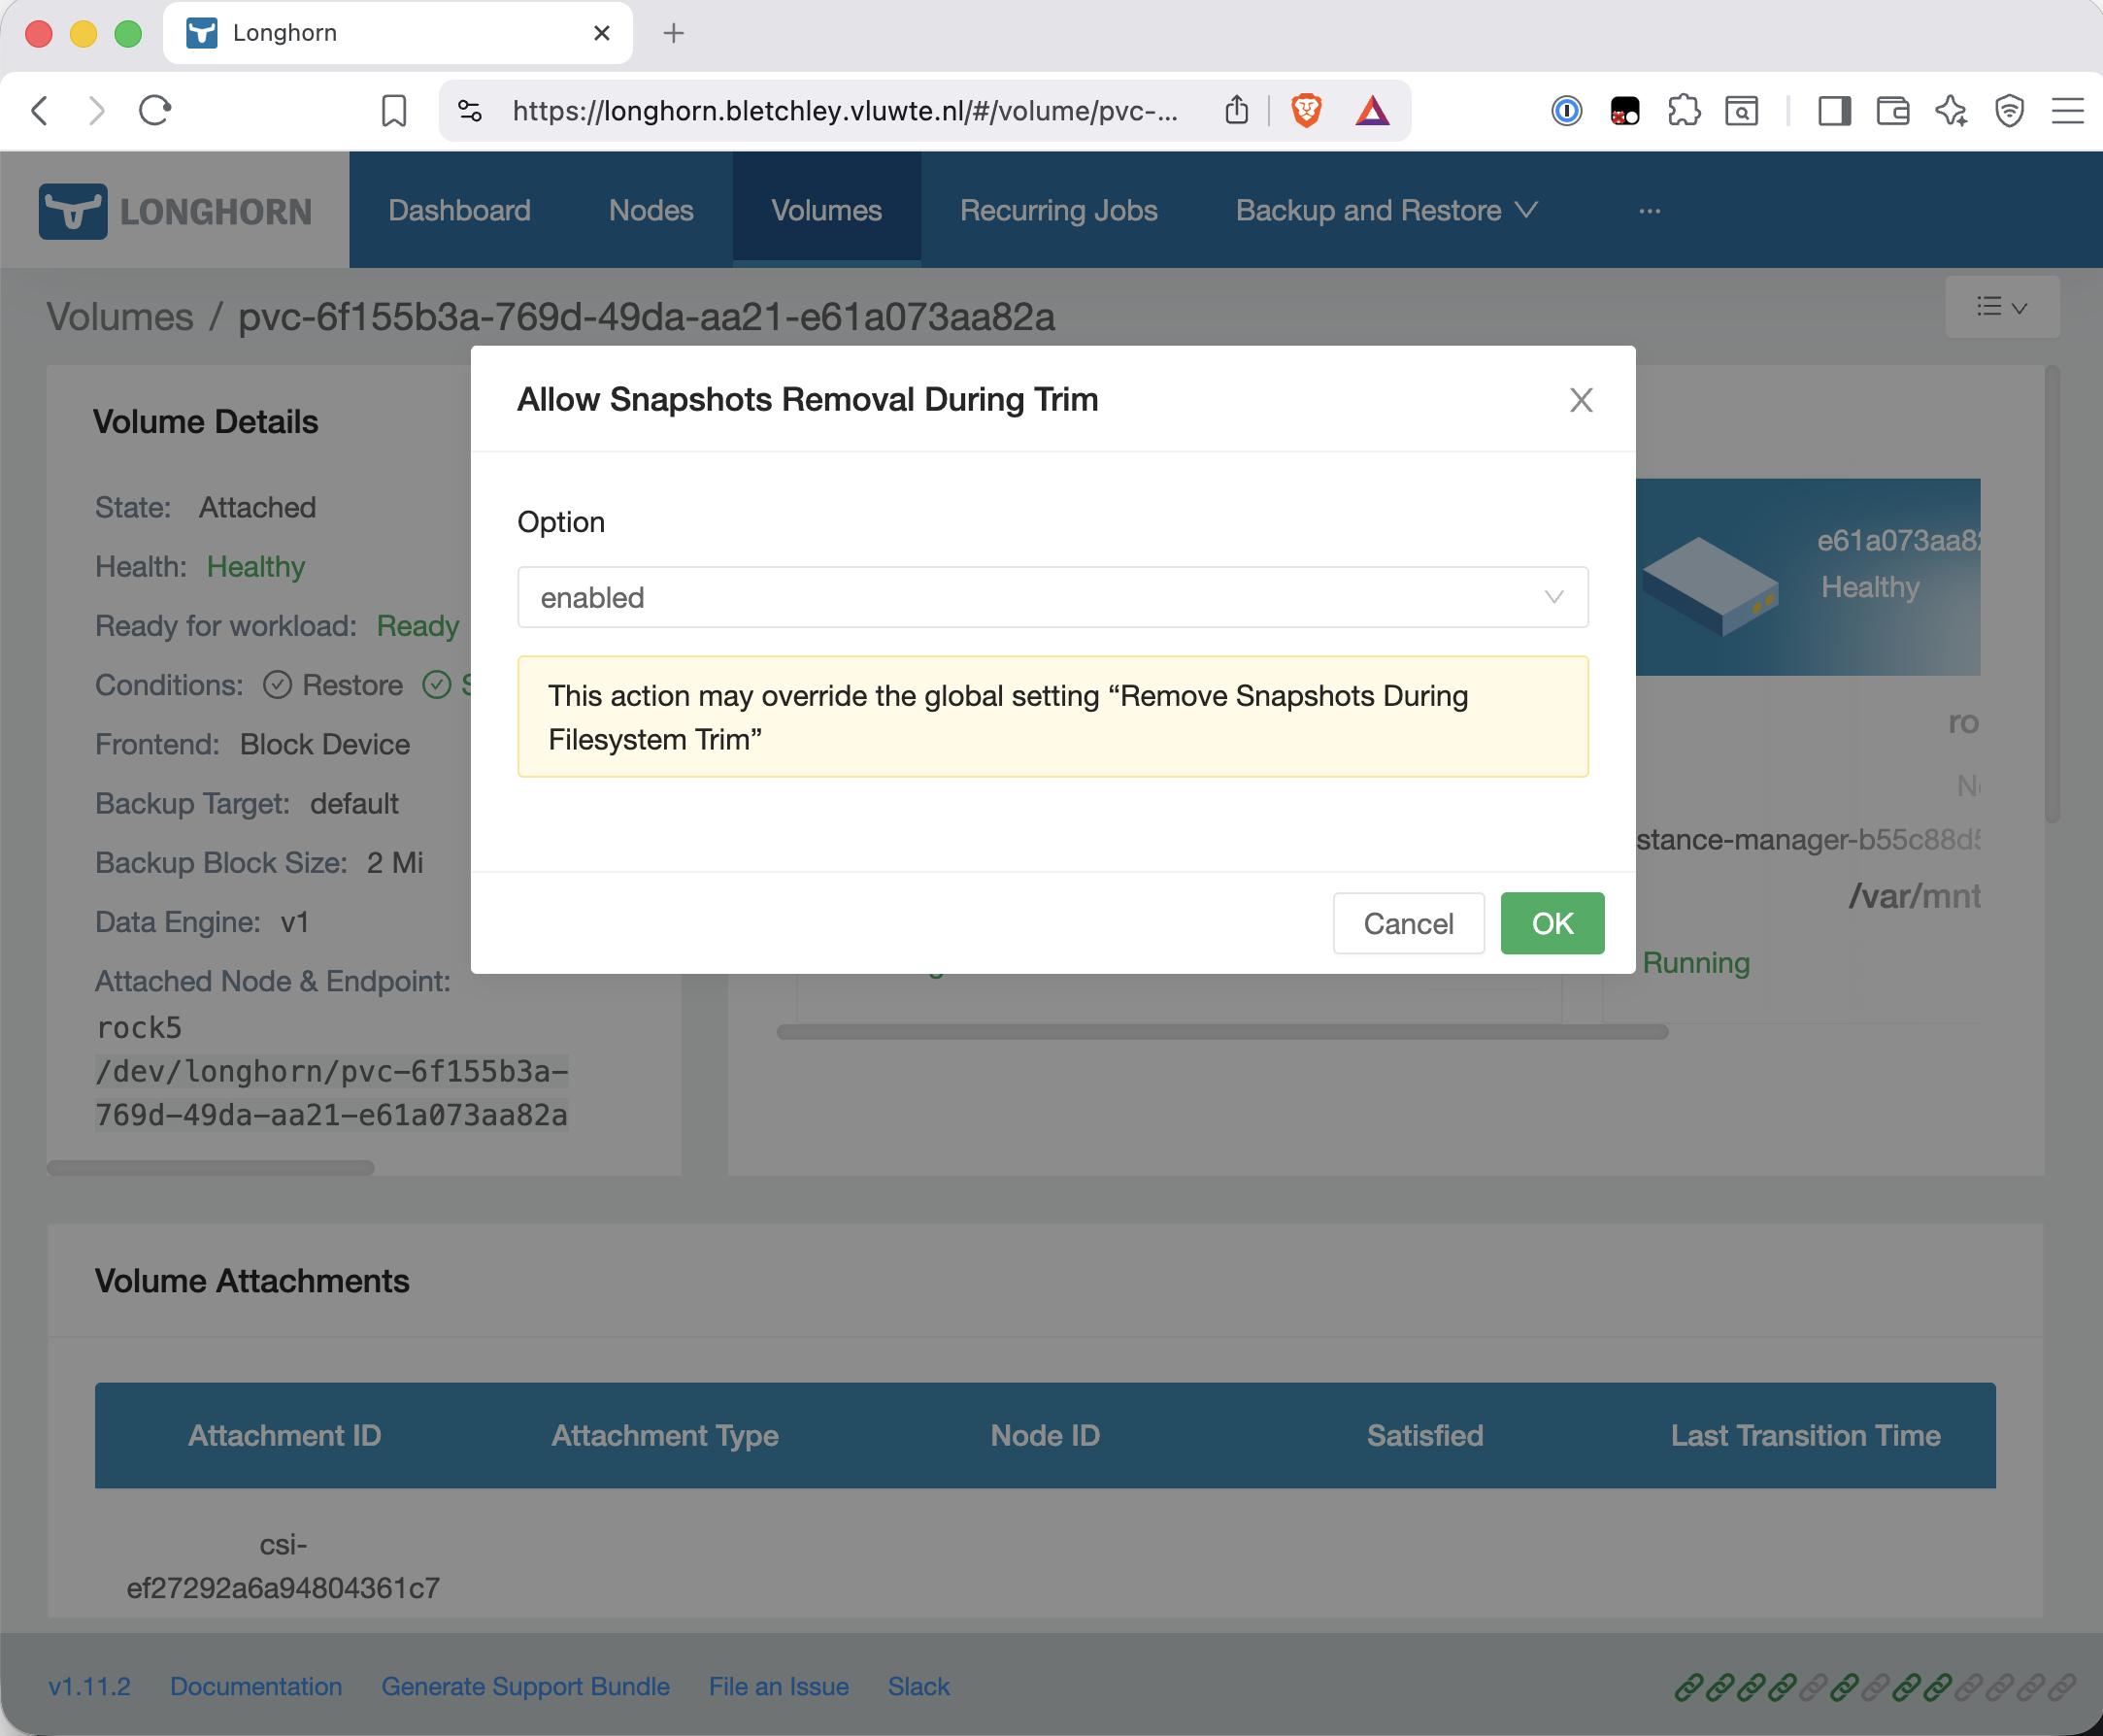
The same setting was enabled on the loki PVC (storage-loki-0) after the Grafana panel confirmed it was also accumulating overhead.
Watching It Work
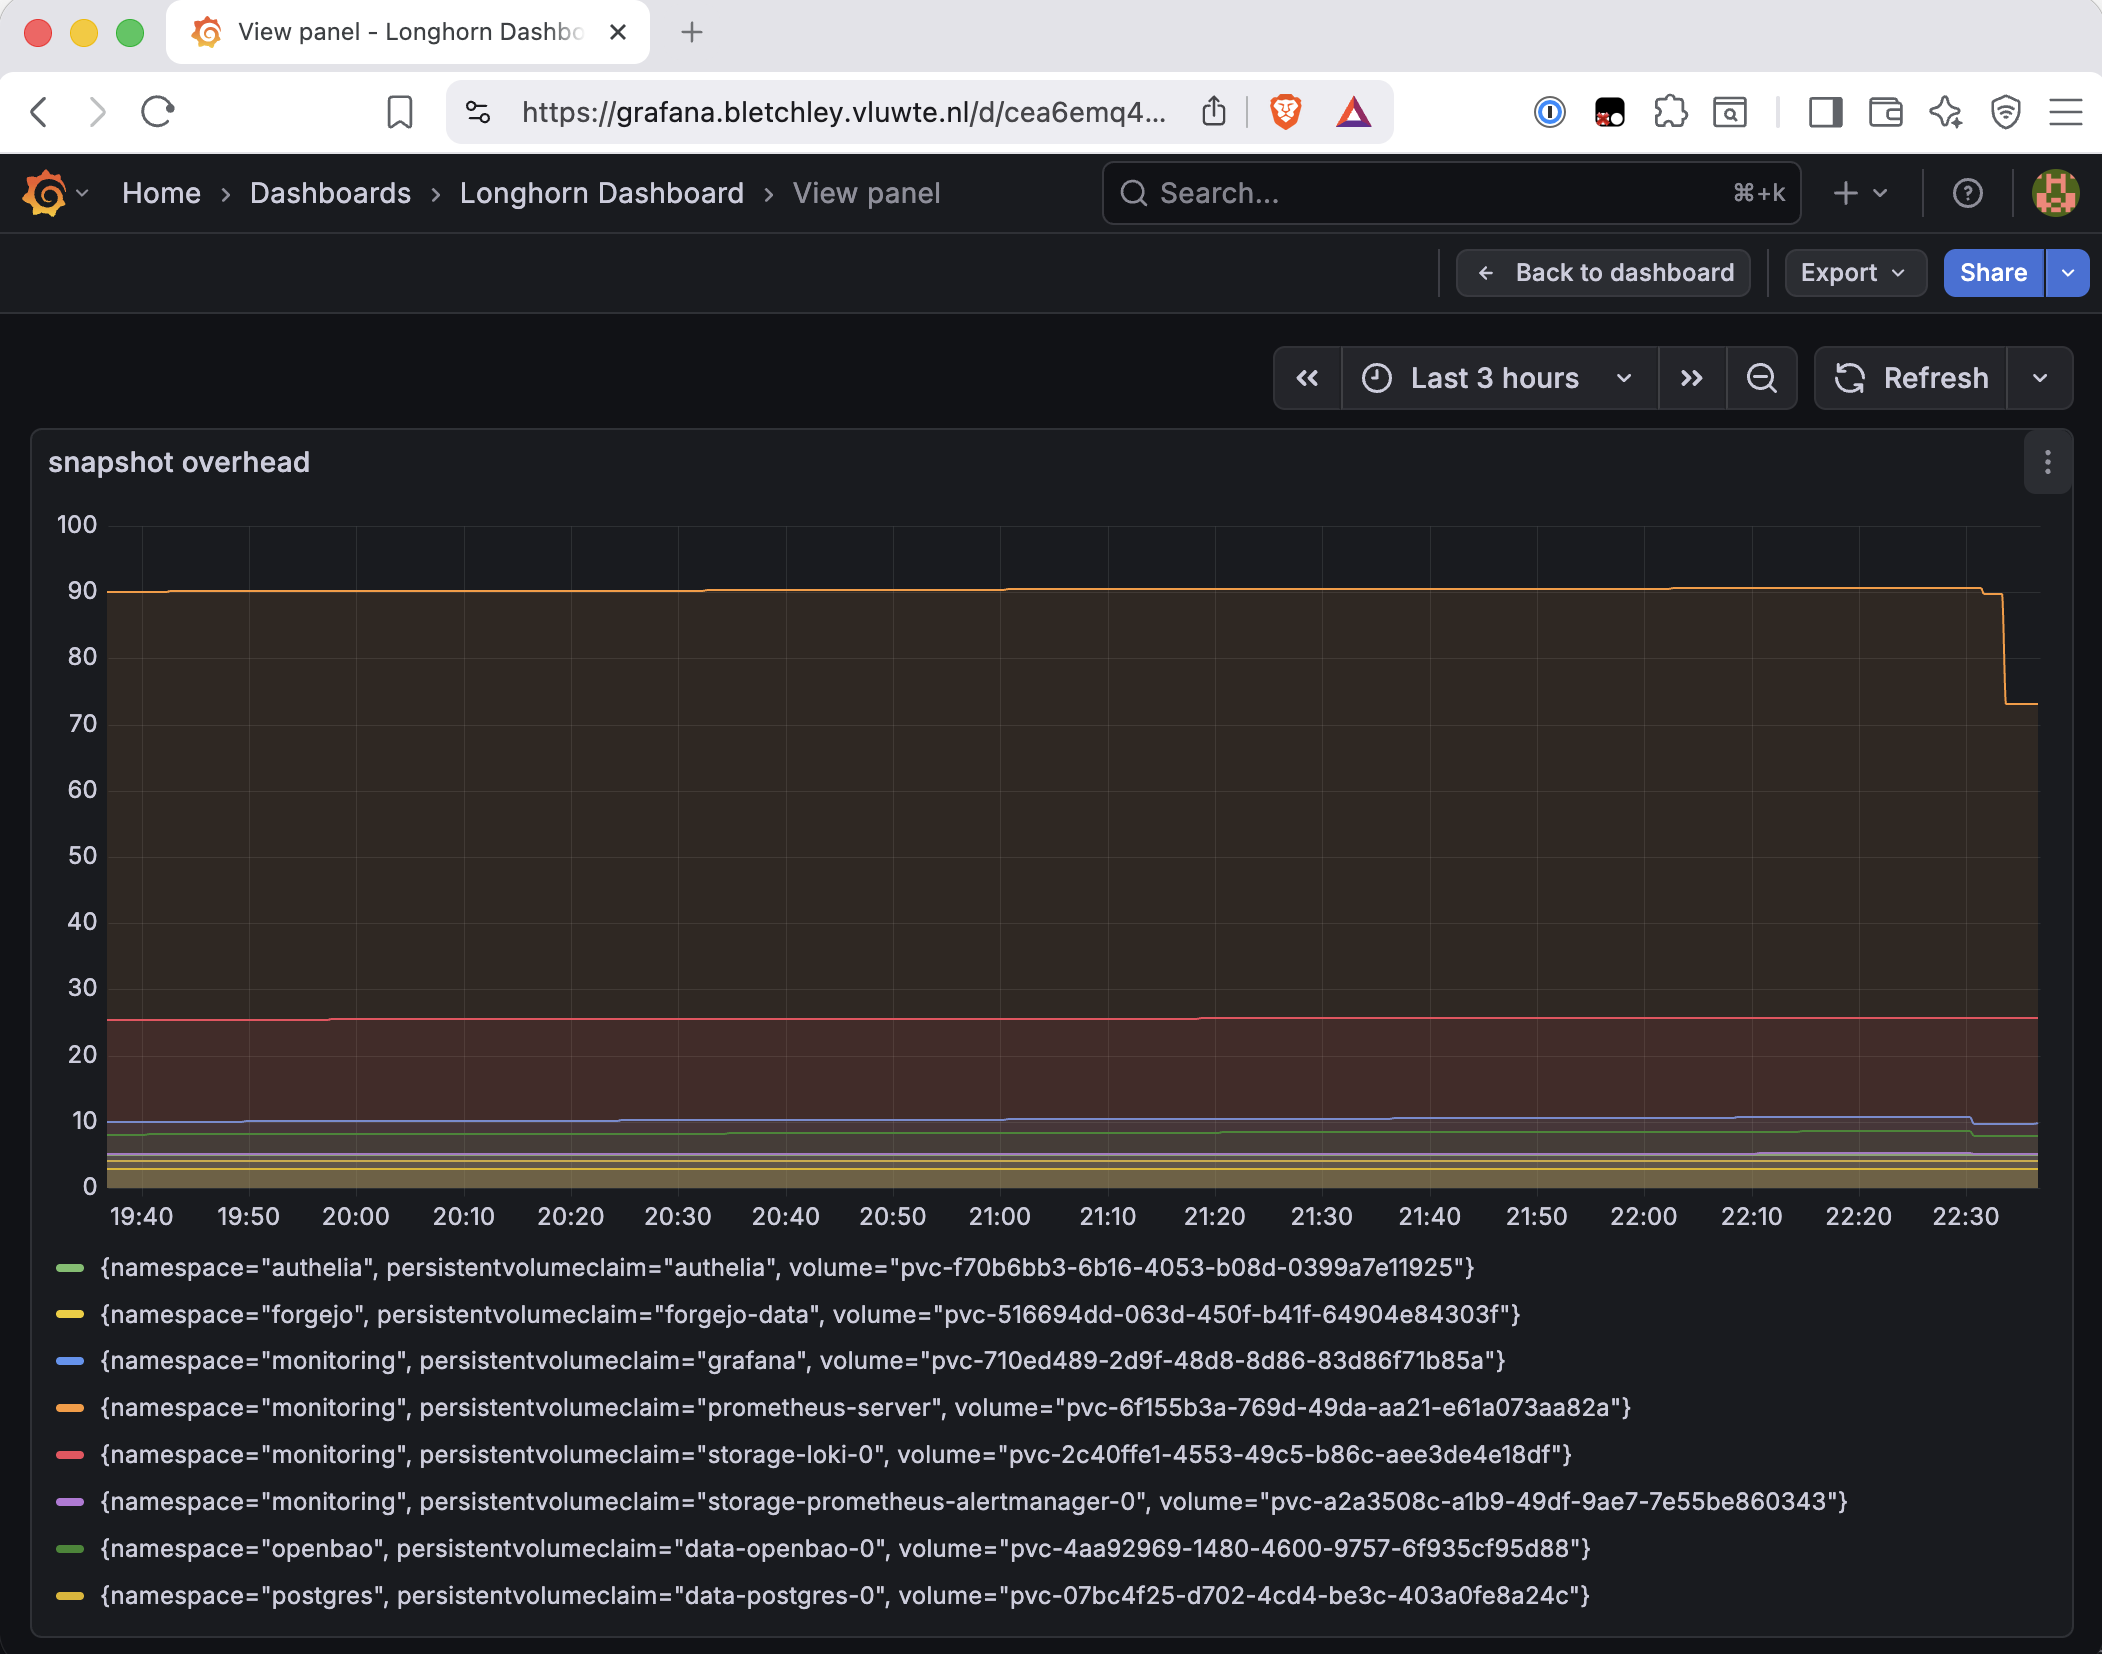
A manual trim run immediately after enabling the setting brought prometheus-server from ~90% down to ~73% — visible as an abrupt drop in Grafana. That was the first trim reaching snapshot blocks. The next day's automatic trim at 03:15 brought it to ~70%.
The reduction isn't immediate because the old snapshot chain must be progressively replaced before those blocks can be reclaimed. Each full backup cycle replaces part of the old chain with a clean one built on top of a properly trimmed volume head. The rate of decrease slows as the remaining bloat shrinks — which is exactly what the backup table shows.
I ran the following kubectl command to extract backup information from Longhorn:
kubectl -n longhorn-system get backups.longhorn.io \
  -l longhornvolume=pvc-6f155b3a-769d-49da-aa21-e61a073aa82a \
  --sort-by=.metadata.creationTimestamp \
  -o custom-columns=\
NAME:.metadata.name,\
CREATED:.metadata.creationTimestamp,\
MODE:.status.backupMode,\
SIZE:.status.size,\
RE-UPLOADED:.status.reUploadedSize,\
NEWLY-UPLOADED:.status.newlyUploadedSize,\
STATE:.status.state
The table below is reconstructed across several days — the environment retains a maximum of 8 backups at a time, so this was captured incrementally as older entries were pruned. It shows what happened after enabling UnmapMarkSnapChainRemoved:
NAME                      CREATED                MODE          SIZE          RE-UPLOADED   NEWLY-UPLOADED
backup-afa21b80609d4a4c   2026-06-06T16:48:16Z   full          38717620224   22993446104   213606664
backup-6eea1333bf8941a1   2026-06-06T20:30:21Z   incremental   38717620224   0             264317602
backup-8611d44e124b4591   2026-06-07T00:30:37Z   incremental   38719717376   0             396296405
backup-f7448e1aa31244f4   2026-06-07T04:30:18Z   incremental   38824574976   0             195673681
backup-4c75886754b54b7f   2026-06-07T08:44:35Z   full          30167531520   17568215938   279458487
backup-3706d868c87f4ceb   2026-06-07T12:30:21Z   incremental   30333206528   0             255840418
backup-fff4a921924e4d89   2026-06-07T16:30:19Z   incremental   30398218240   0             213499736
backup-85ae8c46b47f4e14   2026-06-07T20:30:29Z   incremental   30421286912   0             396895895
backup-dc3945630f3640c1   2026-06-08T00:44:35Z   full          30452744192   17794438846   264729338
backup-e175b0b06b0c4b39   2026-06-08T04:30:19Z   incremental   30553407488   0             199707502
backup-ddb9d69ce2fc4c57   2026-06-08T08:30:22Z   incremental   30775705600   0             255575111
backup-e9a60f325329457c   2026-06-08T12:30:30Z   incremental   30928797696   0             405184239
backup-219f7d9850c948cf   2026-06-08T16:42:54Z   full          26323451904   15407739915   216168581
backup-9579f8ca624745ce   2026-06-08T20:30:22Z   incremental   26474446848   0             264615826
backup-44edbf6a85fe462d   2026-06-09T00:30:23Z   incremental   26568818688   0             264983705
backup-c69d69e92640456d   2026-06-09T04:30:22Z   incremental   26642219008   0             195657140
backup-2208f4f318364838   2026-06-09T08:41:05Z   full          23320330240   13400721118   393180539
backup-8619b05cdeb94aa0   2026-06-09T12:30:22Z   incremental   23406313472   0             256676928
backup-9bd15156c4144062   2026-06-09T16:30:20Z   incremental   23460839424   0             208000458
The SIZE column tells the story — it's the uncompressed on-disk snapshot size, and it's trending down with each full backup cycle as the old bloated chain is progressively replaced:
- Jun 6 16:48 (first full after enabling): 38.7 GiB
- Jun 7 08:44: 30.1 GiB
- Jun 8 00:44: 30.4 GiB
- Jun 8 16:42: 26.3 GiB
- Jun 9 08:41: 23.3 GiB
All incrementals show RE-UPLOADED: 0 — no disruption to the backup chain. The NEWLY-UPLOADED values per incremental are consistently ~200–400 MB, which represents the actual block change rate per 4-hour cycle — Prometheus TSDB churn, not historical unreclaimed blocks. That's the number the snapshot SIZE should eventually converge toward: roughly 8 cycles × ~250 MB = ~2 GiB, which on a 40 GiB PVC is well under 15%. The trend is still in progress at the time of writing.
Lessons Learned
longhorn_volume_actual_size_bytesincludes snapshot blocks, not just live data. Without fstrim, deleted blocks are never reclaimed — and snapshots faithfully capture those unreclaimed blocks every backup cycle. The gap betweenactual_sizeand filesystem usage reflects the accumulated history of every block Longhorn was never told was free.- fstrim and
UnmapMarkSnapChainRemovedare separate mechanisms that both need to be in place. fstrim reclaims the volume head.UnmapMarkSnapChainRemovedallows trim to also reach snapshot blocks. Enabling fstrim alone — which the previous post covered — wasn't enough. The snapshot chain was already bloated; the second setting is what allows trim to reach it. - Build visibility before intervening. Adding the Grafana panel and
LonghornSnapshotOverheadalert first made the fix verifiable. Without them, "is it working?" would have required manually re-querying the Prometheus expression browser after every trim run. - The label join pattern is reusable. Any time you need to correlate a Longhorn volume metric with a PVC-level metric, the
label_replace(kube_persistentvolumeclaim_info, "volume", "$1", "volumename", "(.*)")bridge is how you do it. kubectl labelon Longhorn volumes looks right but doesn't stick. For any setting that's reconciled by the Longhorn controller, the UI is more reliable than a label command. The controller resets the label immediately; the actual state lives in the volume spec and is visible in the controller logs.- The alerting picture isn't complete yet.
LonghornSnapshotOverheadat 15% was useful for visualizing the problem and confirming the fix. But working through this made it clear thatlonghorn_volume_actual_size_bytes / longhorn_volume_capacity_bytesisn't the right signal for "something is about to break" —longhorn_volume_actual_size_bytescan exceed the nominal PVC size entirely, and the real ceiling is node disk space. The correct alert hierarchy needslonghorn_disk_usage_bytes,longhorn_disk_reservation_bytes, andlonghorn_disk_capacity_bytes. That's a follow-up post.
What's Next
The fix is in place and working. The backup table shows SIZE trending down — 38.7 GiB → 30.1 → 26.3 → 23.3 GiB across full backup cycles — as the old bloated chain is progressively replaced by clean snapshots built on top of a properly trimmed volume head. The NEWLY-UPLOADED values (~250 MB per 4-hour cycle) suggest the eventual settled state should be around 2 GiB, well under any reasonable threshold.
But "eventual" is doing some work there. The trend is still in progress, and the honest answer to "what does normal look like for this volume?" is: I don't know yet. There's a last-resort option — delete all snapshots and let the backup job rebuild from scratch — that would answer that question in one cycle. Whether that's worth the disruption to the backup chain is a separate decision.
The more important open question is the alerting picture. Working through this investigation made clear that longhorn_volume_actual_size_bytes / longhorn_volume_capacity_bytes isn't the right metric for preventing things from breaking. That work — building a correct alert around disk-level pressure using longhorn_disk_usage_bytes, longhorn_disk_reservation_bytes, and longhorn_disk_capacity_bytes — is next.
Immediate:
- Monitor SIZE over the next few days to see where it settles
- Decide whether to trigger the nuclear option (delete all snapshots, rebuild from scratch) to establish a clean baseline
Follow-up:
- Build correct disk-level alerting using Longhorn disk metrics
- Revisit
LonghornSnapshotOverheadthreshold once settled state is known - Export the Longhorn Grafana dashboard to JSON and commit to
apps/monitoring/grafana/dashboards/— currently only in Grafana, not in the repo
← Previous: Enabling fstrim on Longhorn Volumes in Talos Linux
Questions or suggestions? Leave a comment below or reach out at igor@vluwte.nl.