Metrics Server on Talos: The Reboot That Broke Garage
Empty Longhorn panels led to metrics-server, a Talos cert quirk, a reboot that broke Garage, and 16 silent hours of failed backups.
Introduction
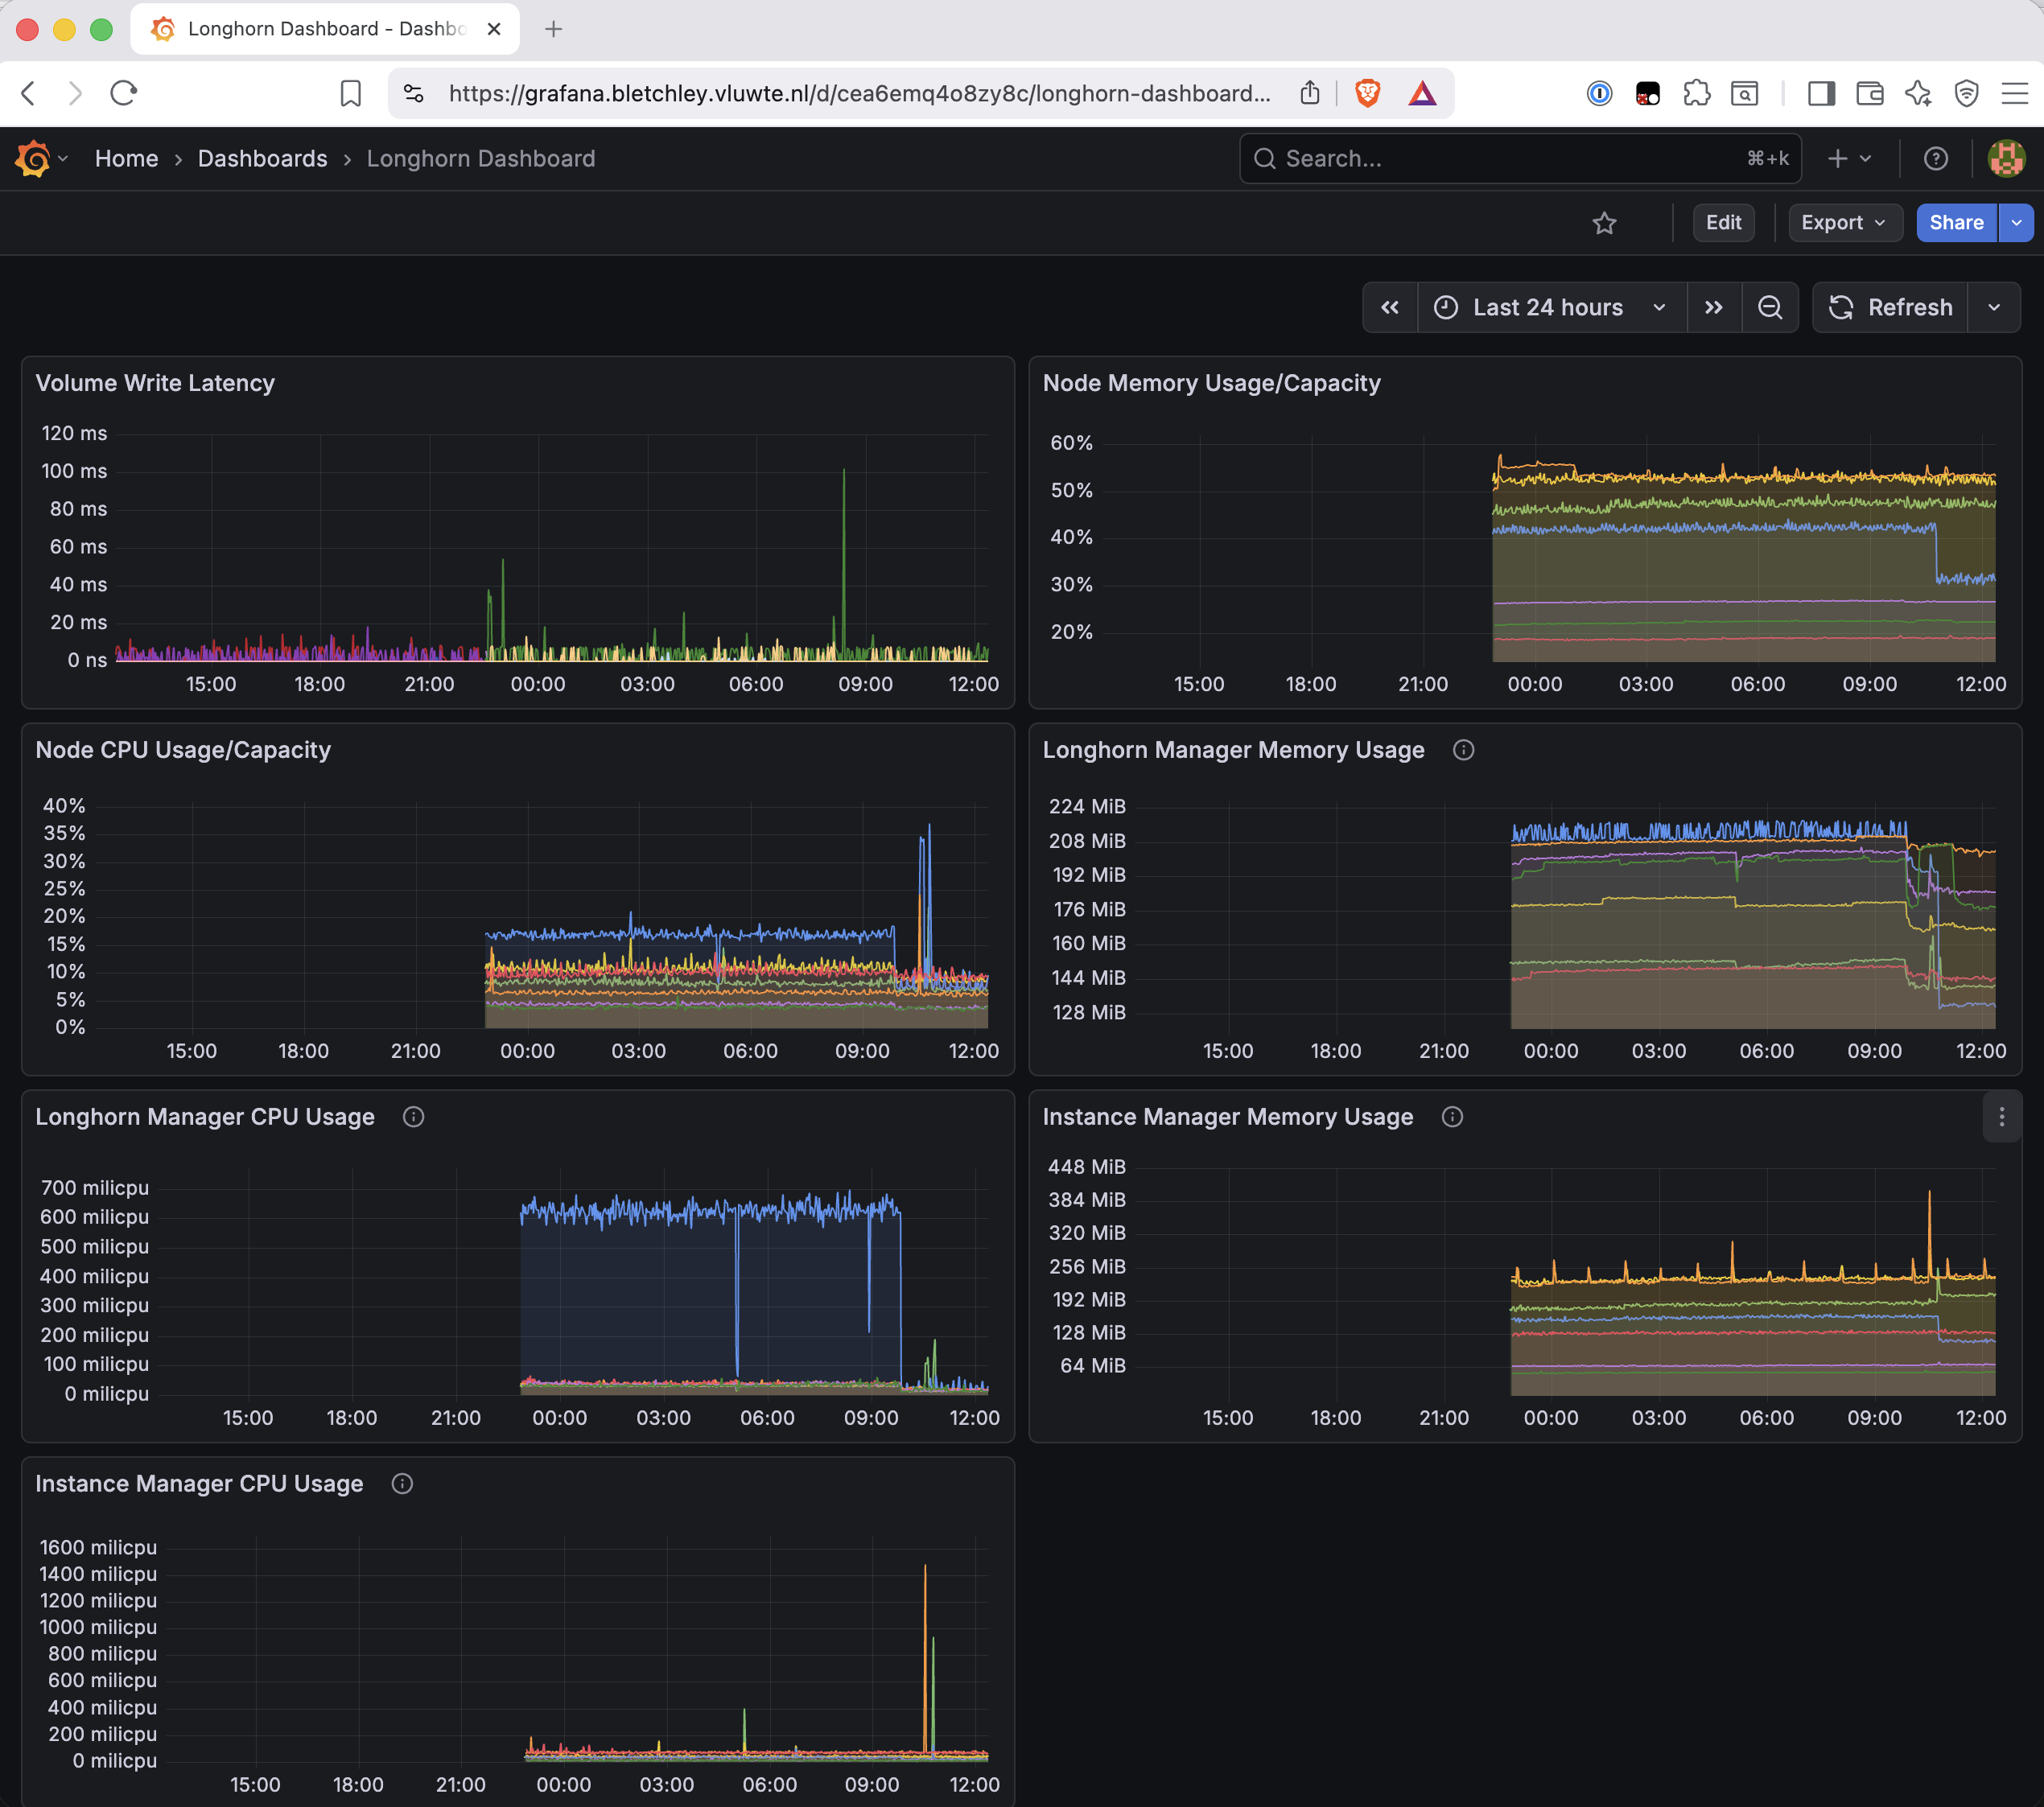
It started with empty panels on the Longhorn Grafana dashboard — the Node CPU/Memory Usage, Longhorn Manager CPU/Memory Usage, and Instance Manager CPU/Memory Usage panels all showing nothing. While working through the Longhorn disk-level alerting setup, these panels were the one piece that wouldn't cooperate. Tracing why led me to a missing metrics-server on the cluster — the Kubernetes metrics API was simply absent, so anything depending on runtime CPU and memory data had nothing to scrape.
The fix itself wasn't complicated once I understood the Talos-specific wrinkle: kubelet serving certificates on Talos lack IP SANs by default, which metrics-server rejects. Getting past that turned out to require one commented-out line in the generated config rather than anything structural. But the path to that discovery involved a full 7-node rolling reboot that didn't actually solve the stated problem — and did break something else entirely.
By the time I was done, I'd fixed the dashboard panels, broken Garage, recovered Garage, and discovered that Longhorn's entire backup pipeline had been silently failing for 16 hours. None of that last part was visible until the next morning.
🏠 This is part of the Homelab Journey series - building a production Kubernetes cluster from scratch.
- Longhorn Snapshot Overhead
- Metrics Server on Talos: The Reboot That Broke Garage (you are here)
The Problem: Missing Metrics API
The Longhorn dashboard panels for Node CPU/Memory and Manager CPU/Memory weren't broken in any Longhorn-specific way — they rely on longhorn_node_cpu_usage_millicpu and related runtime metrics that come from the Kubernetes metrics API. The capacity and request metrics (which come from Longhorn's own exporters) were present; only the runtime ones were missing.
A quick check confirmed the problem:
kubectl top nodes
error: Metrics API not available
No metrics-server, no metrics API, no data. The fix was to install one — but on Talos, there's a prerequisite worth knowing about first.
Installing metrics-server on Talos
Standard metrics-server deployment talks to the Kubernetes metrics API by scraping each kubelet over HTTPS at port 10250. On a typical cluster this works because kubelet serving certificates include the node's IP as a Subject Alternative Name. On Talos, they don't — the kubelets use self-signed certificates without IP SANs, and metrics-server rejects them outright.
The Talos documentation recommends solving this properly rather than with --kubelet-insecure-tls: deploy a kubelet-serving-cert-approver controller alongside metrics-server, enable kubelet serving certificate rotation (serverTLSBootstrap: true) in the kubelet config, and let the kubelets request valid cluster-signed serving certificates automatically. The cert-approver watches for these CSRs and approves them without manual intervention.
Installing both:
kubectl apply -f https://raw.githubusercontent.com/alex1989hu/kubelet-serving-cert-approver/main/deploy/standalone-install.yaml
kubectl apply -f https://github.com/kubernetes-sigs/metrics-server/releases/latest/download/components.yaml
Both deployed cleanly — namespace, RBAC, the APIService aggregation registration, all of it. The kubelet-serving-cert-approver pod came up healthy and connected to the API server. So far, nothing to note.
The problem appeared as soon as metrics-server tried to scrape:
E0613 20:12:27.589096 1 scraper.go:149] "Failed to scrape node" err="Get
  \"https://10.0.140.15:10250/metrics/resource\": tls: failed to verify
  certificate: x509: cannot validate certificate for 10.0.140.15 because
  it doesn't contain any IP SANs" node="rock5"
Same error for all 7 nodes. The cert-approver was running fine and had nothing to do — no CSRs to approve, because the kubelets weren't requesting serving certificates at all:
kubectl get csr
No resources found
The Dead End: A Reboot That Didn't Fix It
My first hypothesis was that the kubelets needed a restart to request new certificates. Reasonable enough — talosctl reboot is a clean, graceful, Talos-managed process (cordons, drains, waits for the node to return), so I ran a rolling reboot of all 7 nodes one at a time:
talosctl reboot -n 10.0.140.11  # rock1
kubectl wait --for=condition=Ready node/rock1 --timeout=300s
# ... repeated for rock2 through rock7
After all 7 reboots, CSRs appeared — but not the right kind:
NAME        AGE   SIGNERNAME                                    REQUESTOR
csr-vczmq   17m   kubernetes.io/kube-apiserver-client-kubelet   system:bootstrap:ec7948   Approved,Issued
csr-xt4gd   13m   kubernetes.io/kube-apiserver-client-kubelet   system:bootstrap:ec7948   Approved,Issued
These are kube-apiserver-client-kubelet CSRs — client authentication certificates for the kubelet connecting to the API server. Not the kubernetes.io/kubelet-serving certificates that metrics-server needs, and only 2 of 7 nodes generated even those. The scrape errors continued unchanged.
The reboot hadn't helped because kubelet serving certificate rotation (serverTLSBootstrap) wasn't enabled. The kubelets had nothing telling them to request serving certificates, so a restart just brought them back up behaving identically. More on what this reboot actually did cause in a moment.
The Real Fix: One Commented-Out Line
Checking the generated Talos machine configs:
grep serverTLSBootstrap controlplane.yaml worker.yaml
controlplane.yaml:        #     serverTLSBootstrap: true
worker.yaml:        #     serverTLSBootstrap: true
There it was — present in both generated configs, commented out, and never applied to the running cluster. It also wasn't in any of the patch files under infra/talos/, so it would have been silently absent from any config regeneration too.
Creating the patch file and applying it to all 7 nodes:
infra/talos/kubelet-serving-cert-bootstrap.patch.yaml:
machine:
  kubelet:
    extraConfig:
      serverTLSBootstrap: true
for node in rock1 rock2 rock3 rock4 rock5 rock6 rock7; do
  talosctl patch mc -n $node --patch @infra/talos/kubelet-serving-cert-bootstrap.patch.yaml
done
Each node responded with Applied configuration without a reboot — consistent with how the registry mirror patch had behaved previously, and exactly what was needed given what the earlier reboot had already stirred up.
The kubelets picked up the config change and started requesting serving certificates. The cert-approver handled them automatically. Within minutes, metrics-server stopped complaining and kubectl top nodes returned data for all 7 nodes:
NAME    CPU(cores)   CPU(%)   MEMORY(bytes)   MEMORY(%)
rock1   650m         8%       3328Mi          45%
rock2   884m         11%      3763Mi          51%
rock3   1258m        15%      3082Mi          42%
rock4   532m         6%       3746Mi          50%
rock5   720m         9%       2874Mi          18%
rock6   380m         4%       1940Mi          26%
rock7   286m         3%       1600Mi          21%
The Longhorn dashboard panels populated that same evening, around 22:50. The 24-hour screenshot above was taken the following afternoon — all six panels showing a full continuous history from the fix forward.
The lesson I'd take from the reboot dead end: check the kubelet config before reaching for a node restart. The fix was a one-liner that didn't require any reboot at all. The reboot was a plausible-but-wrong diagnostic move, and it had consequences.
The Other Shoe: Garage After the Reboot
The next morning, investigating why the Longhorn backup panel was showing gaps, I found this in the Garage logs:
garage-0 garage 2026-06-14T07:47:11.824745Z  INFO garage_api_common::generic_server:
  error 403 Forbidden, Forbidden: No such key: GK06d52ff18acbf5614c074c88 in
  response to GET /longhorn-backups?...
403s on a key that absolutely exists. Checking Garage's status:
kubectl exec -n garage garage-0 -- /garage status
kubectl exec -n garage garage-0 -- /garage key list
==== HEALTHY NODES ====
ID                Hostname  Address            Tags  Zone       Capacity   DataAvail
5eb63f49d4e27dae  garage-0  10.244.0.159:3901  []    bletchley  465.7 GiB  17.5 GiB (65.1%)

ID  Created  Name  Expiration
(empty — no keys listed)
Garage's node ID had reverted to 5eb63f49d4e27dae — a previous identity, not the stable 6963934821f79894 that's been recorded in the cluster state notes since April. No keys, no buckets visible. The DataAvail figure of 17.5 GiB at 65.1% capacity was another sign something was wrong — under the correct identity the actual free space is around 474 GiB.
This is Garage's documented node-ID instability on pod restart, which I'd encountered in April and written up then. Garage's node ID is derived from the node_key on disk; on pod restart it can come up as a different identity and show NO ROLE ASSIGNED with empty keys and buckets visible. The critical thing the documentation says: do not run layout assign or layout apply in this state — just restart the pod.
kubectl rollout restart statefulset/garage -n garage
After the restart:
kubectl exec -n garage garage-0 -- /garage status
==== HEALTHY NODES ====
ID                Hostname  Address  Tags  Zone       Capacity   DataAvail
6963934821f79894  garage-0  N/A      []    bletchley  465.7 GiB  474.2 GiB (94.8%)
kubectl exec -n garage garage-0 -- /garage key list
ID                          Created     Name             Expiration
GK06d52ff18acbf5614c074c88  2026-03-08  longhorn-key     never
GK2b0a066525ce37bfec0e8bee  2026-03-09  synology-key     never
GK7cee2ab95a1e21d90e80dbab  2026-03-16  forgejo-backup   never
GK7787bd30cd867d4d0aeccdd1  2026-04-30  postgres-backup  never
Fully recovered — correct node ID, all 4 keys and 4 buckets back, 474 GiB data available. The LMDB metadata was safe on disk throughout; only the pod's view of its own identity had been wrong.
The earlier rolling reboot had triggered this. Rock3 hosts the Garage StatefulSet pod, and rebooting rock3 caused the pod to restart, which triggered the identity instability. The risk had been noted going in — Garage's sensitivity to pod restarts is documented — but the expectation was that graceful node reboots wouldn't be enough to trigger it. That expectation was wrong.
The Quiet Casualty: 16 Hours of Failed Backups
Recovering Garage revealed a secondary problem that had been running silently the entire time. Checking the backup-controller logs:
backup-authelia-authelia-29690190-xxx6r backup-controller time="2026-06-14T04:30:06Z"
  level=error msg="Failed to run volume job" ... error="failed to complete
  backupAndCleanup for pvc-f70b6bb3: Bad response statusCode [500]. ...
  message=failed to backup snapshot: admission webhook
  \"validator.longhorn.io\" denied the request: backup target default
  is not available" executionCount=377
While Garage was showing NO ROLE ASSIGNED, Longhorn's default backup target — which points at Garage — had become unavailable. The admission webhook rejected every backup snapshot request. 377 logged failures for just the Authelia job. Every recurring backup job on the cluster had been failing for the entire duration of the Garage incident.
The backup table for prometheus-server shows the gap clearly:
NAME                      CREATED                MODE          SIZE
backup-512c2e6cb122474c   2026-06-13T16:30:19Z   incremental   16986931200   Completed
backup-14a51ff3884f48bb   2026-06-14T08:31:42Z   incremental    7348420608   Completed
Last successful backup at 16:30 on June 13. Next successful at 08:31 on June 14. Roughly 16 hours with no Longhorn backups completing anywhere on the cluster — and no alert fired. Nothing told me this was happening. I found it only because I was already looking at backup logs for an unrelated reason.
The Garage rollout restart also restored the default backup target automatically. The 08:31 June 14 backup completed normally, and the recurring jobs resumed from there.
The Forgejo backup job had also been failing during this window — same root cause, same fix. A manual test run confirmed recovery:
kubectl create job -n forgejo --from=cronjob/forgejo-backup forgejo-backup-test
forgejo-dump 2026/06/14 11:33:50 Finished dumping in file /dump/forgejo-dump-20260614-113350.zip
upload: ../dump/forgejo-dump-20260614-113350.zip to s3://forgejo-backup/dumps/...
Clean. One scheduled backup cycle was missed; the cronjob resumed normally.
There's an incidental footnote worth mentioning: the 16-hour backup gap caused the prometheus-server volume SIZE to drop from 16.99 GiB to 7.35 GiB in the 08:31 backup — a much larger drop than any previous incremental. This happened because no snapshots were created during the outage, so the 08:31 backup captured the full snapshot delta, including a lot of TSDB compaction that had accumulated. It incidentally gave me the clean snapshot overhead baseline that the Longhorn disk-alerting work needed — the settled LonghornSnapshotOverhead ratio is roughly 16.5% of capacity, comfortably under the 50% alert threshold. An accidental data point from an incident I'd rather have avoided, but a useful one.
What's Working Now
- ✅
metrics-serverrunning and scraping all 7 nodes - ✅
kubelet-serving-cert-approverauto-approvingkubelet-servingCSRs - ✅
serverTLSBootstrap: trueenabled cluster-wide viainfra/talos/kubelet-serving-cert-bootstrap.patch.yaml - ✅ Longhorn dashboard panels fully populated
- ✅ Garage recovered — node ID
6963934821f79894, all 4 keys and 4 buckets intact - ✅ Longhorn backups resumed normally
- ✅ Forgejo backup confirmed working
What's Next
The monitoring gaps this incident exposed are the obvious follow-up. A 16-hour cluster-wide backup outage with zero alerting is not acceptable as a steady state.
The three failure modes that went undetected — Garage node ID instability, OpenBao seal status, and Longhorn backup target availability — are all going into the alert backlog. Exactly when they land depends on sequencing with the Longhorn disk-alerting work, which picks up from where this post leaves off. That post covers the alerting side of the empty-panel investigation that started this whole chain.
← Previous: Longhorn Snapshot Overhead
Questions or suggestions? Leave a comment below or reach out at igor@vluwte.nl.