The Wear That Wasn't
An NVMe alert at 82% used life, on drives with full spare capacity and zero errors. The wear number turned out to be a clock, not an odometer.
Introduction
The alert said rock1's NVMe was at 82% used life. A second drive was at 81%, both climbing around 0.7 percentage points a day, which put them at 100% in about four weeks. The Alert That Named a Pod was about getting that alert to name a machine. This one is about whether the number it carries was worth acting on.
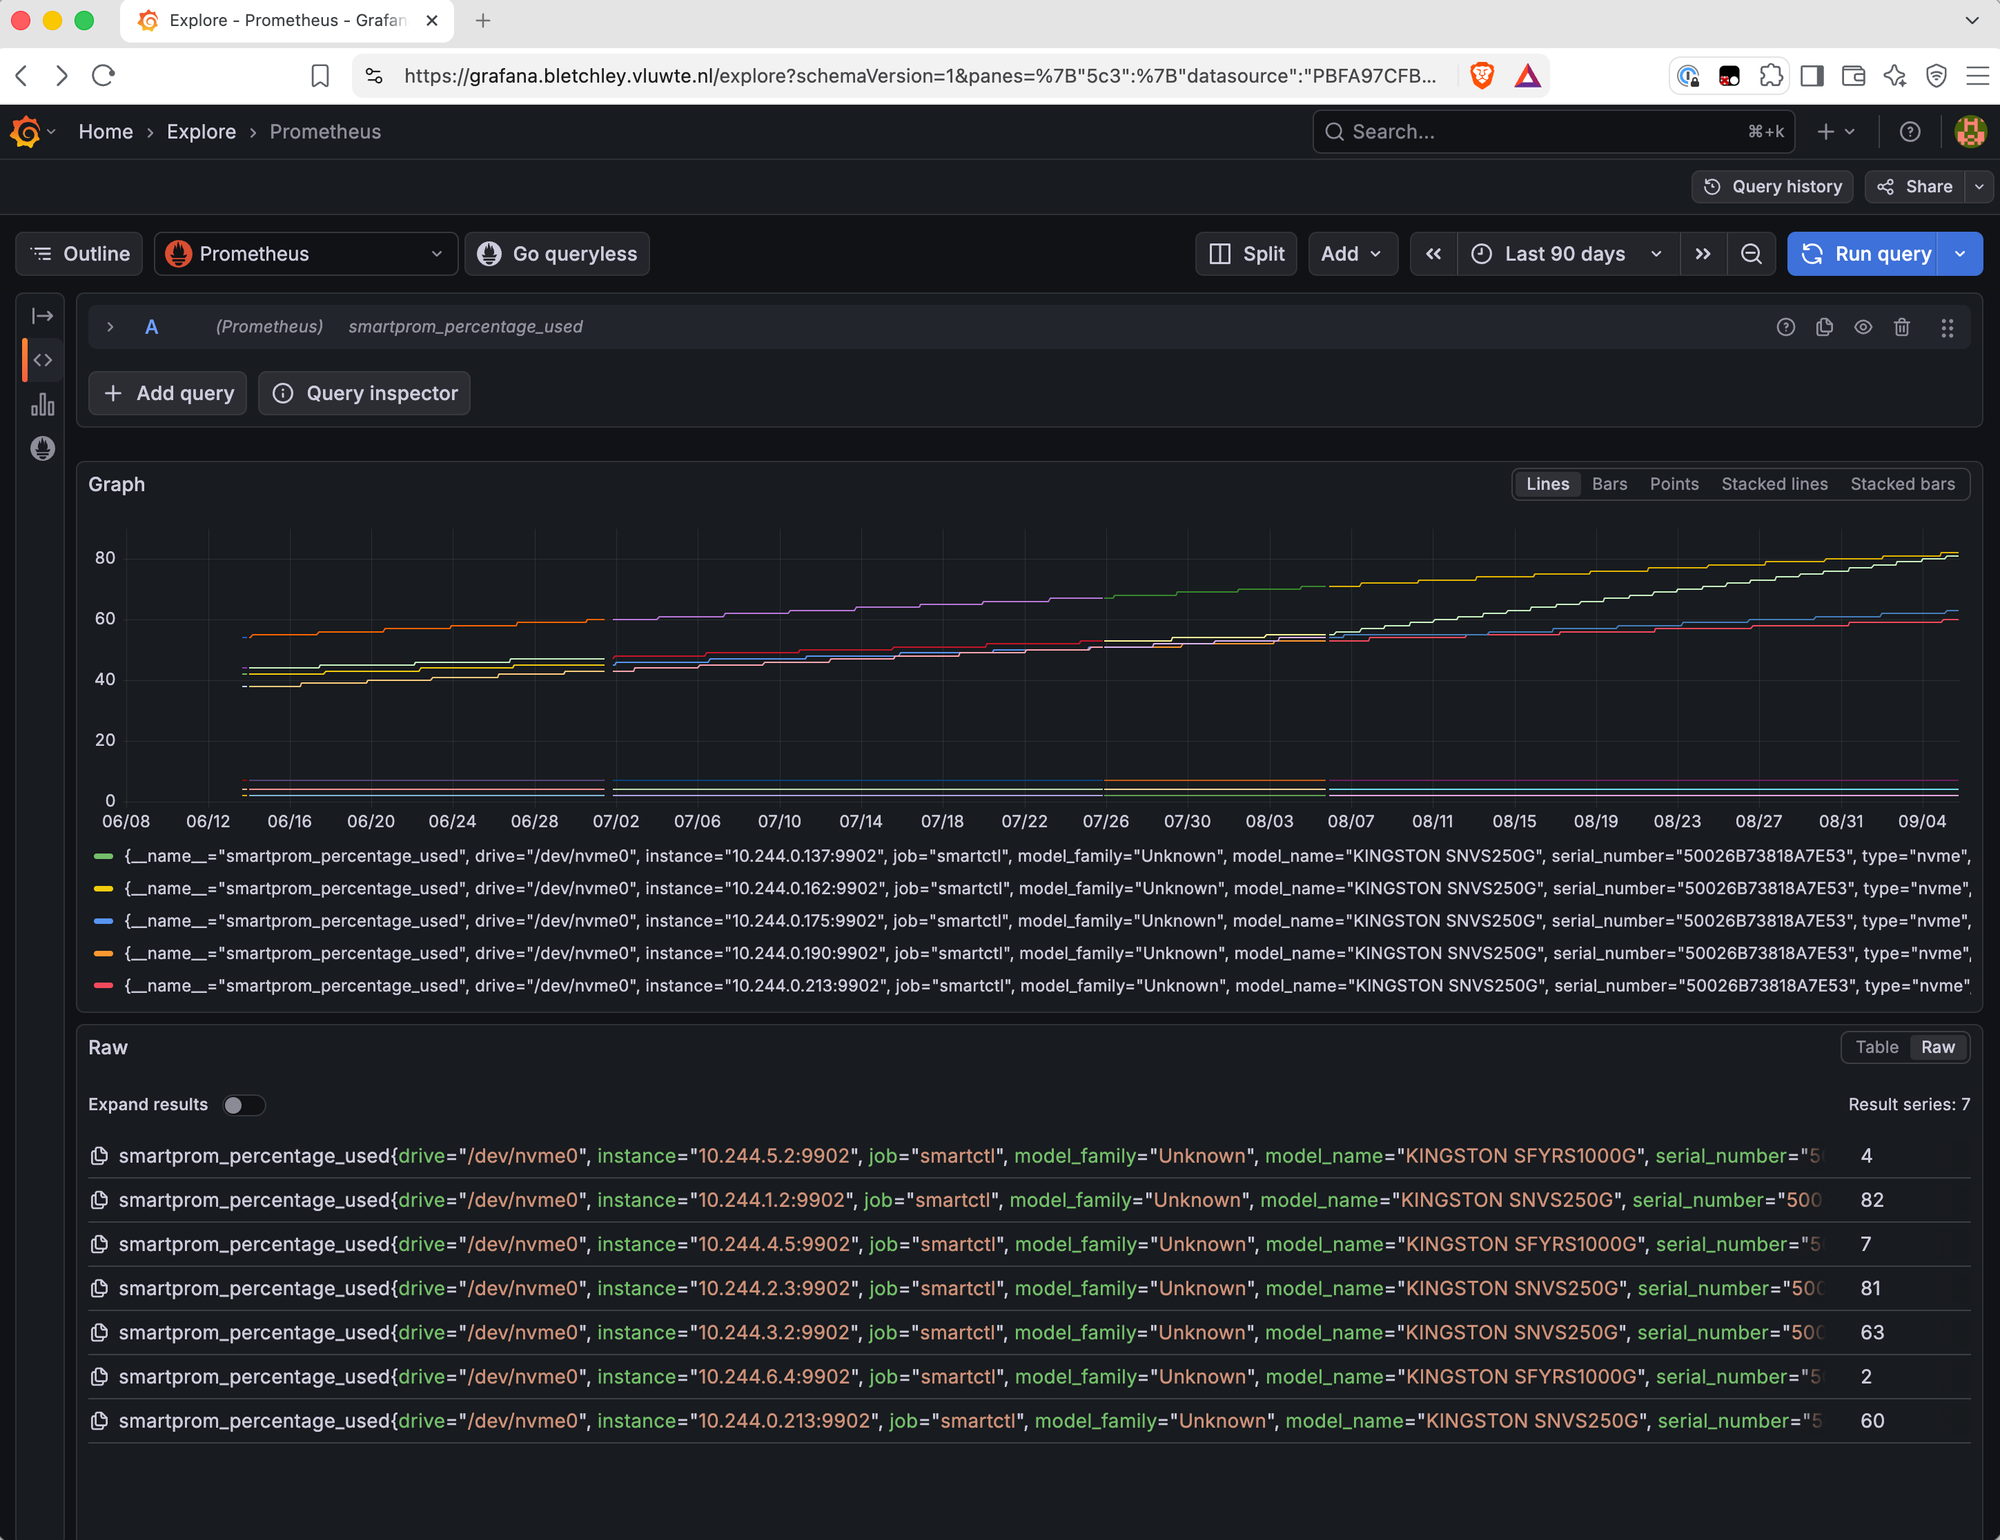
I assumed it was, and that something in the cluster was writing far too much. Finding out what would mean tracing writes from the drive up through the node, the volume and the namespace, so before starting any of that I dumped SMART from all seven nodes into one table to see where the wear actually sat.
That table ended the investigation in about the time it took to read it. Wear on these drives does not track writes at all. It tracks time, at a rate fixed by the drive's firmware revision, and the two drives the alert was worried about are in perfect health.
🔬 This is part of the Technical Deep Dives series - technical concepts explained in depth, independent of the homelab journey.
- The Alert That Named a Pod
- The Wear That Wasn't (you are here)
Seven drives in one table
Talos has no SSH and no shell, so smartctl exists in exactly one place on this cluster: inside the exporter container. Ground truth means exec into the DaemonSet pod on each node.
for p in $(kubectl -n monitoring get pods -o name | grep smartctl); do
  n=$(kubectl -n monitoring get "$p" -o jsonpath='{.spec.nodeName}')
  kubectl -n monitoring exec "$p" -- smartctl -a -j /dev/nvme0 > "smart-${n}.json"
done
Seven JSON files, one jq pass, one table. The only trap is the units: data_units_written counts NVMe data units, and one unit is 1,000 blocks of 512 bytes, so multiply by 512,000 to get bytes.
| Node | Board | Model | % used | POH | Rated | TB written | GB/day (30d) | Spare | Media errors |
|---|---|---|---|---|---|---|---|---|---|
| rock1 | 1 | NV1 250 GB | 82 | 5697 | 60 TBW | 1.15 | 6.97 | 100% | 0 |
| rock2 | 1 | NV1 250 GB | 81 | 5658 | 60 TBW | 1.61 | 0.005 | 100% | 0 |
| rock3 | 1 | NV1 250 GB | 60 | 5633 | 60 TBW | 0.99 | 7.79 | 100% | 0 |
| rock4 | 1 | NV1 250 GB | 63 | 5614 | 60 TBW | 1.23 | 7.70 | 100% | 0 |
| rock5 | 2 | FURY Renegade 1 TB | 7 | 18438 | 1000 TBW | 38.87 | 1.65 | 100% | 0 |
| rock6 | 2 | FURY Renegade 1 TB | 4 | 10636 | 1000 TBW | 24.41 | 5.31 | 100% | 0 |
| rock7 | 2 | FURY Renegade 1 TB | 2 | 7540 | 1000 TBW | 7.26 | 7.93 | 100% | 0 |
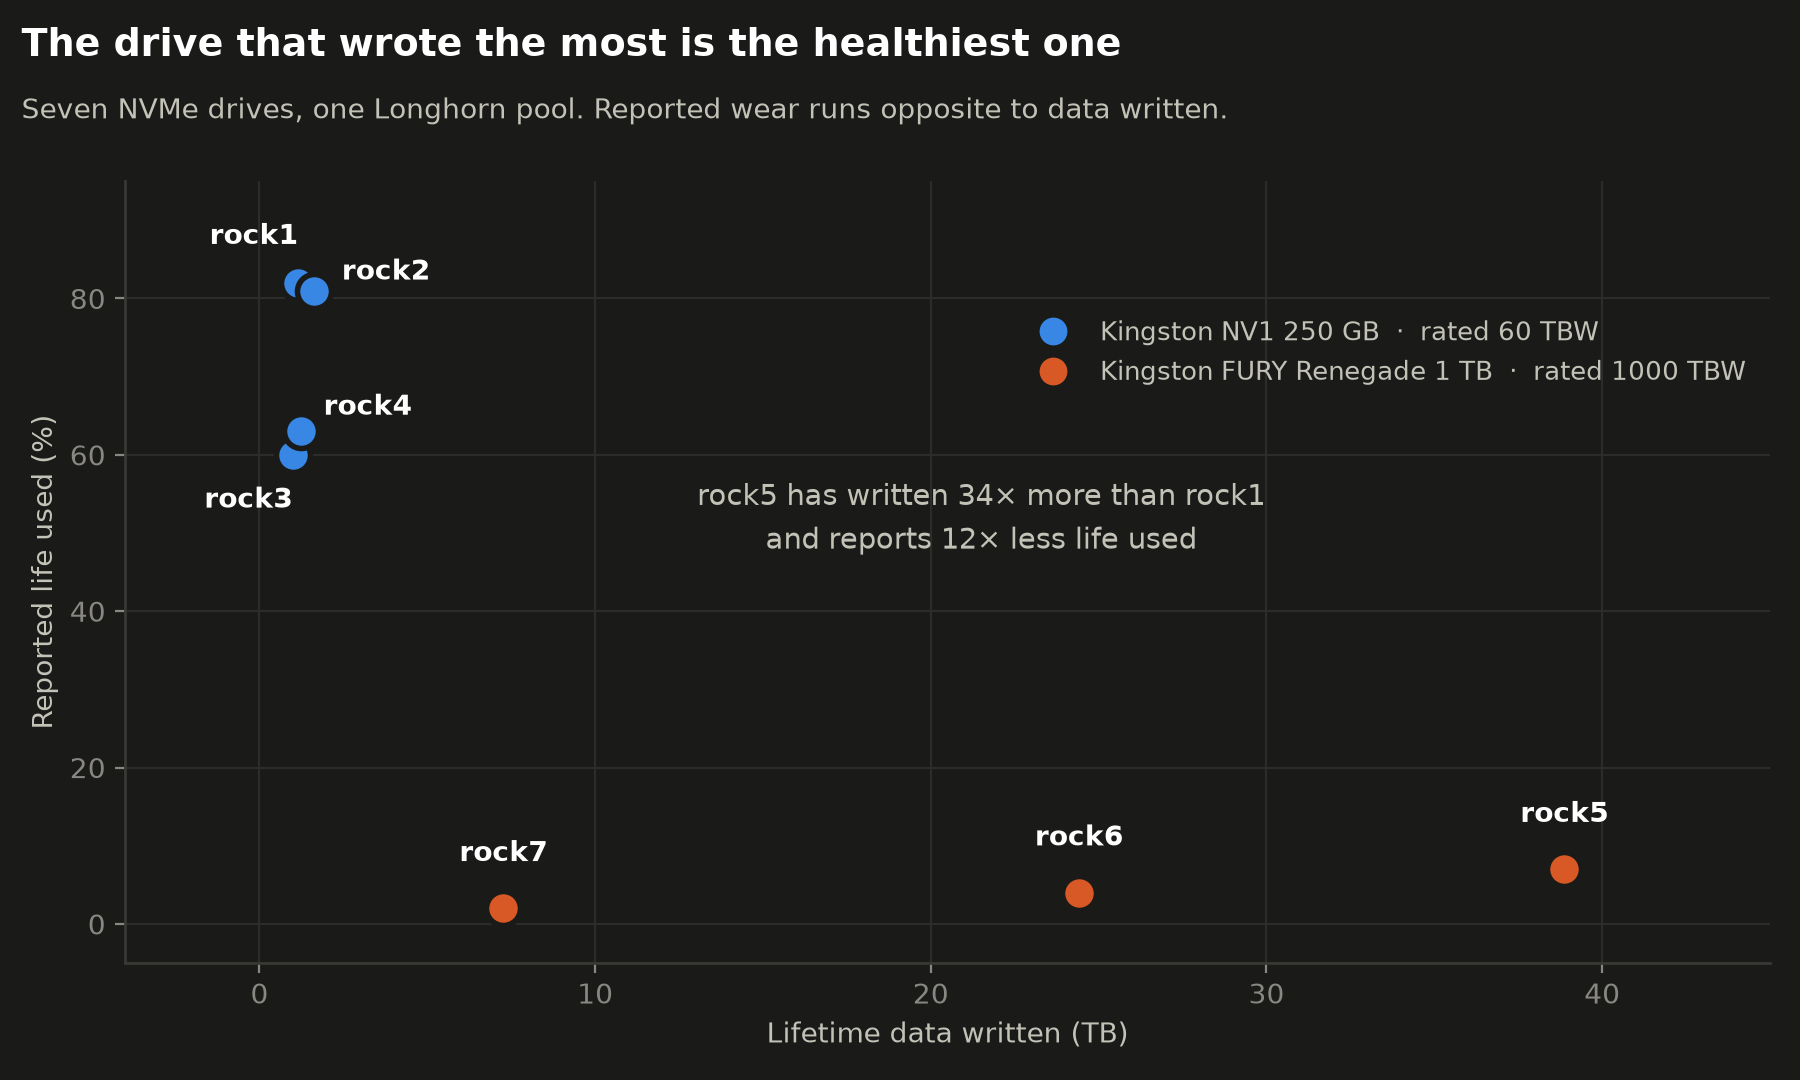
Read the last row against the first. Over the past thirty days rock7 wrote 7.93 GB a day and rock1 wrote 6.97. rock7 reports 2% used. rock1 reports 82%. Same cluster, same window, same mix of workloads, and the drive doing slightly more work is the one that is barely touched.
It is also not two drives. All four on the first board sit between 60% and 82%, all three on the second between 2% and 7%, and the 80% threshold simply caught the two furthest along. The boards do run different hardware, budget 60 TBW drives against 1 PB ones, which would explain the healthy board wearing more slowly. It does not explain wear running backwards against the work done.
The number tracks time
If wear is not following writes, the obvious thing to try next is the other axis every drive reports. Divide percentage_used by power on hours and the noise disappears.
| Firmware | Nodes | %/POH-day | % used | Writes differ by |
|---|---|---|---|---|
| S8H40103 | rock1, rock2 | 0.3454, 0.3436 | 82, 81 | +40% |
| S8J41100 | rock3, rock4 | 0.2556, 0.2693 | 60, 63 | +24% |
| (FURY) | rock5, rock6 | 0.0091, 0.0090 | 7, 4 | +59% |
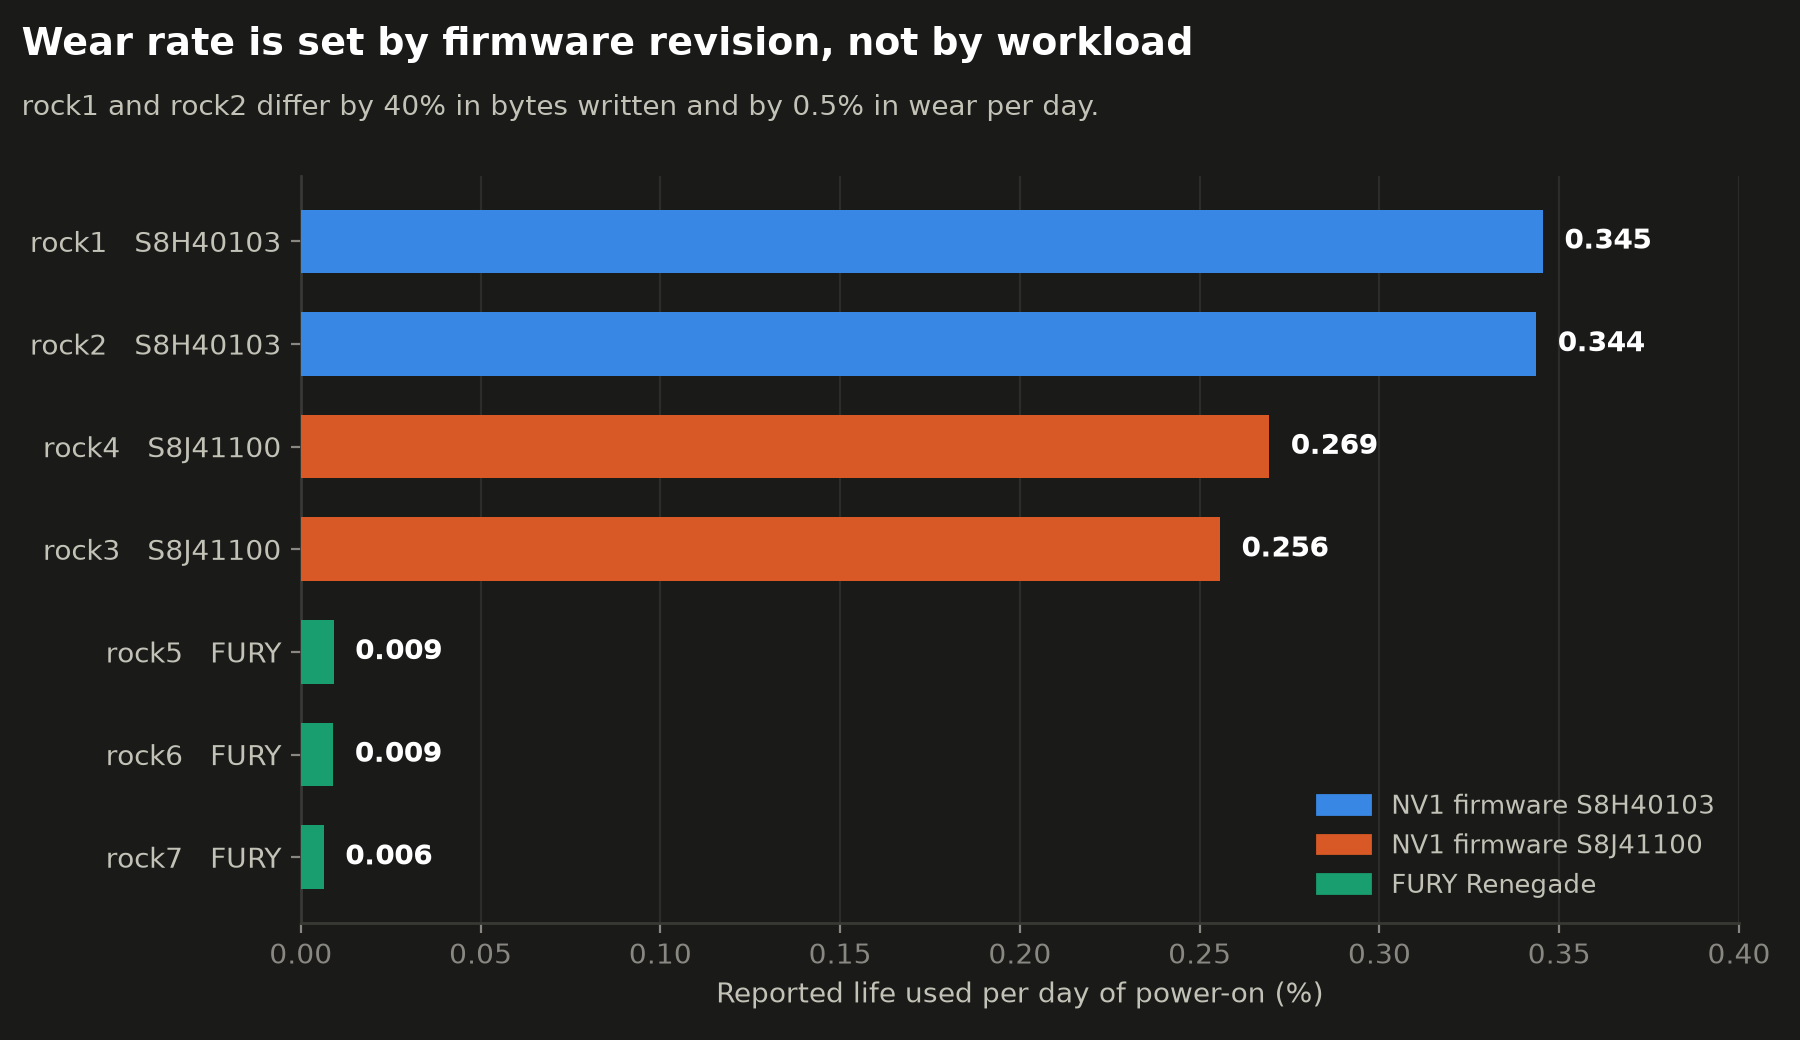
Take the first row slowly. rock1 and rock2 differ by 40% in bytes written and by half a percent in wear per day.
Three pairs, three times the same result. Substantially different write volumes inside each pair, near identical wear per unit of time. The pairs are not arbitrary either: each shares a firmware revision, and the two NV1 revisions run at two different constants, 31% apart.
smart-rock1.json  S8H40103  50026B76852581A8
smart-rock2.json  S8H40103  50026B76852581A0
smart-rock3.json  S8J41100  50026B73818A7E53
smart-rock4.json  S8J41100  50026B73818A7CB5
Same model, same cluster, same workload, same 235 day power on window, two rates. Kingston shipped the NV1 with different controllers and NAND across production runs, so two batches with two different estimators is exactly what you would expect if the estimator is the thing being measured.
percentage_used on these drives is a clock, not an odometer. It counts down at a rate the firmware chose, and the cluster's workload barely enters into it. rock1 reaches 100% at around 290 days of power on time, having taken 4.9 full drive writes in its entire life.
The drive already knew
There is a second, simpler argument sitting in the same SMART page, and I had been reading past it for months.
A drive genuinely 82% through its program and erase budget has started retiring blocks. That is what the reserve pool exists for, and available_spare reports how much of it is left. On rock1 that counter reads 100%. media_errors is zero. critical_warning is clear.
So the drive is telling me two incompatible things at once: four fifths of my endurance is gone, and not one block has been retired. Those cannot both describe the same piece of hardware. One is a count of things that happened. The other is a guess.
Nothing worth fixing
I had written down six theories before measuring anything, specifically so they could be killed rather than quietly revised. All six died against the table.
| Theory | Verdict |
|---|---|
| Longhorn replica pairing puts two hot replicas on two drives | Four drives are affected, split along a hardware boundary. Two replicas cannot do that. |
| The drives were not new when installed | Power on hours 5614 to 5697, consistent to 1.5%, so first power on was mid January 2026. |
| Prometheus and Loki are writing too much | The whole board writes 4 to 7 GB a day per node. They could account for every byte and it would not reach 82%. |
| etcd on the control plane nodes | rock3 is control plane and the least worn of the four. rock4 is a worker and more worn. |
| No TRIM, so extreme write amplification | discard_max_bytes is 2 TiB, longhorn-trim has run daily for 91 days, and the drives are 2 to 13% full. |
| Rebuild storms | Lifetime writes of 0.99 to 1.61 TB leave no room for them. |
Fill level does not merely fail to explain it, it runs backwards: rock1 is the emptiest drive in the cluster at 4.1% used and the most worn at 82%.
Which leaves the question of what happens when the counter does reach 100%. Nothing happens. The drive does not stop. percentage_used crossing 100 ends the warranty, and Kingston's terms for the NV1 are three years or 100% used life, whichever comes first.
Except that these drives were bought in 2022 and sat on a shelf until they went into Bletchley in January 2026. The warranty expired in 2025. The number I was watching race towards a deadline had already missed a different one, and there is no claim left to lose.
The one drive that breaks the model
Six of the seven fit the clock. rock2 does not, and it is the reason this post has a sequel rather than a conclusion.
rock2 shares firmware S8H40103 with rock1, so it should run at rock1's rate. Instead it ran at about 0.2 points a day for eleven weeks and then jumped to 0.833 on 6 August, the day a short circuit took the whole cluster down. That is also the day its writes fell from 12 GB a day to roughly 50 MB and stayed there. More wear, from a drive that had almost stopped working.
Firmware sets a baseline, then, and something state dependent modulates it. What that something is needs three checks I have not run yet, so it gets its own post rather than a paragraph of speculation here.
What I watch instead
percentage_used stays on the dashboard as a panel and comes off the alerting path, because alerting on it means being paged by a manufacturer's countdown timer.
The metrics that describe real degradation were sitting there unused. Every drive in the cluster reports 100% available_spare, which means not one block has ever been retired. The single most informative event available to me is the drop from 100 to 99, and the rule I had, comparing spare against the drive's own threshold, only fires at 10%. It would miss that first drop by ninety percentage points.
And the odometer I thought I already had is one expression away:
# NV1 250 GB, rated 60 TBW: currently around 2%
(smartprom_data_units_written * 512000) / (60 * 1e12) * 100
Two percent. That is the number I believed I was looking at when the alert said 82.
One caveat, and it is the only one in this post. percentage_used is a perfectly good metric on plenty of SSDs. What is shown here is that it is firmware driven and time linear on NV1 revisions S8H40103 and S8J41100. Distrust it per model, having checked, not as a rule.
Conclusion
Four drives, about EUR 120 in 2022, eight months carrying a production Longhorn pool, zero media errors and full spare capacity on every one. At 5 to 8 GB a day this cluster needs more than twenty years to write the 60 TB these drives are rated for. Sixty terabytes of DRAM-less budget NAND was still the wrong part to buy for a Longhorn node, and I would not buy it again, but nothing here was failing and nothing needed tuning.
The most useful habit this reinforced is cheap to apply: when a metric contradicts its neighbours, believe the neighbours. Eighty two percent consumed sat next to 100% spare and zero media errors on the same page, and only one of those is a count of things that actually happened.
What's Next
The NVMe in these nodes carries Longhorn and nothing else, which means etcd, containerd's image store, kubelet state and every log line live somewhere else entirely. That device takes two to three times the writes, has no SMART support at all, and has never been monitored. That is the next post.
← Previous: The Traefik Dashboard That Routed to Itself
Questions or suggestions? Leave a comment below or reach out at igor@vluwte.nl.