The Traefik Dashboard That Routed to Itself
A dashboard broken since March turned out to be a memory amplifier. One visit took Traefik to 4 GB and hung a node.
There has been an entry near the bottom of my cluster todo list since March: Traefik dashboard is a routing loop. It sat there for six months with the word "cosmetic" next to it in my head, if not in the file. The dashboard is a nice-to-have. Everything it shows me I can also get from kubectl. Nine other ingress hosts worked fine, so whatever was wrong with the tenth could wait.
On the evening of 11 September I finally sat down to fix it. Two hours later rock6 was NotReady, Longhorn's UI and my git server were down, and I was power cycling a compute module from the TuringPi BMC with nothing on the console to tell me why.
The dashboard was not cosmetic. A request to that URL made Traefik forward the request to itself, roughly a hundred times a second, holding every hop open. One visit took a single Traefik pod from tens of megabytes to about four gigabytes on an eight gigabyte node. The second visit, which I triggered myself with a diagnostic loop, coincided with every writing process on that node stopping at once.
This post is the whole evening: the probe, the crash, the power toggle, the forensics that named the consumer, and the rebuild. It also covers something I found only because I deleted the broken thing, which is that the Traefik dashboard and its API had been served on plain HTTP with no authentication for months.
🏠 This is part of the Homelab Journey series - building a production Kubernetes cluster from scratch.
- CloudNativePG Part 8
- The Traefik Dashboard That Routed to Itself (you are here)
This post assumes a working Traefik and MetalLB setup of the kind described in Cluster Networking: MetalLB and Traefik, with Authelia in front of the protected services.
The symptom, six months old
The report was the same one I had written down twice before:
https://traefik.bletchley.vluwte.nl/
gives:
This site can't be reached
traefik.bletchley.vluwte.nl took too long to respond.

igor@granite ~ % host traefik.bletchley.vluwte.nl
traefik.bletchley.vluwte.nl has address 10.0.140.100
DNS was right. The address was the MetalLB LoadBalancer IP that every other host also resolves to. So the first thing worth knowing was whether this was a Traefik problem or a dashboard problem, and the cheapest way to find out is to ask all ten hosts the same question:
for h in traefik.bletchley.vluwte.nl grafana.bletchley.vluwte.nl longhorn.bletchley.vluwte.nl \
         auth.bletchley.vluwte.nl prometheus.bletchley.vluwte.nl alertmanager.bletchley.vluwte.nl \
         s3.bletchley.vluwte.nl git.vluwte.nl it-tools.vluwte.nl accounts.vluwte.nl; do
  printf '%-36s ' "$h"
  curl -s -o /dev/null -m 10 -w '%{http_code}  connect=%{time_connect}s  tls=%{time_appconnect}s  total=%{time_total}s\n' "https://$h/"
done
traefik.bletchley.vluwte.nl          000  connect=0.016290s  tls=0.035394s  total=10.006717s
grafana.bletchley.vluwte.nl          302  connect=0.011359s  tls=0.027682s  total=0.037153s
longhorn.bletchley.vluwte.nl         302  connect=0.010939s  tls=0.026688s  total=0.040999s
auth.bletchley.vluwte.nl             200  connect=0.011031s  tls=0.023151s  total=0.030101s
prometheus.bletchley.vluwte.nl       302  connect=0.009839s  tls=0.025827s  total=0.041124s
alertmanager.bletchley.vluwte.nl     302  connect=0.010546s  tls=0.023004s  total=0.039709s
s3.bletchley.vluwte.nl               403  connect=0.011888s  tls=0.031470s  total=0.037995s
git.vluwte.nl                        200  connect=0.011624s  tls=0.022648s  total=0.087105s
it-tools.vluwte.nl                   200  connect=0.010568s  tls=0.023064s  total=0.032063s
accounts.vluwte.nl                   200  connect=0.011514s  tls=0.024368s  total=0.030479s
That one line of output is the whole picture. TCP connects in 16 ms and the TLS handshake completes in 35 ms, so MetalLB is announcing, Traefik is listening, and the certificate is being served. Then nothing comes back for ten seconds. Traefik accepted the request and never answered it. Every other host answers in under 90 ms.
Remember that probe. It comes back later in this post wearing a different hat.
What the Ingress actually said
Two kubectl calls close the case on the mechanism:
kubectl -n traefik get ingress traefik-dashboard \
  -o jsonpath='{.spec.rules[*].http.paths[*].backend.service}{"\n"}'
{"name":"traefik","port":{"number":80}}
kubectl -n traefik get svc traefik \
  -o jsonpath='{range .spec.ports[*]}{.name} {.port} -> {.targetPort}{"\n"}{end}'
web 80 -> web
websecure 443 -> websecure
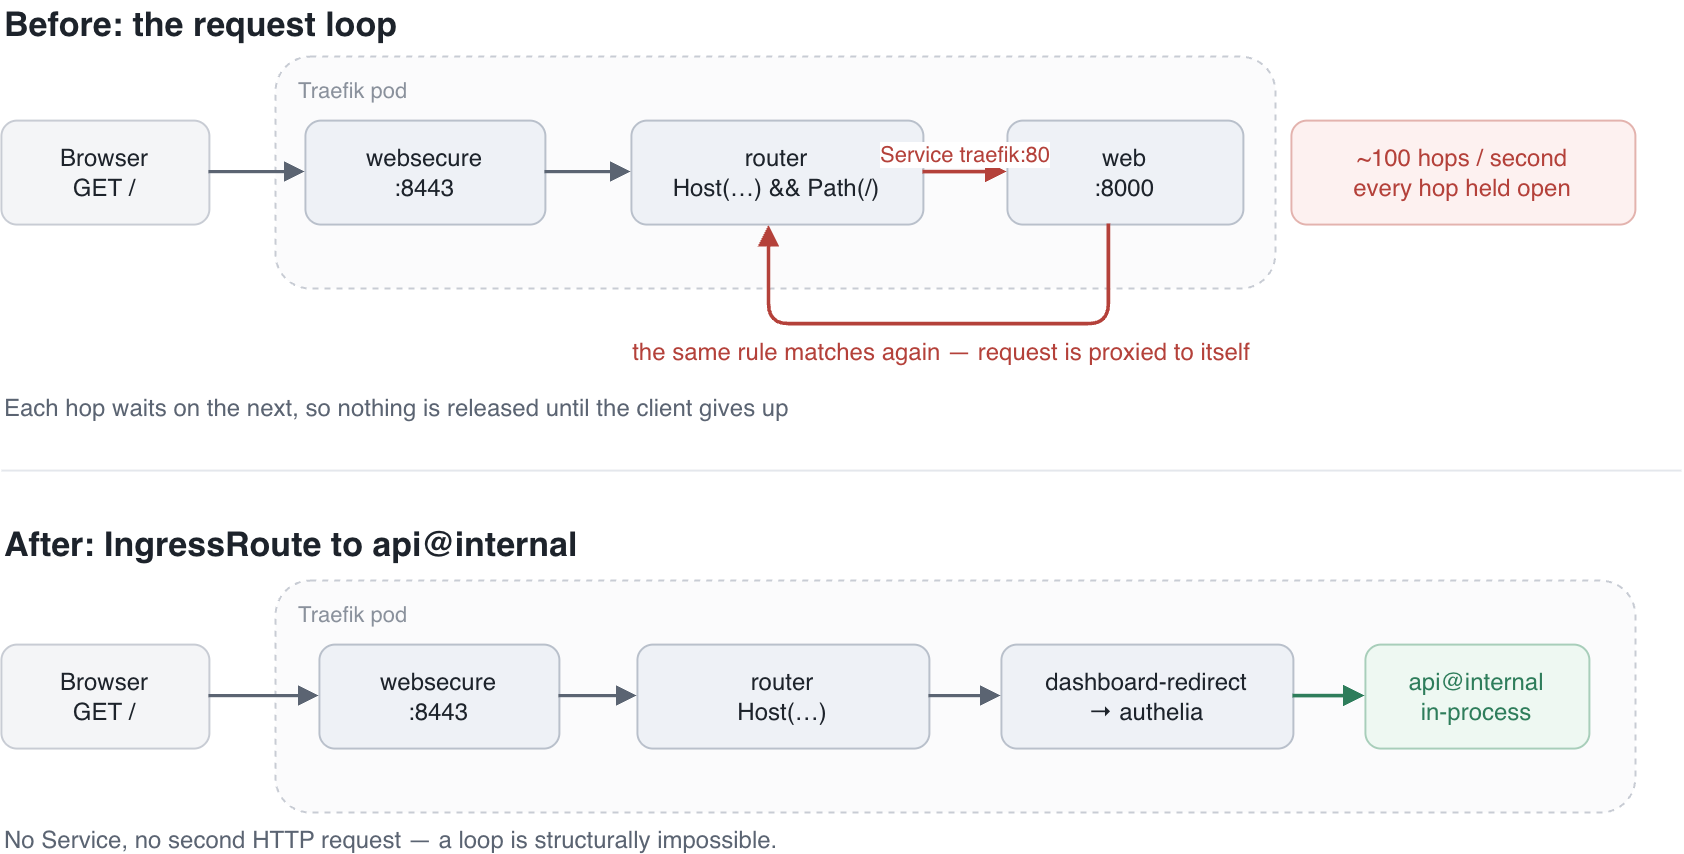
The Ingress for the dashboard has a backend of traefik:80. Service port 80 maps to the web entrypoint, which is Traefik's own container port 8000. So a browser request arrives on websecure, matches the router for Host(traefik.bletchley.vluwte.nl) && PathPrefix(/), and is proxied to the traefik Service on port 80. That lands on the web entrypoint of the same pod, where the same router matches it again, and it is proxied to the Service again.
Traefik is a reverse proxy pointed at itself. There is no backend anywhere in that path. The request never reaches anything that could answer it.
There was also a detail that no document in my project recorded. The namespace holds three dashboard IngressRoutes as well as the Ingress:
kubectl -n traefik get ingressroute -A
NAMESPACE   NAME                       AGE
traefik     traefik-dashboard          136d
traefik     traefik-dashboard-http     173d
traefik     traefik-dashboard-secure   173d
Three routes I had no notes on, two of them exactly as old as the Ingress. I made a note to look at them and carried on with what I thought was the real question, which was why I could not read Traefik's logs.
The investigation that took the node down
I wanted the access log, so I reached for stern:
failed to tail: Get "https://10.0.140.16:10250/containerLogs/traefik/traefik-66cb59d5d6-zf5ns/traefik?follow=true&sinceSeconds=172800×tamps=true": net/http: TLS handshake timeout, will retry
That URL is the API server calling rock6's kubelet, which is how logs, exec and port-forward are all proxied. The failure is on the cluster side, not on my Mac. A port-forward a minute later failed differently:
error: error upgrading connection: unable to upgrade connection: error dialing backend: dial tcp 10.0.140.16:10250: i/o timeout
Different layer. stern got a TCP connection and stalled during the handshake; this one could not complete the dial at all. Minutes later, with nothing changed, the same command worked and Traefik answered with its own 404 on the internal entrypoint. Failures that move between layers and come and go rule out the tidy explanations, an expired kubelet certificate or a firewall rule, because those fail the same way every time.
So I asked every kubelet the same question, which is the shape of diagnostic I should have reached for an hour earlier:
for n in rock1 rock2 rock3 rock4 rock5 rock6 rock7; do
  printf '%-6s ' "$n"
  kubectl get --raw "/api/v1/nodes/$n/proxy/healthz" --request-timeout=15s 2>&1 | head -1; echo
done
Six nodes answered ok. rock6 answered:
Unable to connect to the server: context deadline exceeded (Client.Timeout exceeded while awaiting headers)
Three times in a row. rock5 and rock7 sit on the same TuringPi board as rock6 and were both fine, so the board-to-board link was not the problem. One node was dying.
rock6 NotReady <none> 117d v1.36.2 10.0.140.16 <none> Talos (v1.13.7) 6.18.39-talos (arm64) containerd://2.2.6
Then the real consequences arrived. Longhorn's UI stopped answering, and so did git.vluwte.nl. Forgejo had been intermittently flaky earlier that day, which I had shrugged off at the time.
At the BMC, the picture was unhelpful in a specific way:
[root@bletchley2 ~]$ tpi power status
node1: On
node2: On
node3: On
node4: off
[root@bletchley2 ~]$ tpi uart -n 2 get
[root@bletchley2 ~]$
The slot reports powered on, which tells me the slot has power and nothing whatsoever about whether an operating system is alive on it. The UART returned nothing at all, and tpi uart get only returns what has been buffered since the last read, so an empty result is not evidence either way.
rock5, rock6 and rock7 sit in slots 1 to 3 of bletchley2 in that order, so slot 2 is rock6. I know that; it is my hardware. What I noticed while typing the command is that the mapping is not written down anywhere in the repo or in my cluster state document. It lives in my head, which is fine at 22:35 on a Friday and considerably less fine if someone else ever has to do this, or if I ever have to do it in a year on the board I touch least.
I toggled slot 2. At 22:40:03 rock6 booted. Longhorn's UI came back, git came back, and every Longhorn volume reported healthy. No taint, no force deleted pods, no manual volume detach. The node came back and the cluster sorted itself out.
The console had shown nothing during the whole event, including across a fresh boot. That is its own finding: during an incident, the TuringPi console currently tells me nothing about a Talos node, because Talos is not putting its console on the UART the BMC reads.
Reading the wreckage
A power cycle is a destructive diagnostic. Talos keeps dmesg in memory, so rock6's kernel ring buffer and its kubelet log from before the hang were gone the moment I toggled the slot. What survived was everything that had already left the node: Prometheus samples and Loki lines.
The first thing to establish was when, precisely. node_boot_time_seconds gave me 1789159203 for rock6, which is 22:40:03 CEST, three seconds after the toggle. rock5 still showed its 5 August boot and rock7 was untouched, so the power cycle hit exactly the module it was aimed at. rock6's metrics stopped at 22:12:30 and resumed at 22:41:30.
Loki was more interesting. The last log line of any kind from rock6 reached Loki at 22:07:36, five minutes before the metrics stopped. That silence is not the node having nothing to say: Traefik was serving requests throughout that window with its access log on, and Forgejo logs a health probe every few seconds. None of it arrived.
![Grafana Explore line graph of the LogQL query sum(count_over_time({pod="loki-canary-jbpbw"}[1m])) between 21:45 and 22:45. The line is flat at about 75 lines per minute until 22:07, falls to zero by 22:09, stays at zero for half an hour, spikes to about 260 just after 22:40, then settles at about 60.](https://vluwte.nl/content/images/2026/09/screenshot-grafana-rock6-loki-gap.png)
My first instinct was a storage stall on the eMMC, since container logs are files on that disk. Prometheus dismissed it in one look. A hung device holds I/O in flight and makes dirty pages pile up waiting to be flushed, and rock6 had neither. Both disks sat flat at zero requests in flight, and Dirty collapsed at 22:07:30 instead of climbing. The disks were not refusing to write. Everything that writes had stopped asking.
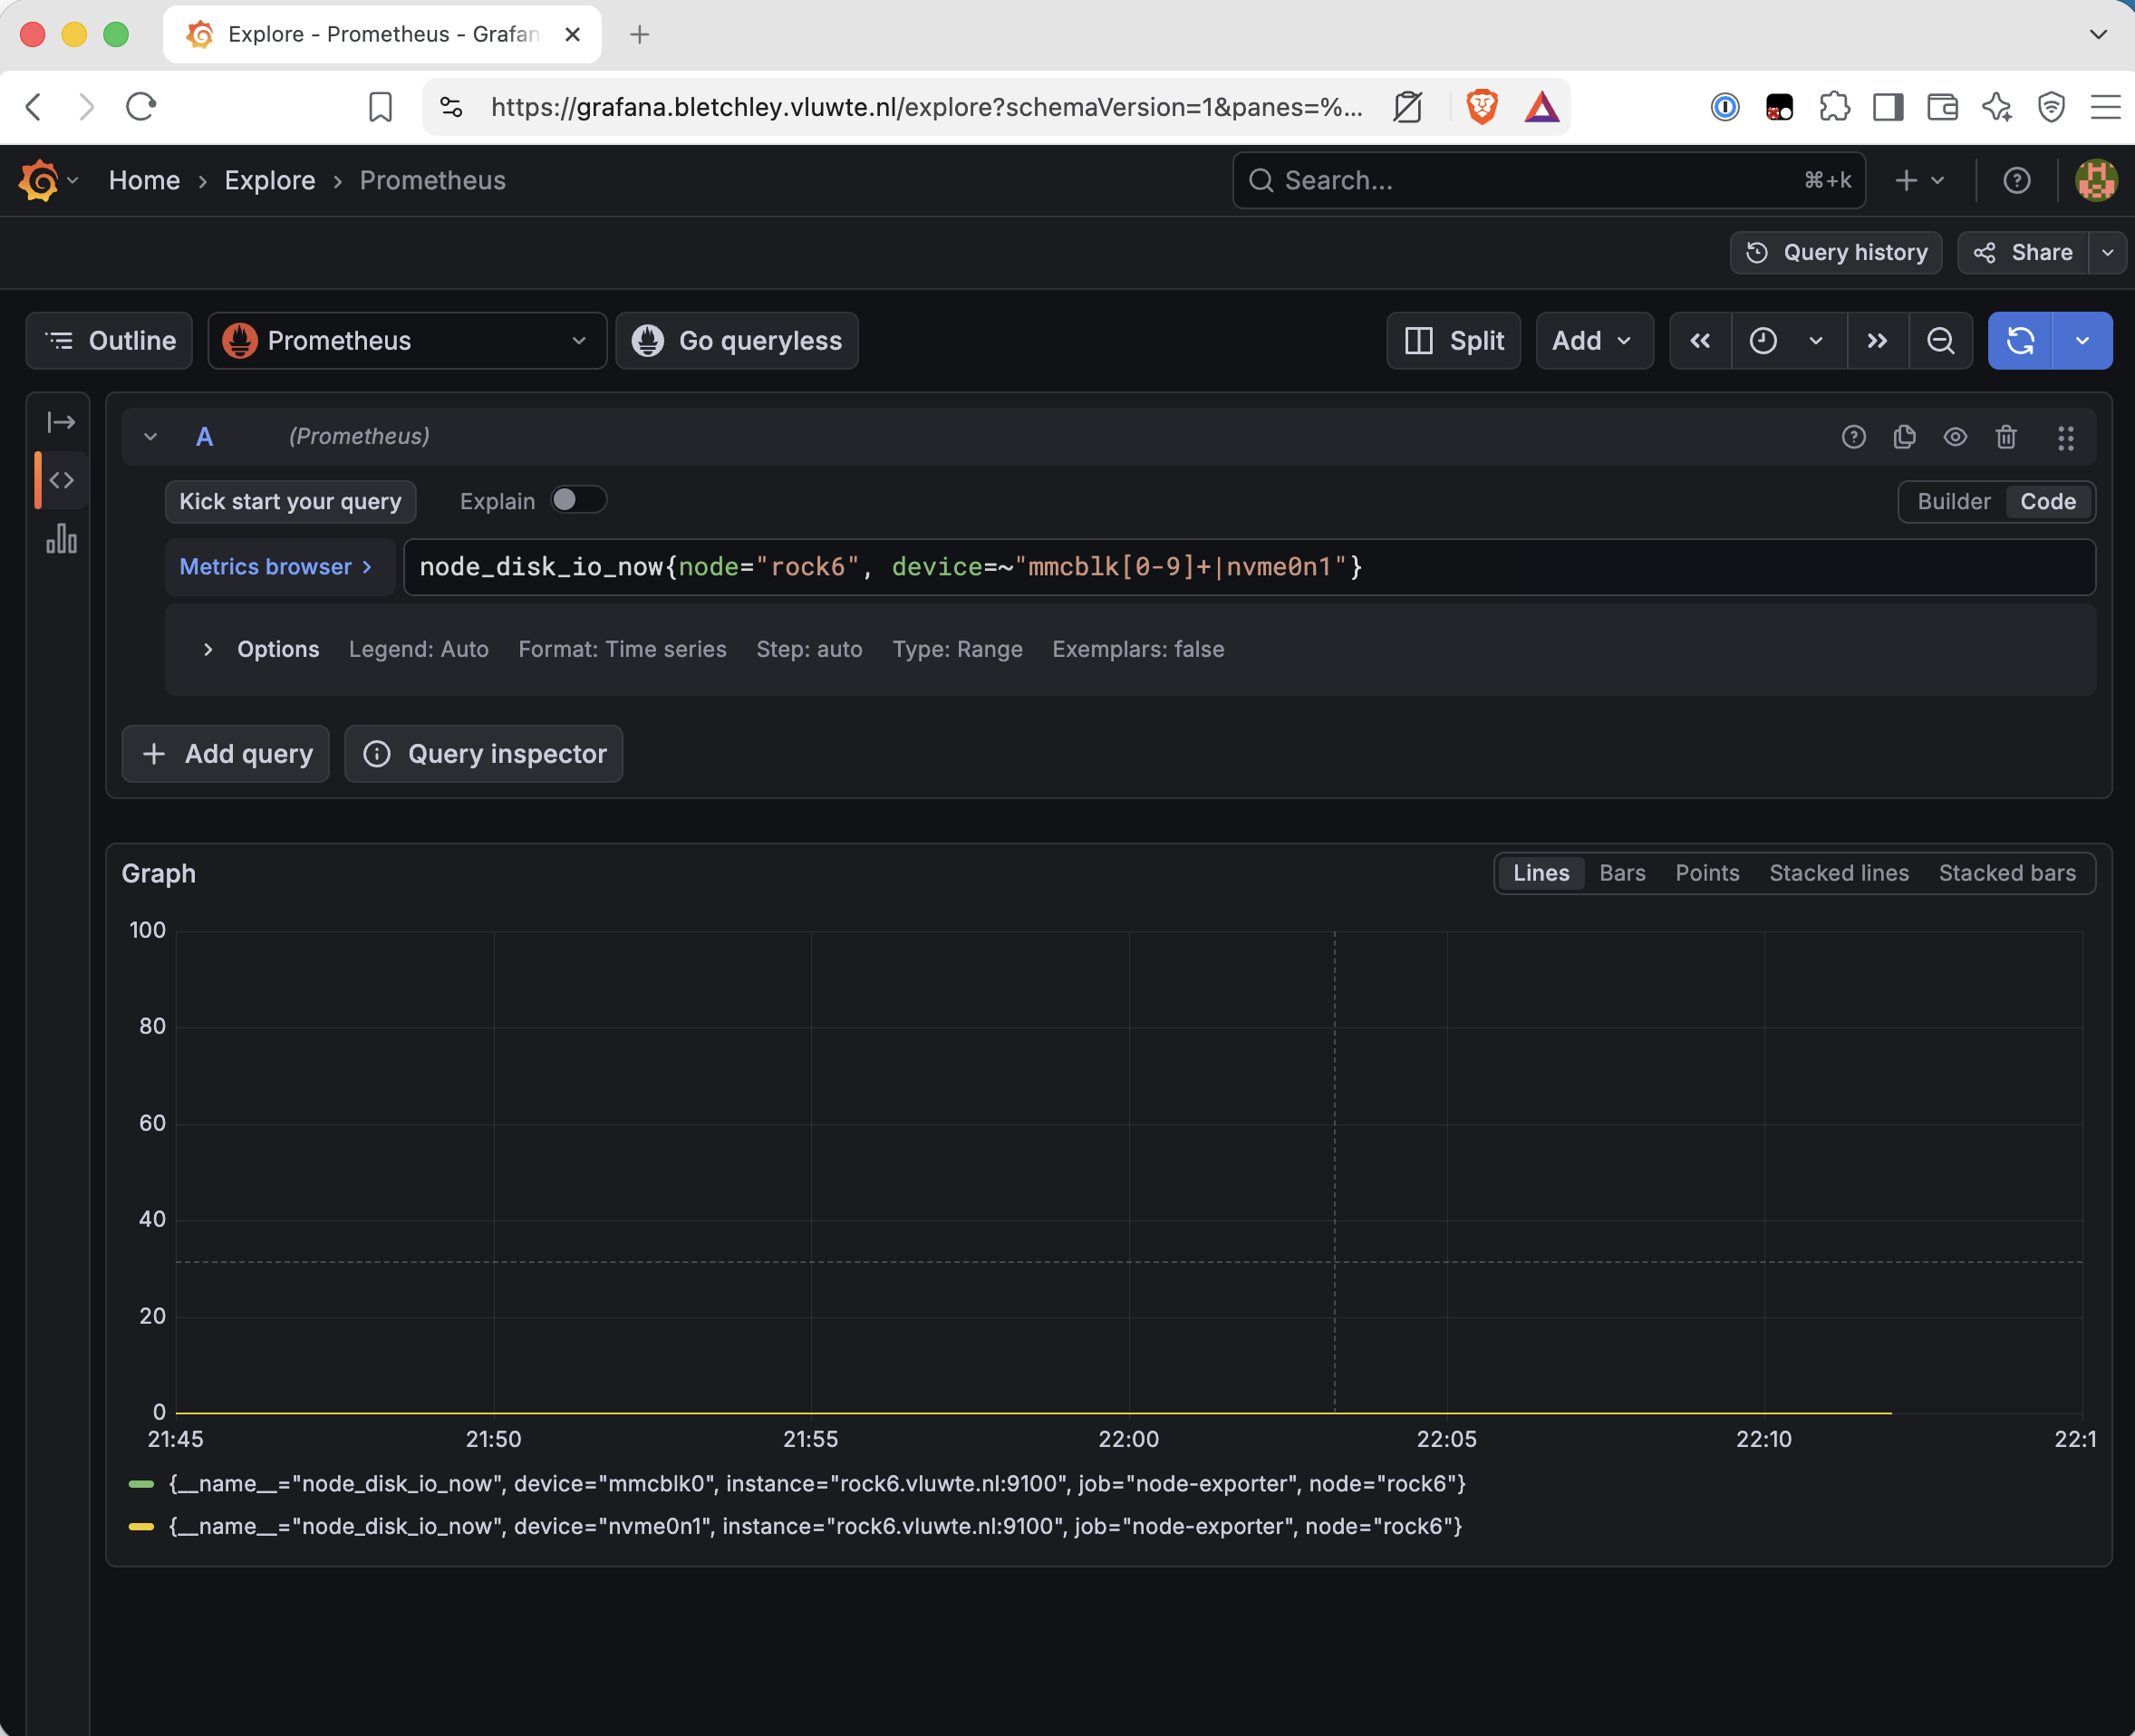
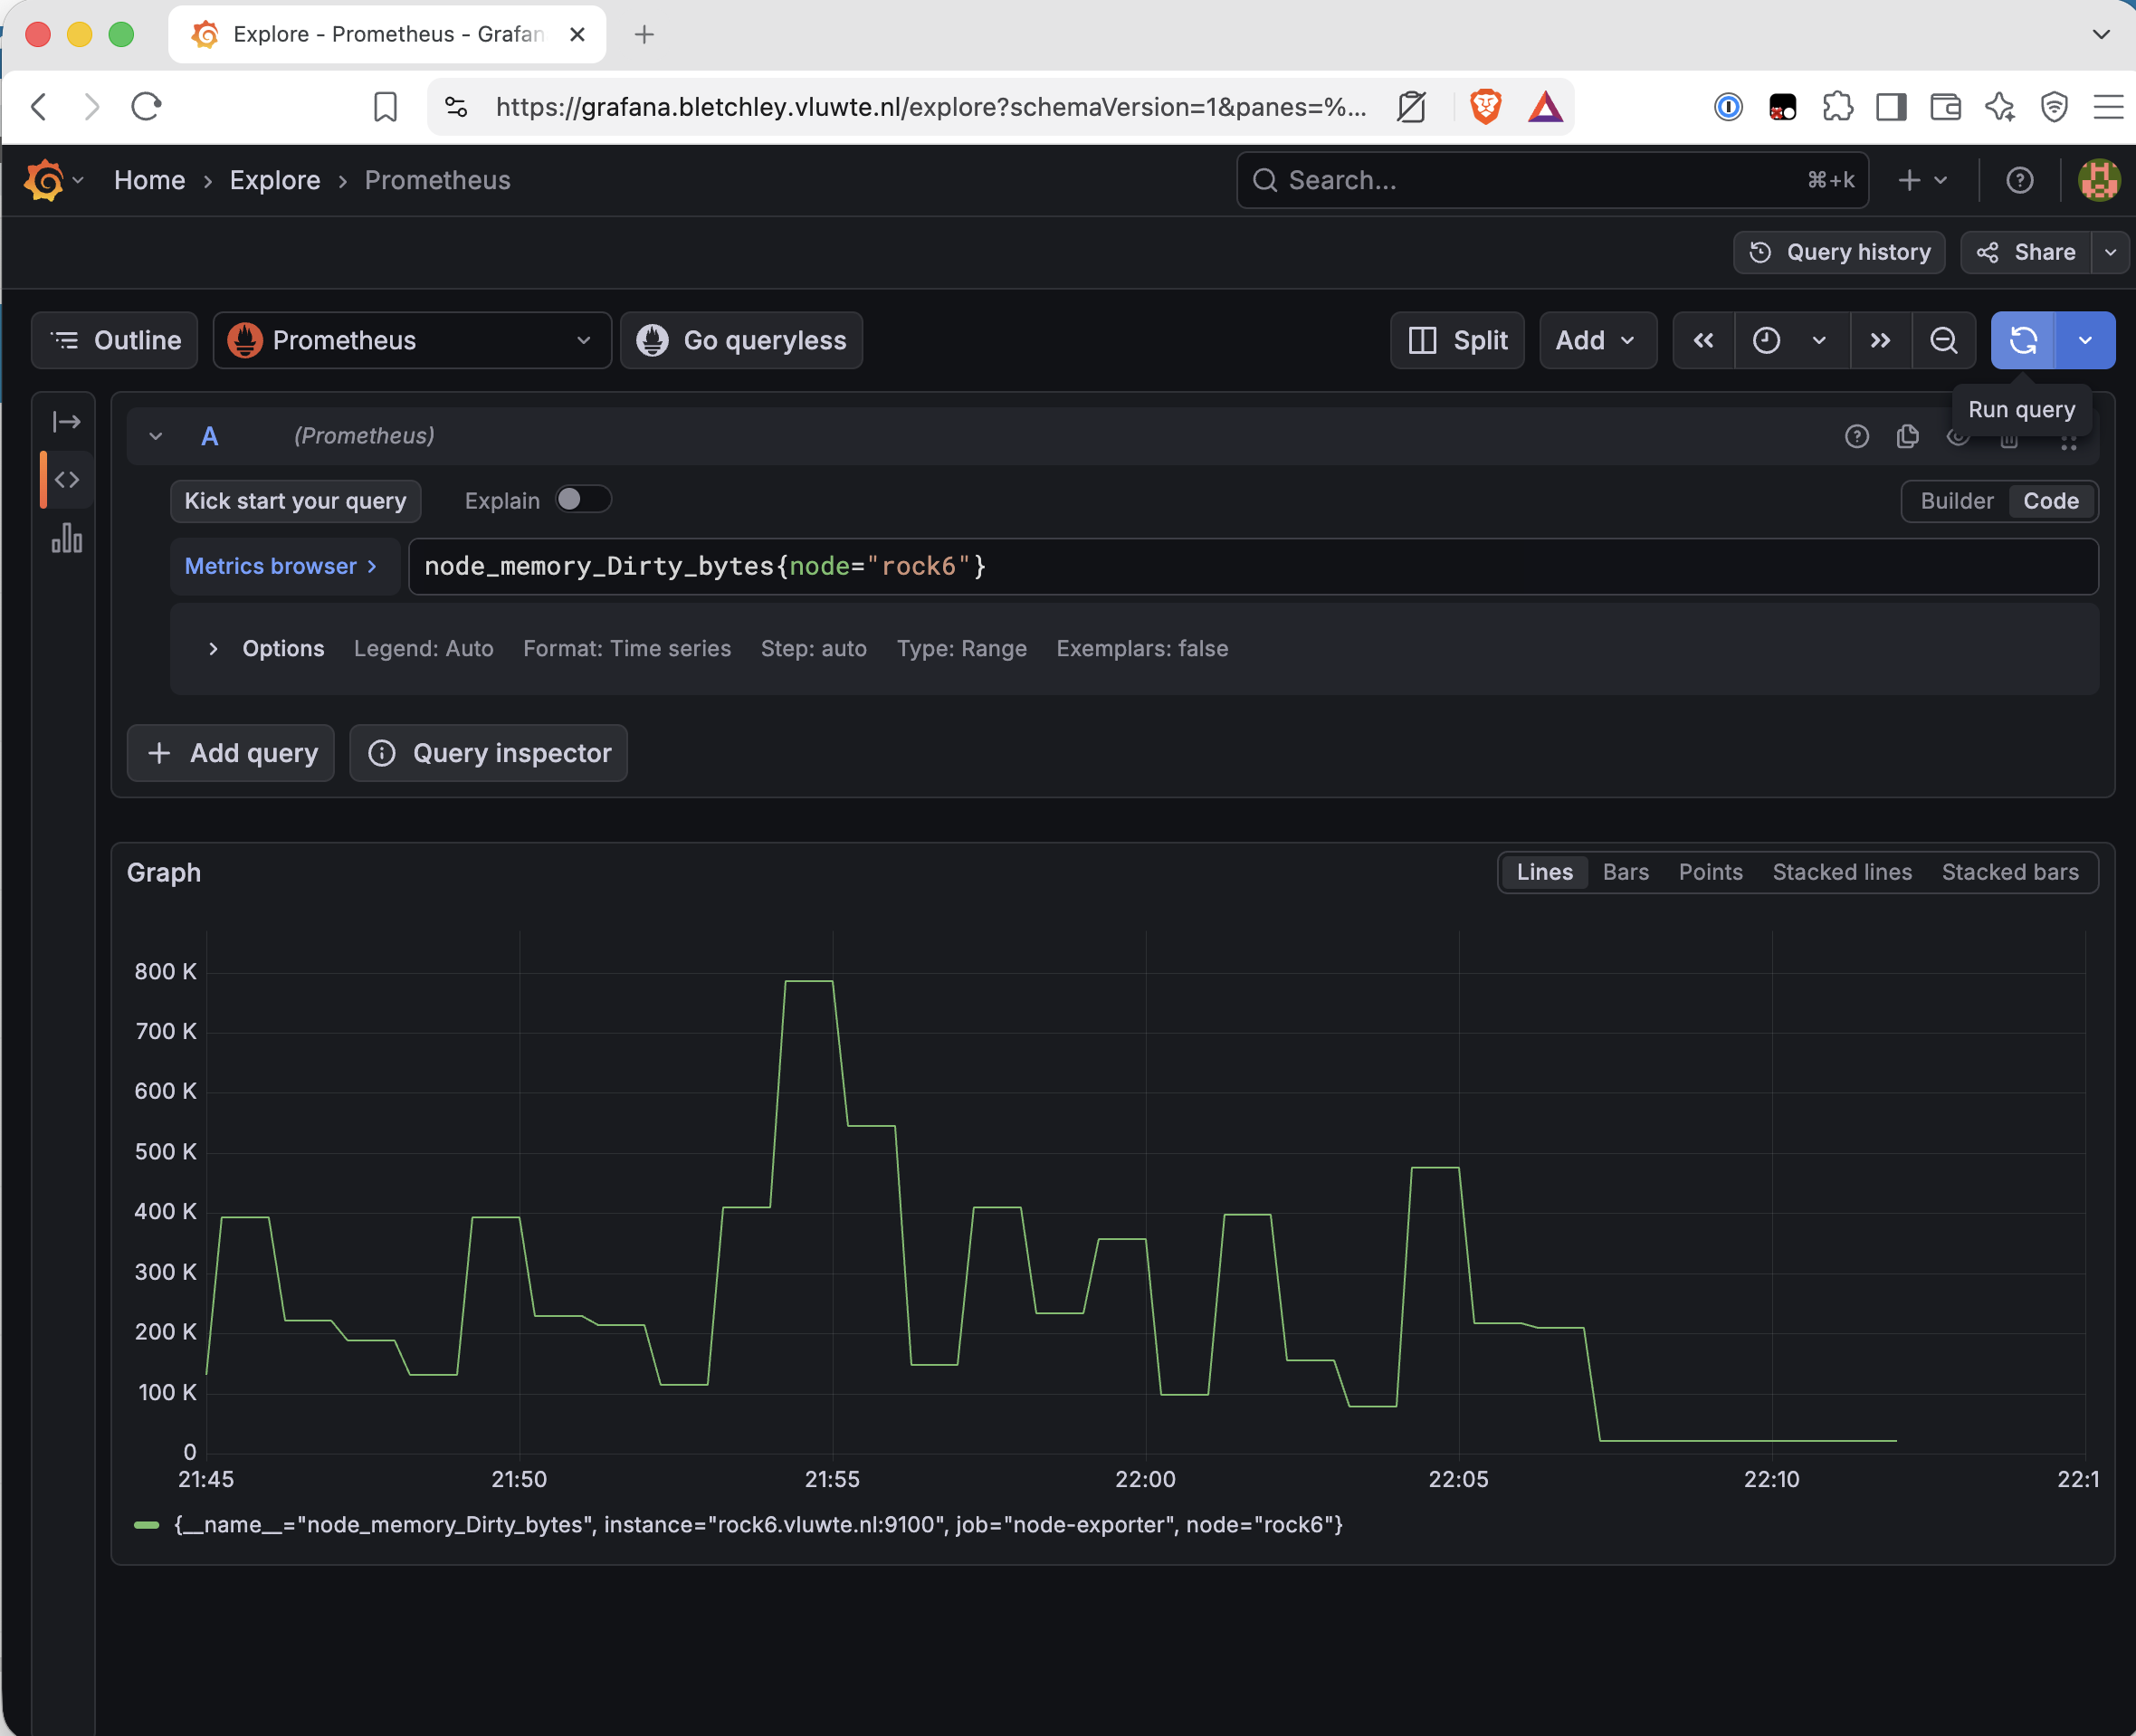
So what did change at 22:07? Memory.
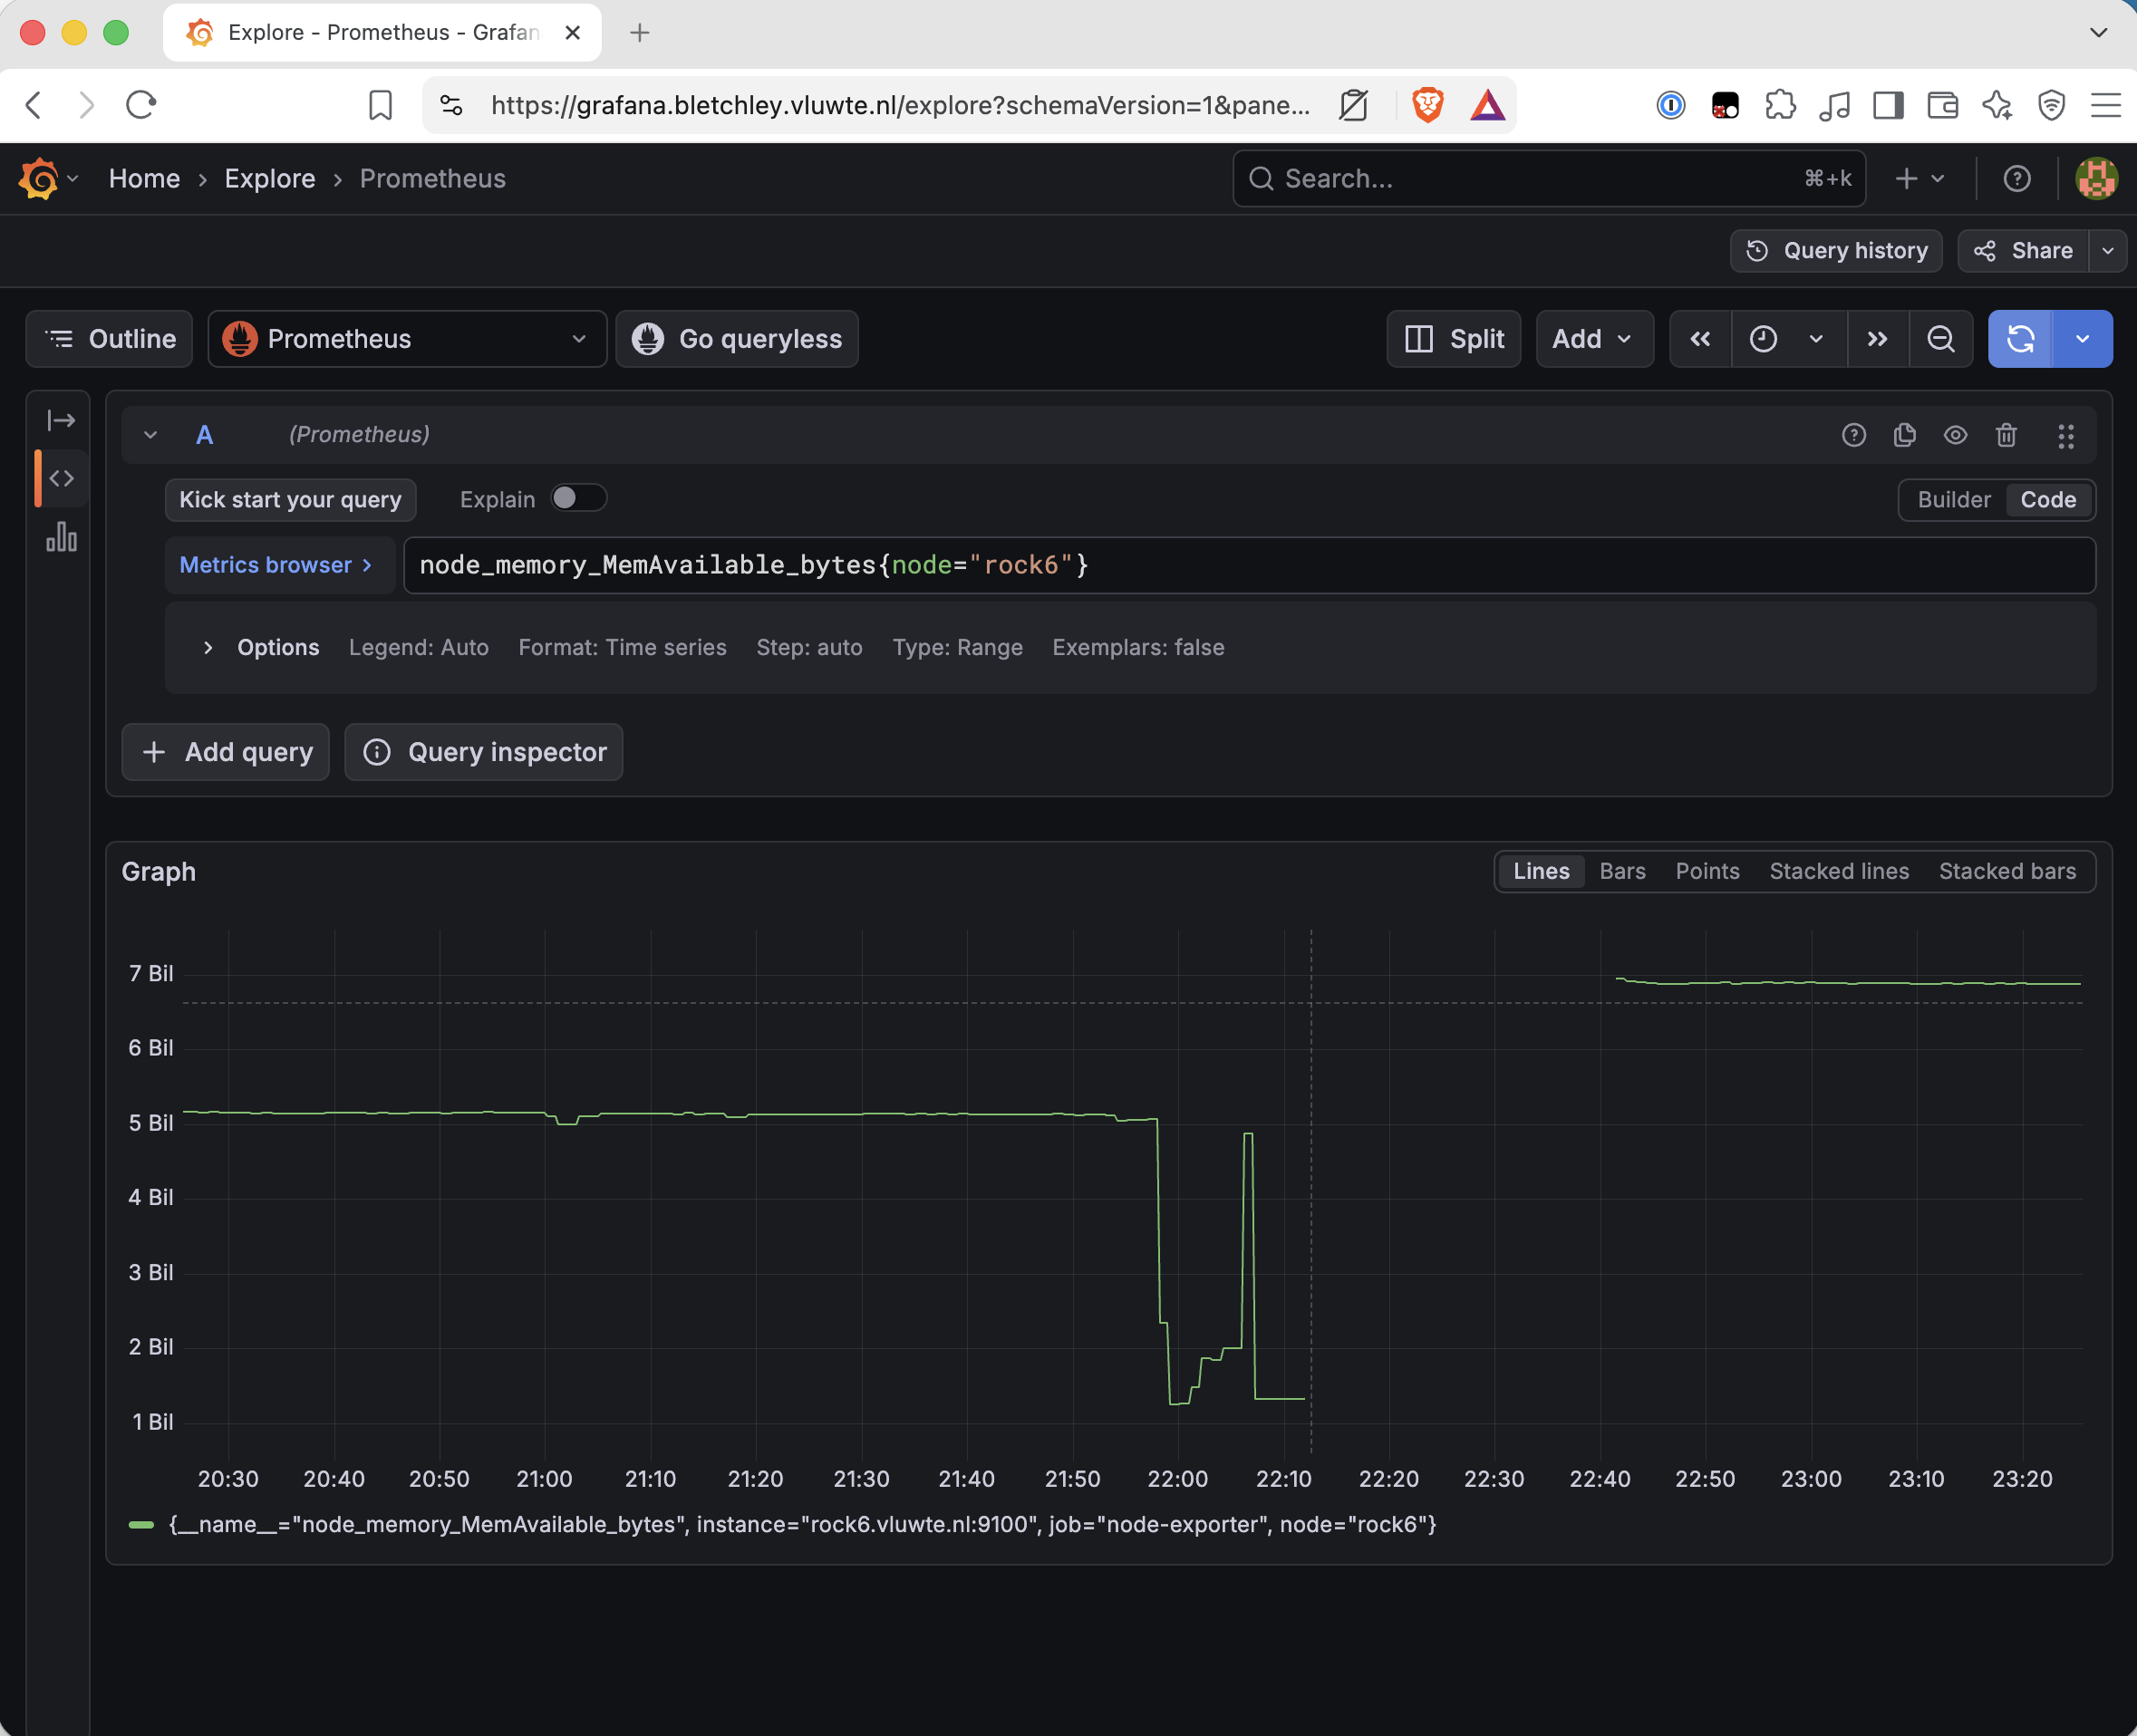
Something took 3.8 GB of an 8 GB node in about a minute at 21:58, ten minutes before anything else went wrong, released it at 22:06, and took it again at 22:07:30, which is the exact moment the writers stopped. A drop, a release and a second grab is not a slow leak. It is one consumer, growing, finishing, and growing again. One cAdvisor query names it:
topk(10, sum by (namespace, pod, container) (
  container_memory_working_set_bytes{kubernetes_io_hostname="rock6", container!="", container!="POD"}))
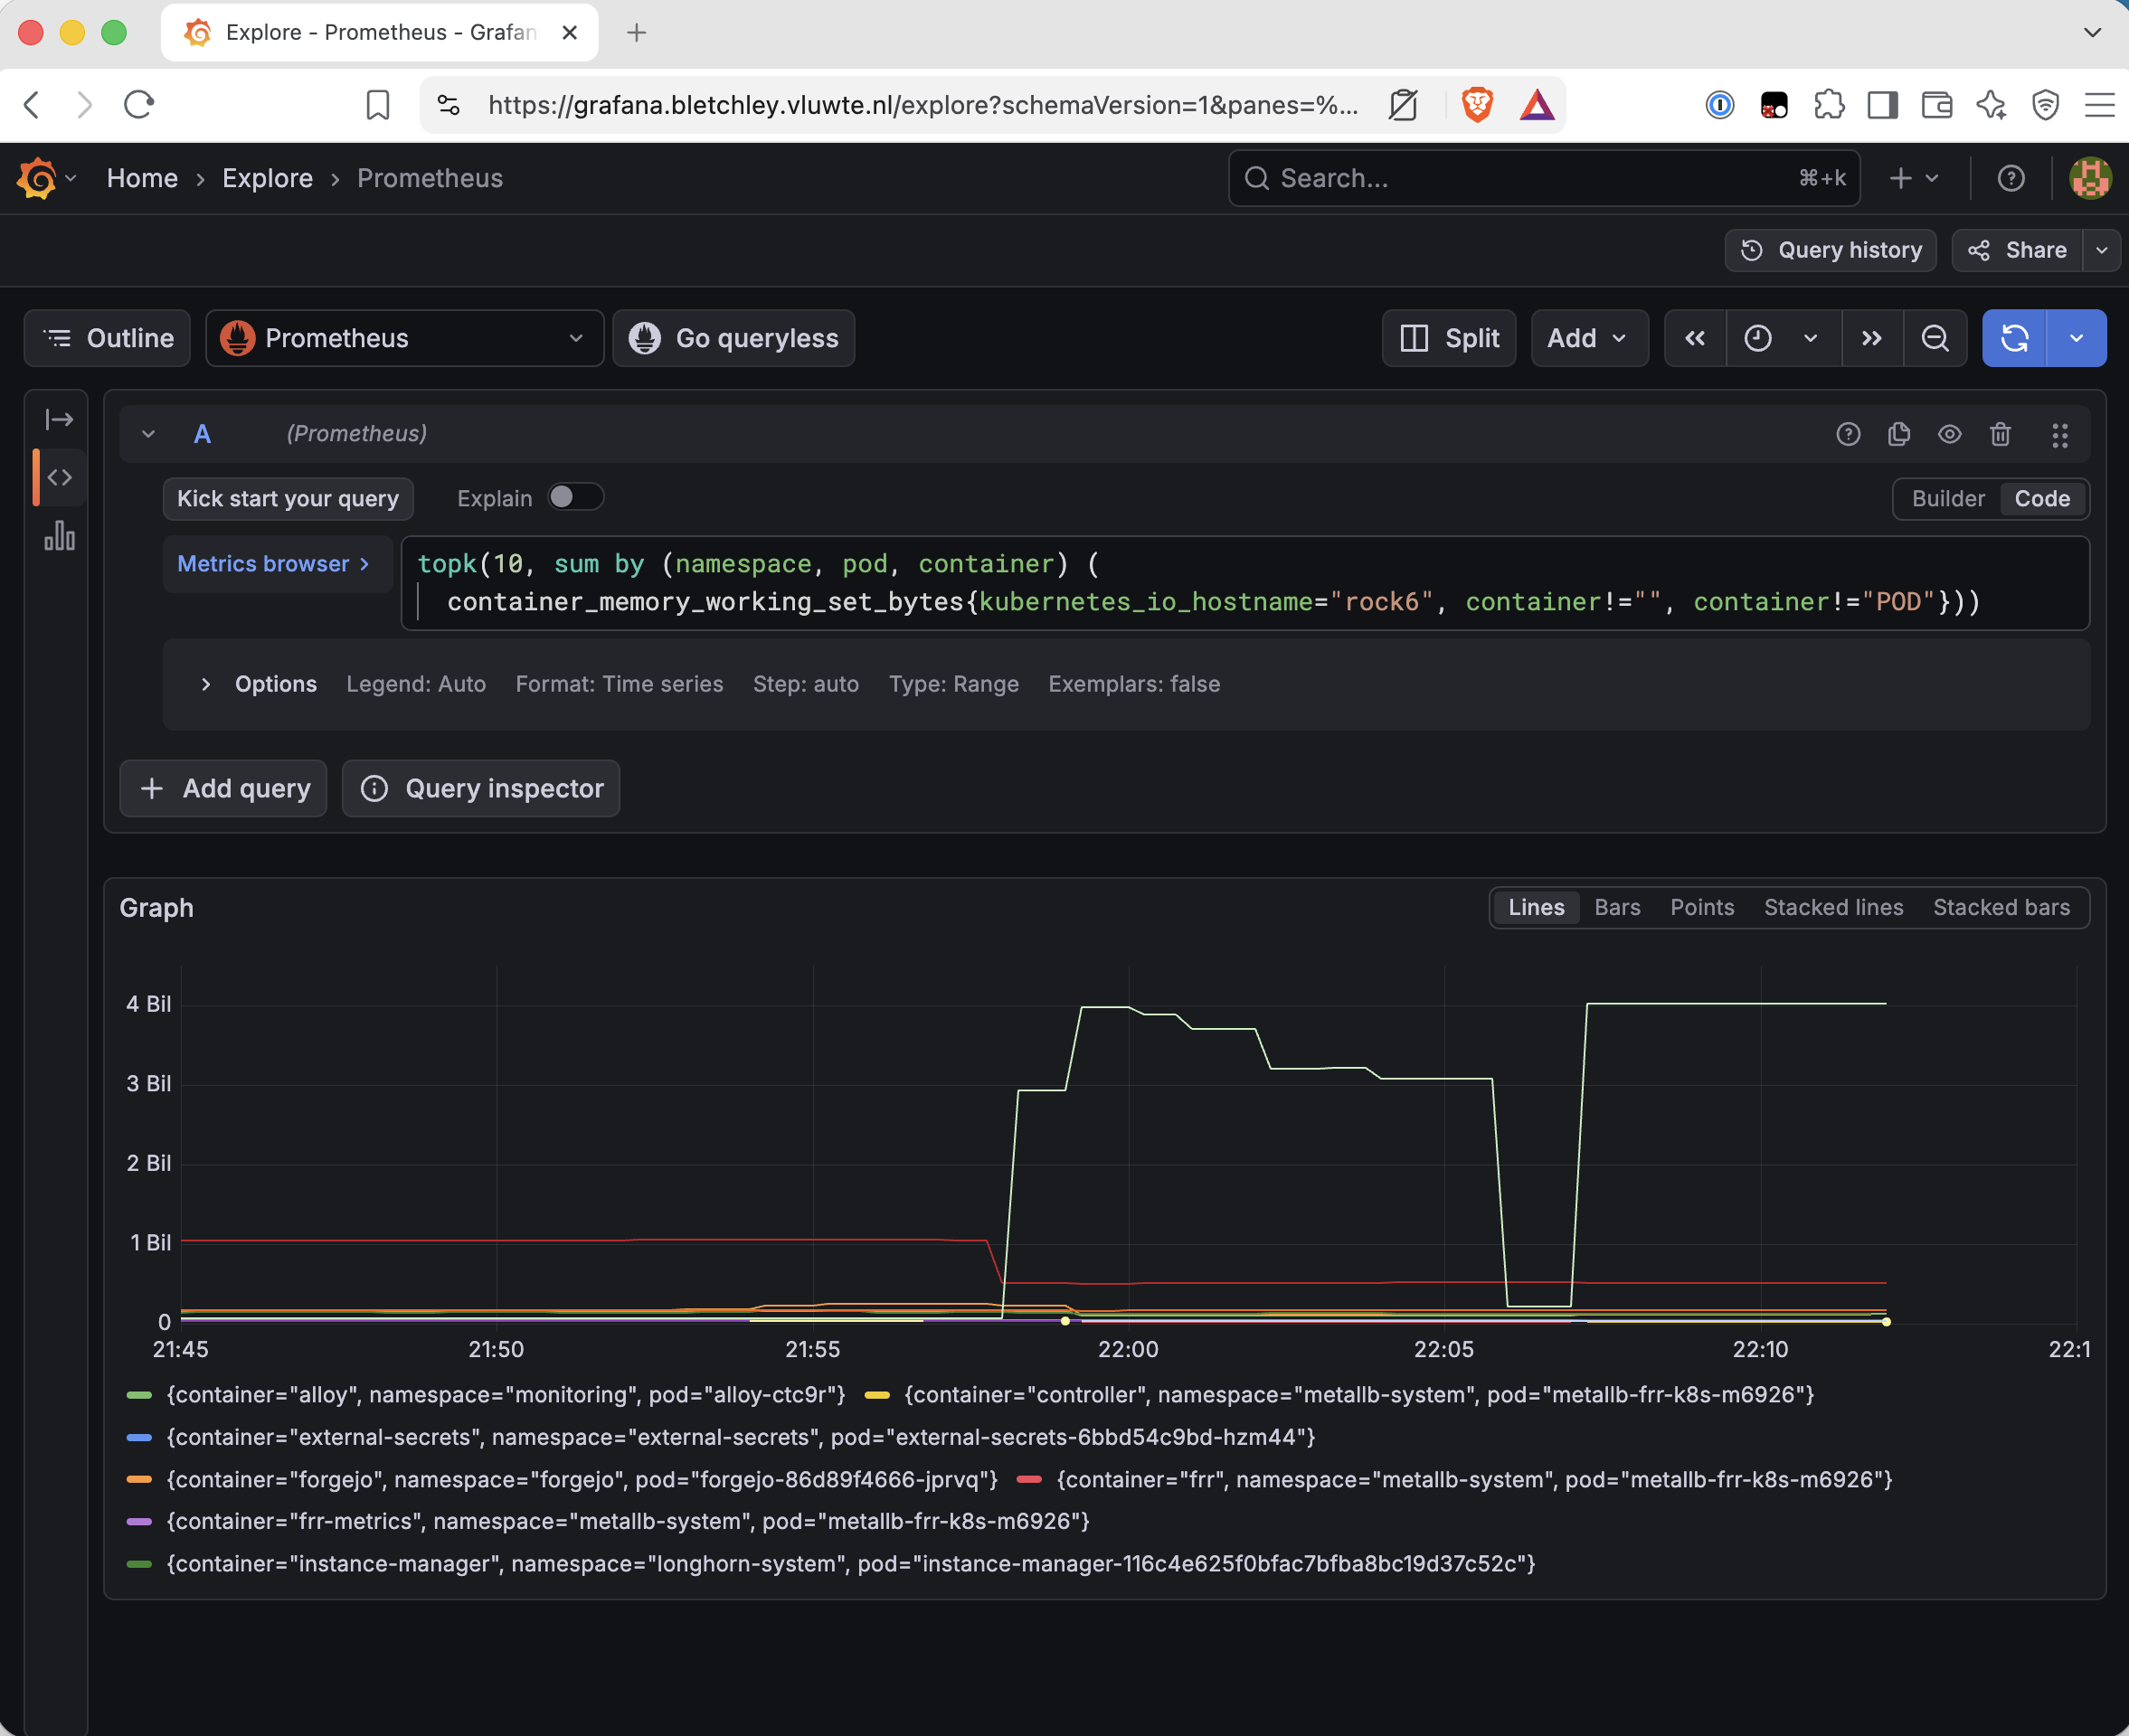
Traefik. The container whose only job that evening was to fail to serve one dashboard.
The loop is a memory amplifier
Once you know it is Traefik, the mechanism explains itself. Every request to the dashboard URL is forwarded by Traefik to Traefik, which forwards it again. The crucial part is not the number of hops, it is that every hop stays in flight while it waits for the next one. Each one holds a goroutine, a connection and its proxy buffers. Nothing is released until the original client gives up, at which point the entire chain unwinds at once and every hop logs a 499. My notes from an earlier look at this route record the rate as roughly a hundred hops per second. At something like a hundred kilobytes per hop, forty thousand hops is four gigabytes, and the arithmetic stops being surprising.
The two grabs line up with two triggers, and both of them were me.
The first, at 21:58, is the browser tab I opened to check whether the dashboard was still broken. That is the report that started the whole evening. The chain held about 4 GB until the browser gave up around 22:06.
The second, at 22:07:30, is almost certainly the ten-host probe at the top of this post. Its very first host is the dashboard, with -m 10, and it returned 000 after ten seconds. The diagnostic I ran to investigate the problem re-triggered the problem, harder. That round did not release, and it coincides with the node going silent.
There is a pointed lesson in that, and it is not really about Traefik. A probe is traffic. When the thing you are investigating is a request amplifier, the neutral-looking curl at the top of your runbook is not an observation, it is a load test.
The part I still cannot prove
What I have is a strong trigger and an incomplete mechanism. Traefik at 4 GB is well evidenced. How a 4 GB Traefik stopped every writing process on the node is not.
The awkward fact is that the node was not out of memory. 1.3 GB stayed available. Whole-node memory pressure, measured as PSI full, peaked at 0.2 percent of the time, and I/O pressure at 0.4 percent. Both are real and both are far too small to describe a frozen node. Processes were not piling up blocked in the kernel either: node_procs_blocked and node_load1 did not stand out, which argues against a lock or an uninterruptible sleep pile-up. And Traefik itself kept serving traffic the entire time, which is the strangest detail of all. The thing that took the memory was the thing that kept working.
My leading candidate is containerd. With the CRI plugin, containerd copies every container's stdout into its log file under /var/log/pods, and the kubelet's logs, exec and port-forward all pass through containerd's streaming server. A containerd that chokes, on the loop's burst of access log lines or on memory, would explain all of it at once: log writes stopping node-wide, the Dirty collapse, the kubelet proxy timeouts I hit with stern and port-forward, and the node going NotReady because the runtime stopped answering, while an already-running Traefik carried on serving from its own process.
That is a story that fits the evidence. It is not a proof, and the evidence that would settle it, rock6's dmesg and kubelet log from before 22:07, went away when I power cycled the module. I have queries ready for the Talos runtime cgroups and Traefik's own router metrics, and if this happens again I will capture dmesg before touching the BMC. For now the honest summary is: trigger confirmed, mechanism unproven.
Stopping the loop
The mitigation is a deletion, but not before checking what takes over the hostname once the Ingress is gone. That was the question the three undocumented IngressRoutes were waiting to answer:
kubectl -n traefik get ingressroute -o custom-columns='NAME:.metadata.name,EP:.spec.entryPoints,MATCH:.spec.routes[*].match,SVC:.spec.routes[*].services[*].name,MW:.spec.routes[*].middlewares[*].name'
NAME                       EP            MATCH                                                                                     SVC            MW
traefik-dashboard          [web]         PathPrefix(`/dashboard`) || PathPrefix(`/api`)                                            api@internal   <none>
traefik-dashboard-http     [web]         Host(`traefik.bletchley.vluwte.nl`)                                                       api@internal   redirect-to-https
traefik-dashboard-secure   [websecure]   Host(`traefik.bletchley.vluwte.nl`) && (PathPrefix(`/dashboard`) || PathPrefix(`/api`))   api@internal   dashboard-redirect,authelia
All three point at api@internal, which is Traefik's internal API served inside the process. No Service port, so no way back in through the front door. A loop is structurally impossible on any of them.
kubectl -n traefik get ingress traefik-dashboard -o yaml > infra/networking/traefik/traefik-dashboard-ingress.backup-20260911.yaml
kubectl -n traefik delete ingress traefik-dashboard
ingress.networking.k8s.io "traefik-dashboard" deleted from traefik namespace
curl -s -o /dev/null -m 3 -w '%{http_code} %{time_total}\n' https://traefik.bletchley.vluwte.nl/
curl -s -o /dev/null -m 3 -w '%{http_code} %{redirect_url}\n' https://traefik.bletchley.vluwte.nl/dashboard/
404 0.038911
302 https://auth.bletchley.vluwte.nl/?rd=https%3A%2F%2Ftraefik.bletchley.vluwte.nl%2Fdashboard%2F&rm=GET
Thirty-nine milliseconds instead of a ten second timeout. The loop is gone.
And that second line rewrites six months of my own notes. traefik-dashboard-secure has existed since March, correctly configured: the secure entrypoint, api@internal, Authelia in front. The dashboard was never broken. Only the root path was.
The reason is Traefik's default router priority, which is the length of the rule string. The Ingress rule, Host(...) && PathPrefix(/), is longer than the secure route's bare Host(...) plus its path prefixes for any request that starts with /dashboard or /api, so the secure route won those and the Ingress only ever caught /. https://traefik.bletchley.vluwte.nl/dashboard/ has very probably worked behind Authelia the entire time.
Which is exactly what I did to myself. I had forgotten that the dashboard lives at /dashboard/, added an Ingress at / to "fix" a problem that did not exist, never tested it properly, and left it there. Six months passed before anyone requested the root URL in earnest, and the first person to do so was me, twice, in one evening.
One thing the deletion cost me. The Ingress carried a cert-manager.io/cluster-issuer annotation, so cert-manager's ingress-shim had created the Certificate for it, owned by the Ingress. Delete the Ingress and Kubernetes garbage collects the Certificate with it. The Secret survives, and mine was valid until 18 October, but nothing was going to renew it.
The route I did not know I was serving
While verifying the fix I ran one more check, aimed at an old note about the dashboard being reachable by IP:
curl -s -o /dev/null -m 3 -w '%{http_code}\n' http://10.0.140.100/dashboard/
200
Two hundred. Plain HTTP, LoadBalancer IP, no redirect, no Authelia, the full dashboard. The next morning I confirmed it in a browser on the hostname too: http://traefik.bletchley.vluwte.nl/dashboard/ loaded without a login. And /api is served by the same route, which means the entire routing configuration of the cluster was readable by anything that could reach port 80.
Look back at that route table. traefik-dashboard sits on the web entrypoint, matches PathPrefix(/dashboard) || PathPrefix(/api), and carries no Host rule and no middleware. It was 136 days old, about five weeks younger than the other two, and I had no memory of creating it.
There is a good reason for that: I did not create it. The match string is character for character the Traefik Helm chart's default dashboard route.
Then the priority rule does its second piece of damage, this time on the web entrypoint. A plain HTTP request for /dashboard/ on the dashboard's own hostname can match two routes. The chart's rule is the longer of the two, 46 characters against 35 for traefik-dashboard-http, counting Traefik's backquotes. Longer wins, so the chart's route took the request and the redirect to HTTPS in traefik-dashboard-http never ran. Authelia guards the websecure side, which that request never reached, so nothing asked me to log in. The page was simply served.
The missing Host clause widens it further. That rule matches on path alone, so it applies to any name that resolves to 10.0.140.100, and it can shadow /dashboard or /api on any other host whose own rule happens to be shorter than 46 characters.
That also rules out the obvious fix. The route is a Helm-rendered object, so kubectl delete would remove it only until the next helm upgrade put it back. The change has to go into the values:
kubectl -n traefik get ingressroute traefik-dashboard -o jsonpath='{.metadata.labels}{"\n"}'
helm get values traefik -n traefik | grep -iA6 ingressRoute
{"app.kubernetes.io/instance":"traefik-traefik","app.kubernetes.io/managed-by":"Helm","helm.sh/chart":"traefik-40.2.0"}
ingressRoute:
  dashboard:
    enabled: true
    entryPoints:
    - web
And this is the part that I think is the most transferable lesson in the whole evening. My repo has two values files, and the documented upgrade command passes both:
grep -n -A4 'ingressRoute' infra/networking/traefik/traefik-values.yaml infra/networking/traefik/values-patch.yaml
infra/networking/traefik/traefik-values.yaml:4:ingressRoute:
infra/networking/traefik/traefik-values.yaml-5-  dashboard:
infra/networking/traefik/traefik-values.yaml-6-    enabled: false
--
infra/networking/traefik/values-patch.yaml:1:ingressRoute:
infra/networking/traefik/values-patch.yaml-2-  dashboard:
infra/networking/traefik/values-patch.yaml-3-    enabled: true
The main values file disables the chart's dashboard route. The patch file re-enables it, and because it is passed second, it wins. If you opened the file that looks like the configuration, you would conclude the unauthenticated route does not exist. It did exist, it was serving, and the file that said otherwise was right there in git looking authoritative.
The fix is five deleted lines in values-patch.yaml, which leaves enabled: false from the main file in force. Before applying it, a pre-flight diff of what Helm would send against what the release currently holds, so that the only change is the one I intend:
diff <(helm get values traefik -n traefik) \
     <(helm upgrade traefik traefik/traefik -n traefik \
         -f infra/networking/traefik/traefik-values.yaml \
         -f infra/networking/traefik/values-patch.yaml \
         --version 40.2.0 --dry-run --debug 2>&1 \
       | awk '/^USER-SUPPLIED VALUES:/{f=1} /^COMPUTED VALUES:/{f=0} f')
4c4
<     enabled: true
---
>     enabled: false
One line. Nothing else in the release drifts, which also answers the question of whether the two files together still reproduce what is deployed. Then the upgrade, with the chart version pinned explicitly because an unpinned helm upgrade resolves to whatever is newest in the local repo cache:
helm upgrade traefik traefik/traefik -n traefik \
  -f infra/networking/traefik/traefik-values.yaml \
  -f infra/networking/traefik/values-patch.yaml \
  --version 40.2.0
Release "traefik" has been upgraded. Happy Helming!
REVISION: 15
kubectl -n traefik get deploy traefik -o jsonpath='{.metadata.generation}{"\n"}'
curl -s -o /dev/null -m 3 -w '%{http_code}\n' http://10.0.140.100/dashboard/
curl -s -o /dev/null -m 3 -w '%{http_code} %{redirect_url}\n' http://traefik.bletchley.vluwte.nl/dashboard/
10
404
301 https://traefik.bletchley.vluwte.nl/dashboard/
Deployment generation still 10, so Traefik did not restart and no ingress host blinked. The bare IP now 404s. The hostname on plain HTTP finally does what I always believed it did, which is redirect to HTTPS, where Authelia takes over.
I had assumed for months that the HTTP entrypoint redirected everything to HTTPS. It did, for every path except the two that led to the dashboard and the API.
Rebuilding it properly
Two things were still outstanding: the certificate that the deletion had orphaned, and the root URL, which now returned an honest 404 rather than a dishonest timeout.
The certificate becomes an explicit object instead of a side effect of an annotation, which is how I handle certificates elsewhere in the cluster now:
# infra/networking/traefik/certificate-traefik-dashboard.yaml
apiVersion: cert-manager.io/v1
kind: Certificate
metadata:
  name: traefik-dashboard-tls
  namespace: traefik
spec:
  secretName: traefik-dashboard-tls
  dnsNames:
    - traefik.bletchley.vluwte.nl
  issuerRef:
    name: letsencrypt-production
    kind: ClusterIssuer
kubectl apply -f infra/networking/traefik/certificate-traefik-dashboard.yaml
kubectl -n traefik get certificate traefik-dashboard-tls
kubectl -n traefik get secret traefik-dashboard-tls -o jsonpath='{.data.tls\.crt}' | base64 -d | openssl x509 -noout -enddate
certificate.cert-manager.io/traefik-dashboard-tls created
NAME                    READY   SECRET                  AGE
traefik-dashboard-tls   True    traefik-dashboard-tls   13s
notAfter=Oct 18 07:17:31 2026 GMT
READY=True with the expiry unchanged means cert-manager adopted the existing Secret rather than issuing a new certificate. No Let's Encrypt request, no rate limit spent, and renewal is managed again.
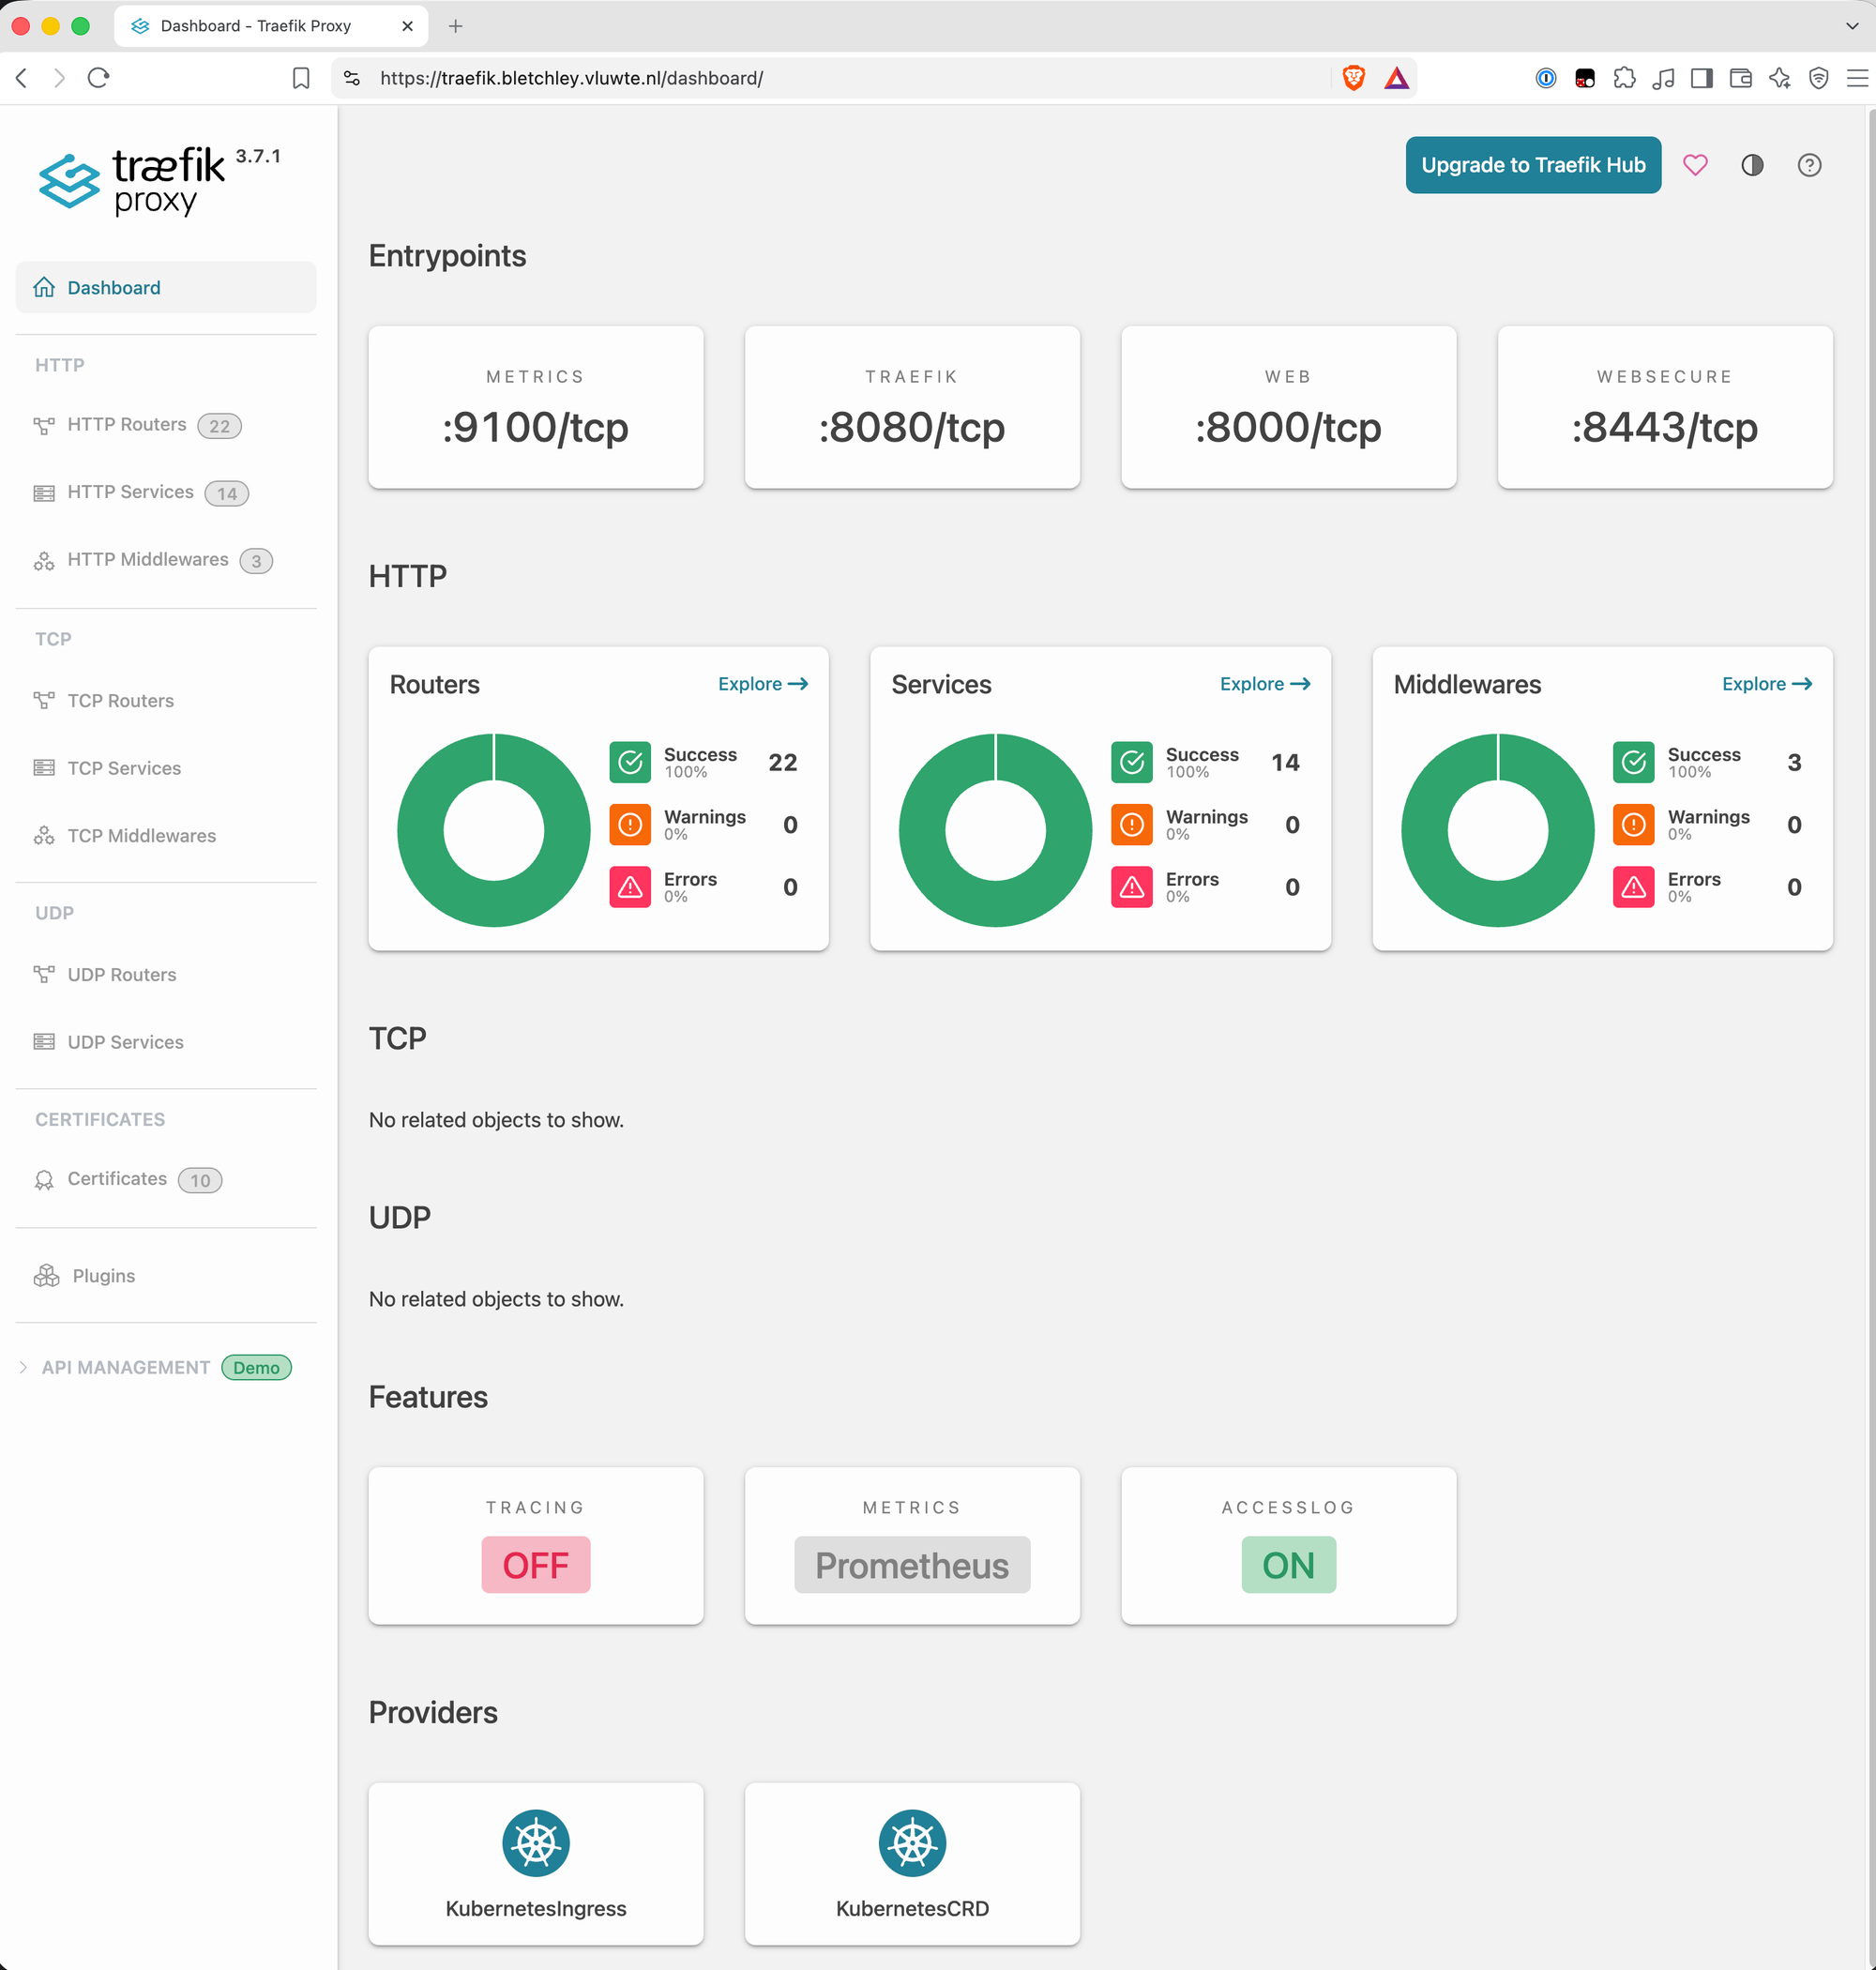
For the root URL, the pieces were already in the cluster and had never been wired up. A dashboard-redirect middleware existed, attached to the secure route, but that route only matched /dashboard and /api, so the middleware never saw a request for /. Widening the regex to cover the bare host and /, and widening the route to the whole host:
 spec:
   redirectRegex:
-    regex: ^https://traefik.bletchley.vluwte.nl/dashboard$
+    regex: ^https://traefik\.bletchley\.vluwte\.nl(/|/dashboard)?$
     replacement: https://traefik.bletchley.vluwte.nl/dashboard/
     permanent: true
   routes:
     - kind: Rule
-      match: Host(`traefik.bletchley.vluwte.nl`) && (PathPrefix(`/dashboard`) || PathPrefix(`/api`))
+      match: Host(`traefik.bletchley.vluwte.nl`)
       middlewares:
         - name: dashboard-redirect
         - name: authelia
The trailing (/|/dashboard)?$ matters more than it looks. It matches the bare host, / and /dashboard, and deliberately does not match /dashboard/, which is what keeps the browser out of a client-side redirect loop. Middleware order matters too, and this order is the right one: the redirect answers / before authentication is involved, because a public redirect leaks nothing, and every other path goes on to Authelia.
My first attempt at the route change did nothing at all, because the file holds two IngressRoutes and I edited the one that already had the shape I was aiming for. traefik-dashboard-http is a bare Host(...) match with the HTTPS redirect on the web entrypoint, which looks exactly like the target state when you are reading quickly at midnight. The route that needed widening was -secure, further down the same file.
curl -s -o /dev/null -m 5 -w '%{num_redirects} %{http_code}\n' -L https://traefik.bletchley.vluwte.nl/
2 200
And in a browser with no Authelia session:
| Request | Result |
|---|---|
http://traefik.bletchley.vluwte.nl |
Authelia login, then /dashboard/ |
http://traefik.bletchley.vluwte.nl/dashboard |
Authelia login, then /dashboard/ |
http://traefik.bletchley.vluwte.nl/incorrect-url |
Authelia login, then 404 |
That last row is a deliberate side effect worth naming. Because the secure route now matches the whole host, an unknown path authenticates first and 404s afterwards, where previously it 404'd immediately. That is more clicks and the safer order: an unauthenticated visitor learns nothing about which paths exist.
Lessons Learned
- A routing loop is not a cosmetic bug. I classified this as "the dashboard does not load" for six months. It was a request amplifier that turned a single HTTP GET into gigabytes of resident memory on a node that hosts a third of my cluster. The symptom you see is not necessarily the size of the problem.
- Diagnostics are traffic. My ten-host probe loop, written to observe the problem, almost certainly triggered the second and worse round of it. When the thing under investigation amplifies requests, remove it from the probe list before you start, and watch the memory graph while you test the fix.
- Traefik's router priority is the length of the rule string. Two rules I never compared were silently deciding which of them served a path, in both directions: a too-long rule shadowed the working dashboard route at
/, and another too-long rule shadowed the HTTPS redirect for/dashboardand/api. If you have overlapping rules and have not set explicit priorities, you have an ordering you did not choose. - A second values file that contradicts the first is a security hazard, not just untidiness.
traefik-values.yamlsaid the chart's dashboard route was disabled. It was enabled, by a patch file passed after it. Anyone auditing the obvious file, including me, would have come away with the wrong answer. - Deleting an Ingress deletes the certificate its annotation created. Ingress-shim sets the Ingress as the owner of the
Certificate, so garbage collection takes it. The Secret stays behind and quietly stops renewing, which is a failure you find out about five weeks later. An explicitCertificateobject does not have this problem. - One Traefik replica plus
externalTrafficPolicy: Localmeans one node is the entire ingress path. MetalLB only announces the LoadBalancer IP from nodes running a Traefik pod. rock6 was Traefik, the announcer for 10.0.140.100, and Forgejo, all at once. A second replica on the other board is not redundancy for a pod, it is redundancy for the path. - Verify your out-of-band console before you need it.
tpi uartreturned nothing for rock6 during the hang and nothing across a fresh boot. A BMC that can power cycle a node but cannot show you why it hung is half a BMC. The same evening reminded me that the slot to node mapping for both boards is something I know rather than something I have written down, and the moment you are typing a power command is a poor time to be relying on memory alone.
What's Next
Immediate:
- A memory limit on the Traefik container, so that a runaway gets OOM killed inside its own cgroup instead of taking the node with it.
- A second Traefik replica with anti-affinity across the two TuringPi boards.
- An alert on
kube_node_status_condition{condition="Ready",status="true"} == 0. A node wasNotReadyfor twenty five minutes and I found it by accident, while looking at something else.
Still open:
- The mechanism by which a 4 GB Traefik stopped every writer on rock6. Next time it happens,
dmesgand the kubelet log get captured before the BMC gets touched. - A history query over Traefik's per-pod memory for the full retention period, to find out whether the "intermittent git trouble" I shrugged off earlier that day, and others before it, were smaller rounds of the same loop.
- Working out where Talos sends its console on the RK1, and whether it can be pointed at the UART the BMC reads.
- Auditing every route in the cluster the way I audited these four. This one hid an unauthenticated API for months behind a rule I did not write and a values file that said it was off.
← Previous: The Alert That Named a Pod
Questions or suggestions? Leave a comment below or reach out at igor@vluwte.nl.