stern: Real-Time Log Tailing Across Your Kubernetes Cluster
stern tails logs from multiple Kubernetes pods at once. I used it to find a pending Traefik upgrade and reconstruct a PVC resize across five pod types.
Introduction
kubectl logs is fine for checking a single pod. But on a cluster with dozens of pods spread across multiple namespaces — Longhorn running four manager pods plus controllers, authentication handled by Authelia, secrets managed by OpenBao and ESO — a single-pod view is often the wrong tool. You end up running five commands in five terminals, missing the moment where the pieces connect.
stern solves this. It's a CLI tool that tails logs from multiple pods simultaneously, with filtering, timestamps, and label selectors. Nothing is deployed to the cluster — it's a binary on your machine that uses the same kubeconfig as kubectl. One command, one stream, every pod you care about.
I installed it and spent an evening watching the Bletchley cluster from the inside. This is what I found.
🛠️ This is part of the Homelab Tools series - useful applications and utilities running on the Bletchley cluster.
- k9s
- stern: Real-Time Log Tailing Across Your Kubernetes Cluster (you are here)
Installation
brew install stern
stern --version
That's it. Nothing is deployed to the cluster. Stern uses the current context from ~/.kube/config, the same as kubectl.
Tab completion is available for zsh, bash, and fish. For zsh, add to your .zshrc:
autoload -Uz compinit && compinit
source <(stern --completion zsh)
Then reload with exec zsh.
The basics
Stern takes a pod name pattern (regex) and a namespace, then tails all matching pods in one stream. Each line is prefixed with the pod name and container name so you always know where it came from. One thing it handles better than kubectl logs is pod restarts — when a container exits and restarts, stern automatically reconnects and keeps tailing. You see a - line as the old container exits and a + line as the new one starts, with minimal interruption in the stream. With kubectl logs you'd have to rerun the command.
The core flags worth knowing:
| Flag | What it does |
|---|---|
. |
Match all pods in the namespace (a regex that matches any pod name) |
-n <namespace> |
Target a specific namespace — use multiple -n flags for multiple namespaces |
-A |
All namespaces |
--include <pattern> |
Show only lines matching the regex — like grep |
--exclude <pattern> |
Hide lines matching the regex — like grep -v |
--since 1h |
Only show logs from the past hour |
--tail 50 |
Show only the last N lines per container on connect, instead of the full backlog |
--timestamps |
Prepend RFC3339 timestamps to each line |
--no-follow |
Dump existing logs and exit, don't tail live |
--color=never |
Disable colour — essential on light terminals |
--max-log-requests 200 |
Raise the default 50-concurrent log requests limit for large namespaces |
Both --include and --exclude use Go regular expressions. (error|warn) for OR, (?i)error for case-insensitive. The filtering happens client-side — stern fetches the full log stream and filters on your machine, which is why you'll see throttling messages when tailing many pods at once.
Stern also supports Go templates for custom output formatting — useful if you want to parse JSON logs or reshape output for export. For everyday tailing the default format is hard to beat.
What the cluster looks like from the inside
The namespace flood
The first thing you notice when you point stern at a busy namespace is the + lines — one per pod and container as stern opens log streams:
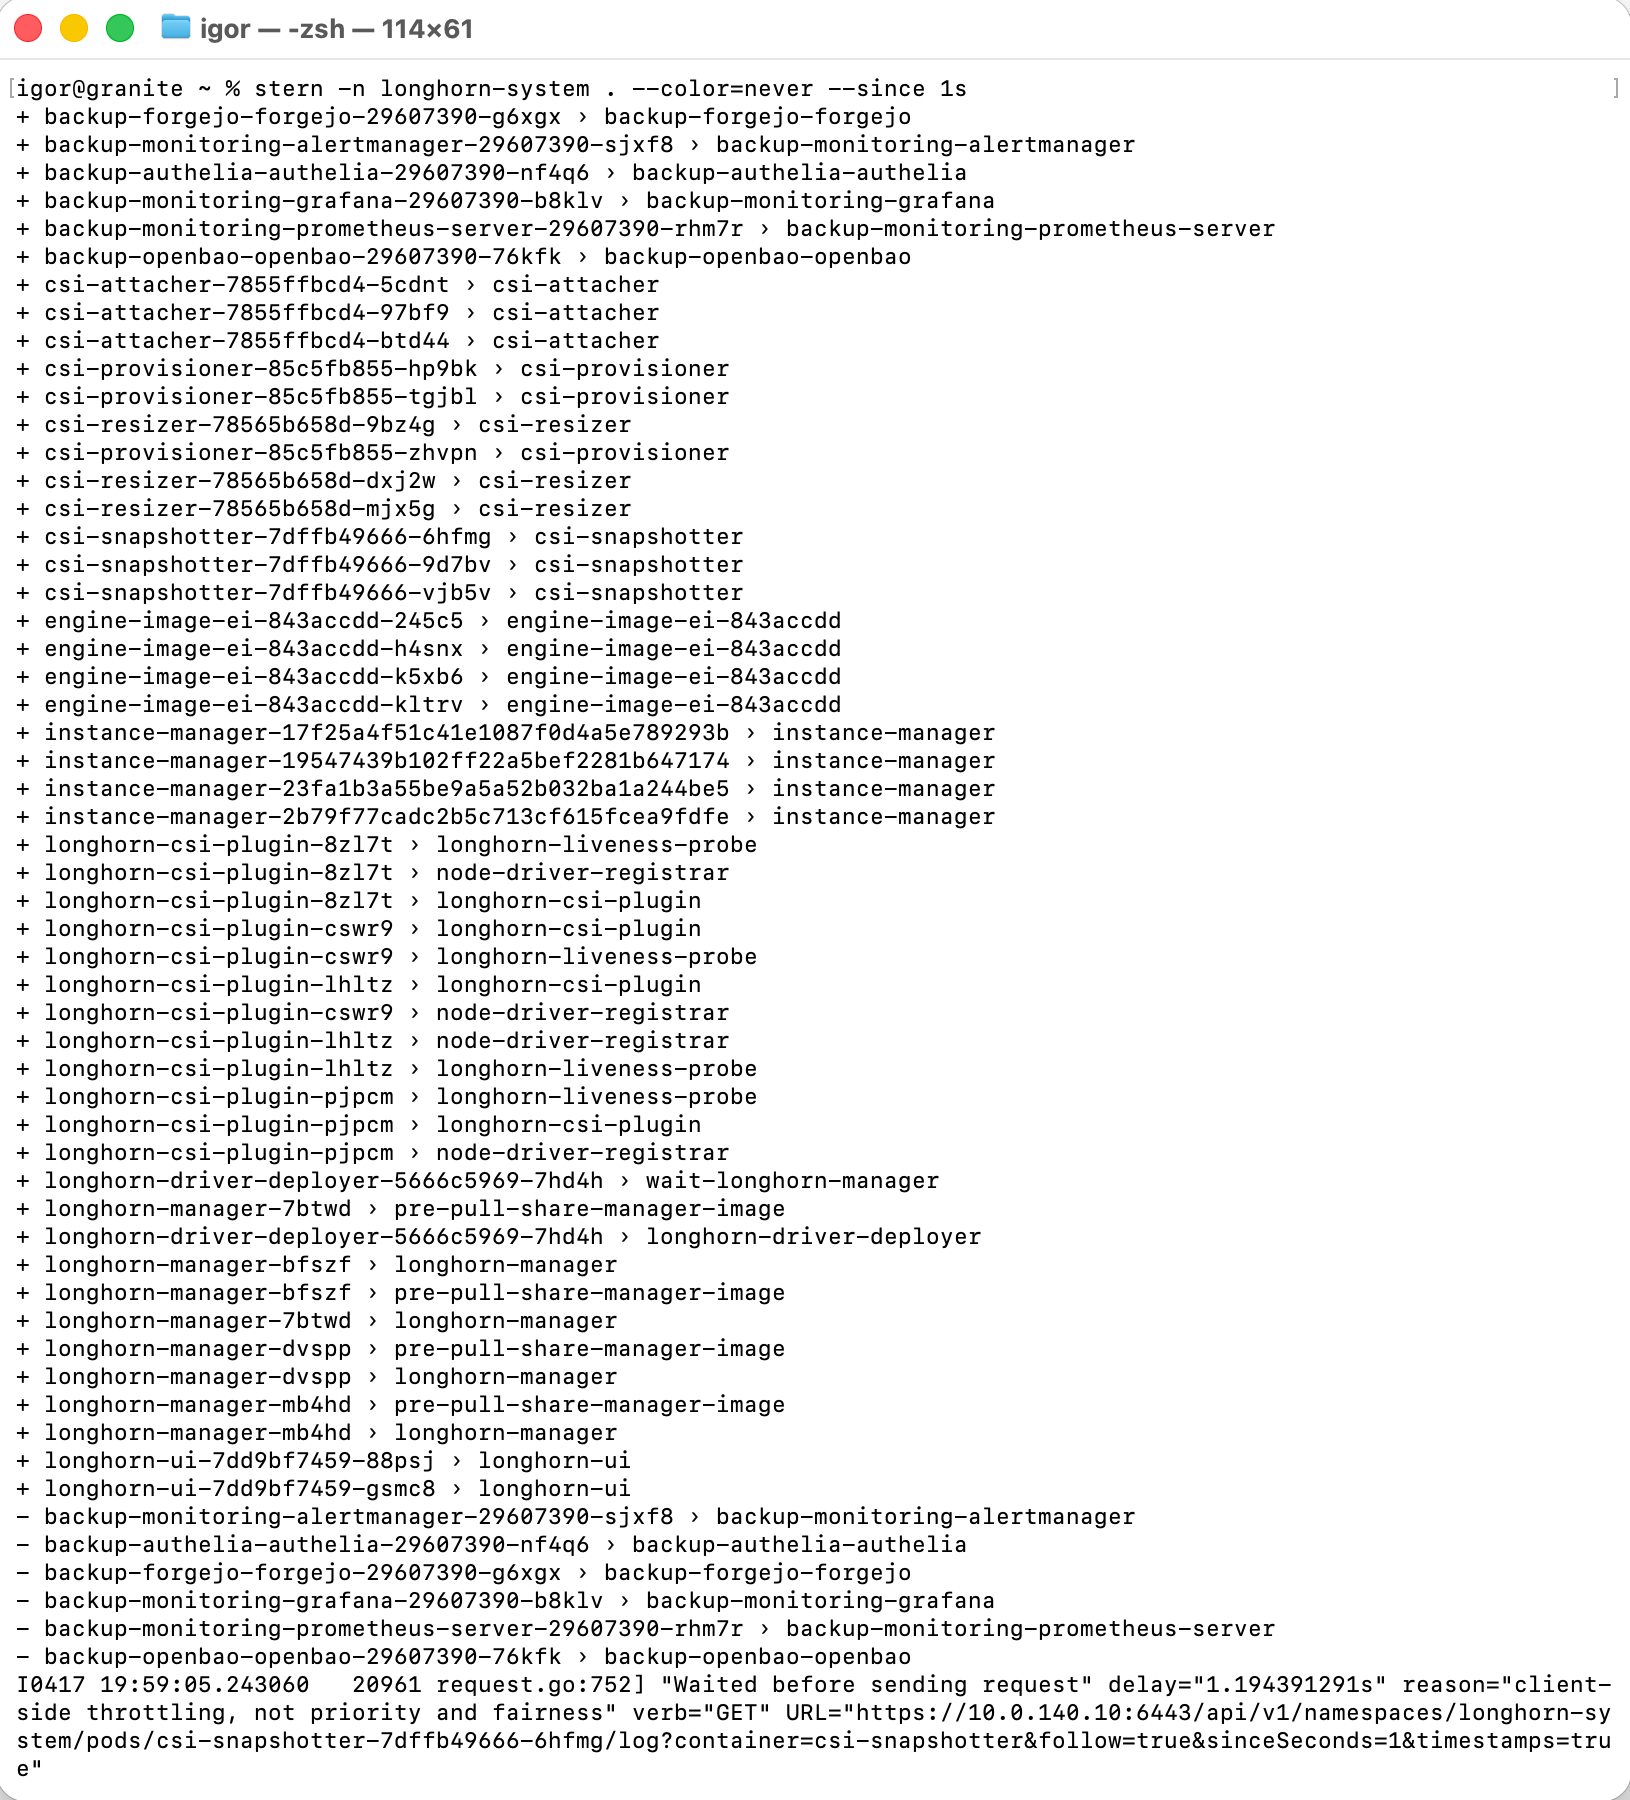
Longhorn alone has over 50 containers: CSI attacher, provisioner, resizer, and snapshotter (three replicas each), four engine images, four instance managers, four CSI plugin pods with three containers each, four manager pods, the driver deployer, and the UI. Without stern you'd need to know which pod to look at before you could look at it.
The - lines at the bottom are the scheduled backup job pods completing and being released. The throttling line is stern being rate-limited by the Kubernetes API as it opens too many streams simultaneously — normal behaviour when connecting to a large namespace.
Finding a Traefik upgrade notice
stern -n traefik . --no-follow --color=never
+ traefik-6c8d6895cd-wwxhm › traefik
traefik-6c8d6895cd-wwxhm traefik 2026-04-15T12:49:25Z WRN A new release of Traefik has been found: 3.6.13. Please consider updating.
traefik-6c8d6895cd-wwxhm traefik 2026-04-16T12:49:25Z WRN A new release of Traefik has been found: 3.6.13. Please consider updating.
- traefik-6c8d6895cd-wwxhm › traefik
A few things worth noting here. Only one + line — Traefik runs as a single replica. The update notice fires at exactly 12:49:25 on both days, to the second — Traefik's daily version check is precise. The - line at the end is --no-follow cleanly releasing the pod after draining the backlog.
Traefik logs nothing for normal requests by default — access logging is opt-in via accessLog: {} in the Helm values. If you're watching a ForwardAuth flow, watch Authelia directly or use stern -n traefik -n authelia . — Traefik stays quiet, Authelia does all the talking.
The cluster was running 3.6.11. Traefik 3.6.13 is available.
Reading the backup controller
stern -n backup-controller . --since 5m --no-follow --color=never
+ backup-controller-5695469464-88g7h › backup-controller
backup-controller-5695469464-88g7h backup-controller [watch]     stream timeout — reconnecting
backup-controller-5695469464-88g7h backup-controller [watch]     running full reconcile before reconnect
backup-controller-5695469464-88g7h backup-controller [pvcs]  found 9 total PVCs, 6 backed by Longhorn
backup-controller-5695469464-88g7h backup-controller [reconcile] full pass starting
backup-controller-5695469464-88g7h backup-controller [unchanged     ] authelia/authelia: job='backup-authelia-authelia' cron='30 0/4 * * ?' retain=8
backup-controller-5695469464-88g7h backup-controller [unchanged     ] forgejo/forgejo-data: job='backup-forgejo-forgejo' cron='30 0/4 * * ?' retain=8
backup-controller-5695469464-88g7h backup-controller [unchanged     ] monitoring/grafana: job='backup-monitoring-grafana' cron='30 0/4 * * ?' retain=8
backup-controller-5695469464-88g7h backup-controller [unchanged     ] monitoring/prometheus-server: job='backup-monitoring-prometheus-server' cron='30 0/4 * * ?' retain=8
backup-controller-5695469464-88g7h backup-controller [unchanged     ] monitoring/storage-prometheus-alertmanager-0: job='backup-monitoring-alertmanager' cron='30 0/4 * * ?' retain=8
backup-controller-5695469464-88g7h backup-controller [unchanged     ] openbao/data-openbao-0: job='backup-openbao-openbao' cron='30 0/4 * * ?' retain=8
backup-controller-5695469464-88g7h backup-controller [reconcile] complete — 6 valid, 0 skipped, 0 conflicts
backup-controller-5695469464-88g7h backup-controller [orphan]    no orphaned jobs found
backup-controller-5695469464-88g7h backup-controller [watch]     starting PVC watch stream
backup-controller-5695469464-88g7h backup-controller [event]     ADDED authelia/authelia
...
- backup-controller-5695469464-88g7h › backup-controller
The [watch] stream timeout — reconnecting at the top is a self-healing event — the controller lost its Kubernetes watch stream and recovered automatically. This is normal watch behaviour, but it's invisible if you only check pod status. Stern caught it.
The [unchanged] lines confirm all 6 backup jobs are correctly configured. The sequence reads like a status report: timeout → reconcile → all valid → watch restarted → PVCs rediscovered.
Adding --timestamps to the same command reveals how long it actually took:
stern -n backup-controller . --since 5m --no-follow --color=never --timestamps
backup-controller-5695469464-88g7h backup-controller 2026-04-16T21:35:54.553441080+02:00 [watch]     stream timeout — reconnecting
...
backup-controller-5695469464-88g7h backup-controller 2026-04-16T21:35:54.960646605+02:00 [reconcile] complete — 6 valid, 0 skipped, 0 conflicts
The entire reconcile cycle — stream timeout through all 6 PVCs to complete — ran in about 400ms. That's the value of --timestamps: same output, but now you know it's fast.
Something that looked alarming
While watching kube-system with --since 1h, warnings started scrolling:
stern -n kube-system . --include "2379" --since 15m --no-follow --color=never | sort -k4
kube-apiserver-rock1 kube-apiserver W0416 19:33:48.956699       1 logging.go:55] [core] [Channel #310862 SubChannel #310863]grpc: addrConn.createTransport failed to connect to {Addr: "127.0.0.1:2379", ServerName: "127.0.0.1:2379", BalancerAttributes: {"<%!p(pickfirstleaf.managedByPickfirstKeyType={})>": "<%!p(bool=true)>" }}. Err: connection error: desc = "transport: Error while dialing: dial tcp 127.0.0.1:2379: operation was canceled"
kube-apiserver-rock2 kube-apiserver W0416 19:34:32.417890       1 logging.go:55] [core] [Channel #311349 SubChannel #311350]grpc: addrConn.createTransport failed to connect to {Addr: "127.0.0.1:2379", ...}}. Err: connection error: desc = "transport: Error while dialing: dial tcp 127.0.0.1:2379: operation was canceled"
kube-apiserver-rock3 kube-apiserver W0416 19:34:38.140445       1 logging.go:55] [core] [Channel #311135 SubChannel #311136]grpc: addrConn.createTransport failed to connect to {Addr: "127.0.0.1:2379", ...}}. Err: connection error: desc = "transport: Error while dialing: dial tcp 127.0.0.1:2379: operation was canceled"
kube-apiserver-rock1 kube-apiserver W0416 19:34:48.947273       1 ...operation was canceled"
# ... repeats every 60 seconds across all three nodes
Three control plane nodes, all logging etcd connection failures, every minute on the minute. The garbled <%!p(pickfirstleaf.managedByPickfirstKeyType={})> attribute names, the word failed, the word error — it reads like something is broken.
The | sort -k4 is what revealed the pattern. Without it, the lines arrive in pod order and the 60-second cycle is invisible. With it, the staggered timestamps line up: rock1 at :48, rock2 at :32, rock3 at :38 — every minute, consistently.
Note that the sort key depends on whether --timestamps is used. Without timestamps, the log content starts at field 3, so sort -k3. With --timestamps, the timestamp becomes field 3 and the log content shifts to field 4, so sort -k4. Custom output templates will shift the fields again and need their own key.
A direct check confirmed the cluster was fine:
talosctl -n 10.0.140.10 etcd members
NODE          ID                 HOSTNAME   PEER URLS                  CLIENT URLS                LEARNER
10.0.140.10   2ff82aca0cb3d292   rock1      https://10.0.140.11:2380   https://10.0.140.11:2379   false
10.0.140.10   57948e82e9b5c6df   rock2      https://10.0.140.12:2380   https://10.0.140.12:2379   false
10.0.140.10   6d91994a8764ca38   rock3      https://10.0.140.13:2380   https://10.0.140.13:2379   false
talosctl -n 10.0.140.10 etcd alarm list
All three etcd members healthy, no alarms. The etcd logs themselves showed compaction completing every 5 minutes and hash checks succeeding across all three peers. The API server warnings are gRPC connection pool churn — often benign, but worth verifying against etcd health as I did. The connection is cancelled and retried as part of normal pool maintenance, not because etcd is unreachable.
Stern is good at surfacing things worth looking at. It doesn't tell you whether they matter — that requires a second step.
Reconstructing a PVC resize
A Helm upgrade had changed the Prometheus PVC from 30Gi to 40Gi. The next day, I wanted to see what had actually happened. Filtering by PVC ID across the whole longhorn-system namespace, sorted by timestamp:
stern -n longhorn-system . --timestamps --color=never --since 35h \
  --exclude "(serviceaccount|Go-http-client)" \
  --include "pvc-6f155b3a-769d-49da-aa21-e61a073aa82a" \
  --no-follow | sort -k3
Without the sort this sequence is invisible — five different pod types dump their logs in pod order. The sort turns it into a readable story.
14:30:01 — Scheduled backup fires on schedule (not triggered by the resize)
instance-manager-17f 14:30:01 msg="Snapshotting volume: snapshot backup-m-8b576b50..."
instance-manager-17f 14:30:01 msg="Starting to snapshot:... Labels map[RecurringJob:backup-monitoring-prometheus-server]"
The 14:30 scheduled backup happened to be running when the resize was requested. Longhorn typically queues the resize until the backup completes — so the resize queued behind it.
14:30:10 — Incremental backup uploads to Garage S3
instance-manager-195 14:30:10 Backing up snapshot backup-m-8b576b50... to backup backup-32d7fa9e91b44b56
instance-manager-23f 14:30:13 Generated snapshot changed blocks config, backup_type=incremental
instance-manager-23f 14:30:37 423 mappings, 423 blocks and 417 new blocks
Within 30 seconds after the snapshot, the backup uploads to Garage. This is an incremental backup — only 417 of 423 blocks changed since the previous run. Longhorn does not copy the full volume each time.
14:30:57 — Helm upgrade triggers resize; Kubernetes restarts the pod
longhorn-manager-mb4hd 14:30:57 Expanding volume from size 32212254720 to size 42949672960
longhorn-csi-plugin-lhltz 14:30:58 NodeUnpublishVolume... target_path: .../pods/2ed9deef.../mount
longhorn-csi-plugin-lhltz 14:30:58 NodePublishVolume... pod.name: prometheus-server-5dc96857dd-84q84
Kubernetes detected the PVC spec change and restarted the Prometheus pod — unmounting the volume from the old pod instance and remounting it on a new one. The different pod UIDs in those two lines confirm the restart. Nothing in the logs says "a Helm upgrade triggered this" — you only know that because you did it.
14:31:00 — Backup complete, both replicas expand simultaneously
instance-manager-2b 14:31:00 Replica server starts to expand to size 42949672960
instance-manager-23 14:31:00 Replica server starts to expand to size 42949672960
instance-manager-17 14:31:00 Controller succeeded to expand from size 32212254720 to 42949672960
Both replicas expand in parallel, not sequentially. The controller confirms success once both are done.
14:31:35 — Filesystem resized on the node
longhorn-csi-plugin-lhltz 14:31:35 Volume pvc-6f155b3a on node rock1 successfully resized filesystem after mount
Expanding the block device is not enough — the filesystem inside it also needs to grow. Longhorn handles this automatically via NodeExpandVolume. No manual resize2fs needed.
14:35:50 — Retention policy removes the oldest backup
longhorn-manager-dvspp 14:35:50 Complete deleting backup s3://longhorn-backups@garage/?backup=backup-cad605e0d4e34089
Four minutes after the resize, Longhorn enforces retain=8 — the oldest backup is deleted from Garage to keep the count at 8. The full cycle, from scheduled backup through resize to retention cleanup, took just under six minutes.
Watching the whole cluster
For a live view of everything:
stern -A . --color=never --since 1s --timestamps --max-log-requests 200
Without --max-log-requests 200, stern hits its default 50-stream limit and stops. With it, it opens streams to every container across all namespaces — 140+ on Bletchley. The + flood at startup is essentially a full cluster inventory.
--since 1s means almost no backlog to drain. The stream settles after 20–30 seconds as the API rate-limiting works through the queue of stream requests. A reliable way to know it's settled: Forgejo's healthcheck fires every 10 seconds like clockwork. Once you see it repeating, stern is live.
This is also how I found a recurring error in the CSI snapshotter — Failed to watch VolumeSnapshotClass: the server could not find the requested resource. The snapshotter is looking for a CRD that isn't installed on the cluster. It doesn't affect Longhorn's own snapshot and backup machinery, which works independently. Stern surfaced it without anyone looking for it.
Stern in the observability stack
Stern sits in a specific gap between kubectl logs and Loki:
| Tool | Scope | Persistent? | Best for |
|---|---|---|---|
kubectl logs |
One pod | No | Quick single-pod check |
| stern | Many pods, live | No | Real-time multi-pod investigation |
| k9s log view | One pod at a time | No | Interactive cluster browsing |
| Loki + Grafana | All pods | Yes | Historical queries, dashboards, alerts |
Stern and Loki are not alternatives. Stern is for now — watching something happen, investigating a problem live, confirming a deployment is behaving. Loki is for later — querying what happened last Tuesday, building dashboards, triggering alerts. Once Loki is running, both will be in use.
What was actually found
After an evening with stern, the only actionable item was a Traefik version bump from 3.6.11 to 3.6.13. Everything else — etcd gRPC warnings, Longhorn scrape errors, the CSI snapshotter CRD miss — turned out to be noise or low-priority findings on a cluster that's otherwise running well.
That's a fine result. A healthy cluster looks healthy in the logs.
← Previous: Closing the Backup Loop
Questions or suggestions? Leave a comment below or reach out at igor@vluwte.nl.