Longhorn Disk Alerting: Getting the Signal Right
Replacing misleading volume-level Longhorn alerts with disk-level rules, recalibrating snapshot overhead to 50%, and how an unrelated incident accidentally produced the baseline data needed.
Introduction
The Longhorn Snapshot Overhead post left the alerting picture deliberately incomplete. The volume-level alert rules — LonghornVolumeAlmostFull and LonghornVolumeCriticallyFull — had been in place since the monitoring setup, but that investigation exposed a fundamental problem with them: they measure actual_size / capacity, and a volume's actual_size routinely exceeds its nominal PVC size as snapshots accumulate. The alert fires on normal Longhorn behaviour, not on genuine disk pressure. The fix was clear — measure at the disk level — but that work was left for a follow-up.
This post closes that thread. The disk-level metrics longhorn_disk_usage_bytes, longhorn_disk_reservation_bytes, and longhorn_disk_capacity_bytes give a much cleaner picture of impending storage failure. The work also touched the Longhorn Grafana dashboard — several CPU and memory panels had been empty for a while, and fixing them turned into its own story, covered in the previous post. That detour had an unexpected side effect: it accidentally produced the snapshot overhead baseline data this post needed.
🏠 This is part of the Homelab Journey series - building a production Kubernetes cluster from scratch.
- Metrics Server on Talos: The Reboot That Broke Garage
- Longhorn Disk Alerting: Getting the Signal Right (you are here)
This post follows directly from Longhorn Snapshot Overhead: Why the Alerts Were Right and Wrong. That post identified the problem with the existing volume-level rules; this one resolves it.
What the Disk Metrics Actually Measure
Before building alert rules it's worth being clear on what each metric represents, because the semantics matter for what the expression is actually testing.
longhorn_disk_usage_bytes is the used storage on this disk. longhorn_disk_reservation_bytes is the storage reserved for other applications and the system. longhorn_disk_capacity_bytes is the storage capacity of this disk.
An important detail: reservation is static. It doesn't change as volumes are scheduled or deleted — it's the storageReserved value set explicitly per disk. Confirmed from the Longhorn v1.11.2 metrics docs and from the live data: all three 1TB NVMe nodes (rock5, rock6, rock7) show exactly the same reservation value, matching what was set during the NVMe upgrade.
This means the expression (usage + reservation) / capacity is really asking: "how much of the disk does Longhorn have access to, and how much of the space it can actually use is already consumed?" Since reservation is a constant offset, the alert will effectively fire when usage alone approaches capacity - reservation. That's exactly the right signal — it represents genuine disk pressure within the space Longhorn is permitted to operate in.
Why not just usage / capacity?
A simpler expression would be usage / capacity > threshold, ignoring reservation entirely. The problem is that reserved space is off-limits for new volume allocations — Longhorn won't schedule replicas into it. Ignoring reservation means the alert wouldn't fire until usage was consuming space that was never available for Longhorn workloads in the first place. Including reservation gives an accurate picture of headroom against the space Longhorn can actually use.
Baselining the Current Values
Before choosing thresholds, it's worth knowing where the cluster currently stands. All seven nodes queried on June 11, 2026:
| Node | Capacity | Usage | Reservation | Usage% | (U+R)% | Headroom |
|---|---|---|---|---|---|---|
| rock1 | 232.8 GiB | 10.6 GiB | 69.8 GiB | 4.6% | 34.6% | 152.3 GiB |
| rock2 | 232.8 GiB | 30.5 GiB | 69.8 GiB | 13.1% | 43.1% | 132.4 GiB |
| rock3 | 232.8 GiB | 10.6 GiB | 69.8 GiB | 4.6% | 34.6% | 152.3 GiB |
| rock4 | 232.8 GiB | 25.6 GiB | 69.8 GiB | 11.0% | 41.0% | 137.3 GiB |
| rock5 | 931.1 GiB | 17.9 GiB | 260.0 GiB | 1.9% | 29.8% | 653.2 GiB |
| rock6 | 931.1 GiB | 17.9 GiB | 260.0 GiB | 1.9% | 29.8% | 653.2 GiB |
| rock7 | 931.1 GiB | 17.9 GiB | 260.0 GiB | 1.9% | 29.8% | 653.2 GiB |
Maximum current (U+R)% is rock2 at 43.1%. The 500GB nodes (rock1–rock4) carry more proportional load than the 1TB nodes — rock2 in particular is noticeably busier than rock1 and rock3 despite identical hardware, which is worth investigating separately to understand what replicas are concentrated there.
With a maximum of 43.1%, a 75% warning threshold leaves about 32 percentage points of headroom before anything fires. At current usage rates that's a comfortable margin with meaningful advance notice. There's no compelling reason to tighten to 70%/85% — 75%/90% is defensible for a homelab with moderate growth rates.
Building the Disk-Level Alert Rules
The Longhorn alert rules live inside prometheus-values.yaml, managed via Helm. All changes — new disk rules, removal of the volume-level rules, and the snapshot overhead threshold update — went in as a single edit to keep the change coherent.
The complete Longhorn rule group is shown at the end of this post. The rules after this update:
# -- Longhorn Disks ---------------------------------------------------------
- alert: LonghornDiskAlmostFull
- alert: LonghornDiskCriticallyFull

# -- Longhorn Snapshot Overhead ---------------------------------------------
- alert: LonghornSnapshotOverhead

# -- Longhorn Volume Health -------------------------------------------------
- alert: LonghornVolumeDegraded
- alert: LonghornVolumeFaulted

# -- PVC Filesystem Usage ---------------------------------------------------
- alert: PVCAlmostFull
- alert: PVCCriticallyFull
One thing worth verifying before deploying: the metric label names. longhorn_disk_usage_bytes, longhorn_disk_reservation_bytes, and longhorn_disk_capacity_bytes all carry the same label set, which means the expression joins cleanly without any extra work. Both node and exported_node are present and identical (node="rock5", exported_node="rock5"), so $labels.node in the annotation resolves correctly. No join required. The disk label is also present in a format that's useful in notifications — nvme-disk-rock5, default-disk-1030100000000 — so the description template will identify both the node and the specific disk.
Removing the Volume-Level Rules
LonghornVolumeAlmostFull and LonghornVolumeCriticallyFull both used longhorn_volume_actual_size_bytes / longhorn_volume_capacity_bytes as their signal. This is not a reliable indicator of disk pressure for a straightforward reason: actual_size counts all blocks across the volume head and the entire snapshot chain, so it grows as snapshots accumulate regardless of how much live data the application has written. The fstrim post and the snapshot overhead post both touched on this — actual_size can exceed the nominal PVC capacity entirely in a high-snapshot-churn workload like prometheus-server. An alert that fired when actual_size / capacity exceeded 80% fired on normal Longhorn operation, not on a storage emergency.
The disk-level rules replace them entirely. There was no value in keeping the volume-level rules alongside the new ones — they measure different things and the volume-level signal is the misleading one. Both rules were removed in the same configuration edit that added the disk-level rules.
Recalibrating the Snapshot Overhead Threshold
The LonghornSnapshotOverhead rule was added during the previous investigation at a 15% threshold, which immediately started firing on prometheus-server and loki as their snapshot chains were recovering. That threshold was a placeholder — the right number required knowing what "settled normal" actually looks like for a high-churn volume.
The plan was to get that data by deliberately deleting all snapshots on prometheus-server and letting the backup job rebuild from scratch. The incident documented in Metrics Server on Talos: The Reboot That Broke Garage made that unnecessary in the most roundabout way possible. A reboot sequence during the metrics-server work caused Garage's node ID to revert, which made Longhorn's backup target unavailable for about 16 hours. All recurring backup jobs failed silently during that window. When backups resumed, prometheus-server's next backup showed SIZE dropping from 16.99 GiB to 7.35 GiB. It has remained stable at that level since, which gives enough confidence to treat ~16.5% as the current baseline.
That 7.35 GiB figure, combined with the earlier overhead reading of 47.2% when SIZE was around 21 GiB, gives an estimated PVC capacity of about 44.5 GiB. The settled overhead at 7.35 GiB:
7.35 / 44.5 ≈ 16.5%
With a settled normal at 16.5%, a 50% threshold gives roughly 33 percentage points of headroom before the alert fires. The threshold is now a policy decision rather than a calibration problem: a volume provisioned at 30 GiB shouldn't routinely consume more than 45 GiB on disk. At 50% overhead that's where it would fire, and the disk-level alert provides the safety net if that overhead is actually threatening disk capacity. The two rules work together.
The 50% threshold is the right starting point for now, but it may need revisiting. The plan is to increase prometheus-server's retention beyond the current 20 days once the volume has stabilised — more data stored means larger snapshots, which will push the overhead percentage higher. Whether 50% still gives adequate headroom at that point is something to monitor rather than assume.
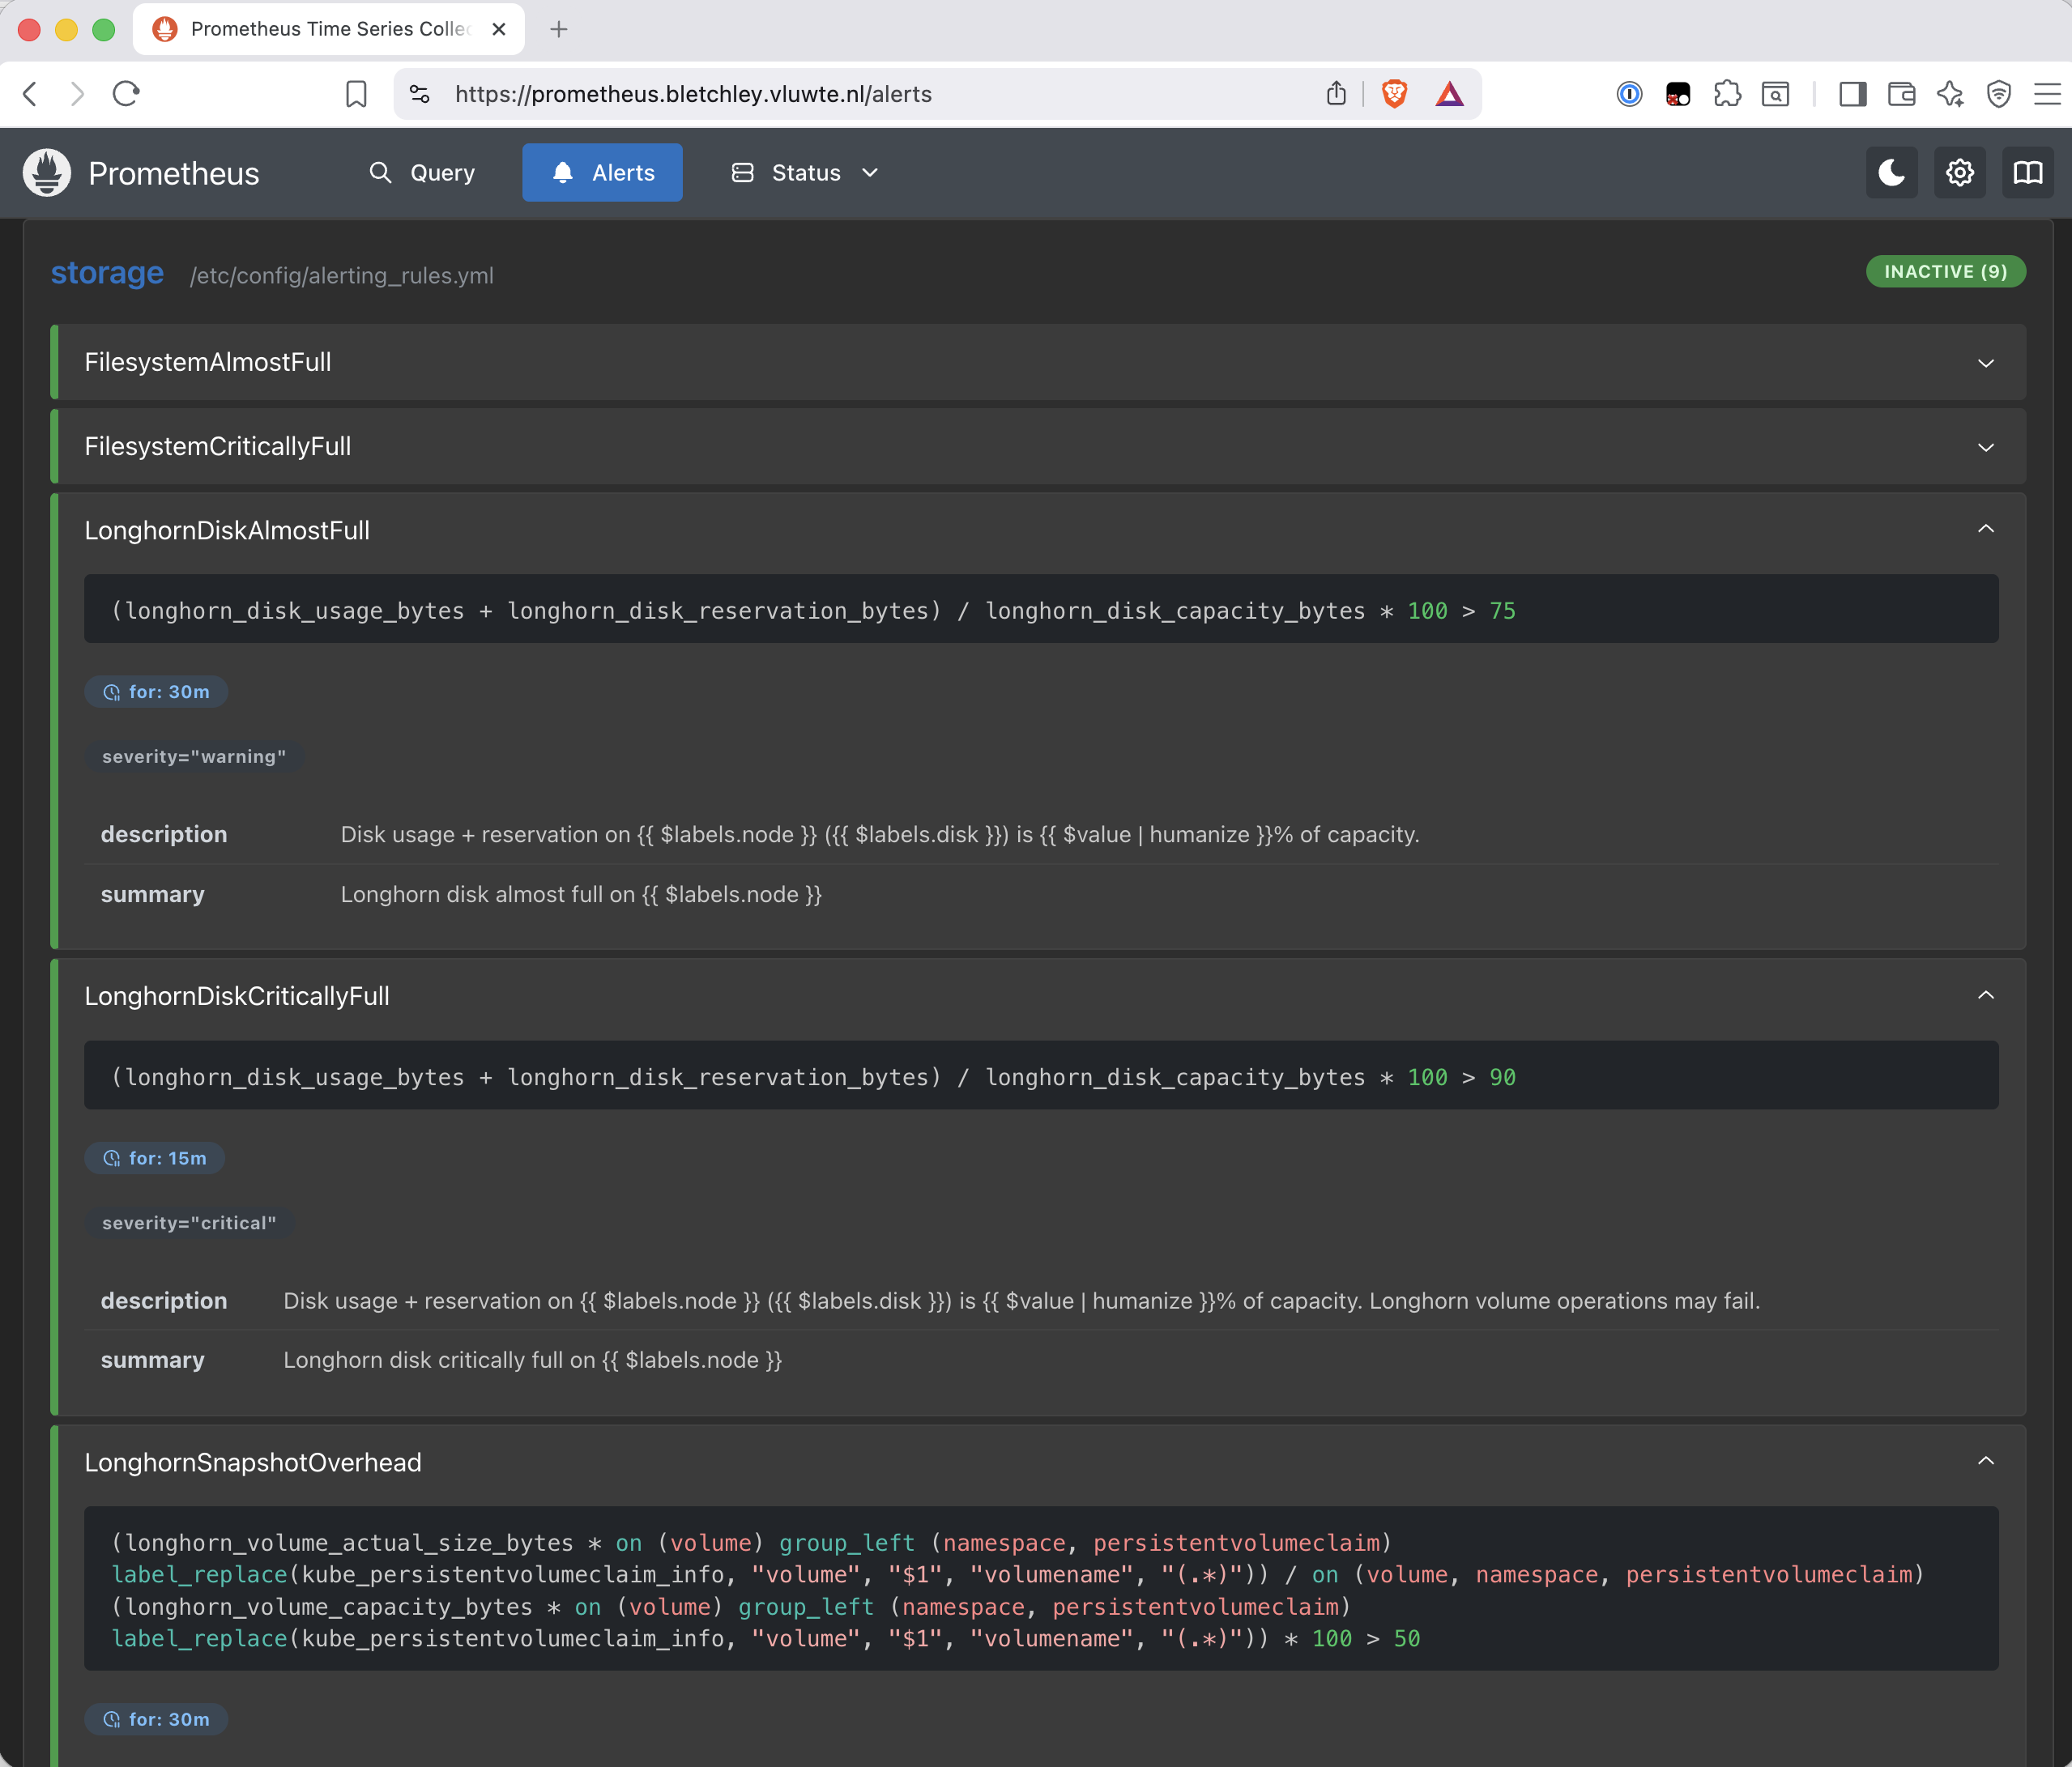
The updated LonghornSnapshotOverhead rule with the 50% threshold is visible in the screenshot above, including the full label_replace join expression that maps volume UIDs to human-readable namespace/PVC names in alert notifications.
Verifying the Deployed Rules
After deploying via helm upgrade, the expression browser is the practical way to verify disk-level rules without being able to easily trigger a disk full condition in a homelab.
Querying the LonghornDiskAlmostFull expression directly:
(longhorn_disk_usage_bytes + longhorn_disk_reservation_bytes) / longhorn_disk_capacity_bytes * 100 > 75
Returns values for all seven nodes, with rock2 highest at 42.6% and the three 1TB nodes at 29.8% — slightly lower than the June 11 baseline table (43.1% on rock2) as expected given the one-day gap, and comfortably below both thresholds. The rule is evaluating correctly.
The LonghornSnapshotOverhead query with the 50% threshold confirms all volumes are below it, with prometheus-server at 47.2% being the closest. That 47.2% reading is from before the backup gap incident — the settled value afterward is 16.5%. Watching that converge over the next few backup cycles will confirm the threshold is behaving as expected.
The Prometheus alerts page shows INACTIVE (9) — all nine rules in the storage group loaded without errors and none are currently firing. The old volume-level rules are gone.
What's Working Now
- ✅
LonghornDiskAlmostFull(>75%, 30m) andLonghornDiskCriticallyFull(>90%, 15m) deployed and verified against all 7 nodes — maximum current (U+R)% is 42.6% on rock2, well within bounds - ✅
LonghornVolumeAlmostFullandLonghornVolumeCriticallyFullremoved — confirmed gone from Prometheus alerts page, decision documented in the decisions log - ✅
LonghornSnapshotOverheadthreshold raised from 15% to 50%, settled prometheus-server overhead now ~16.5% — threshold won't be noisy under normal operation - ⚠️ Known gap: no monitoring yet for Garage role status, OpenBao seal status, or Longhorn backup target availability — surfaced by the incident during the metrics-server work, tracked separately
← Previous: Metrics Server on Talos
Questions or suggestions? Leave a comment below or reach out at igor@vluwte.nl.
Appendix: Complete Longhorn Alert Rule Group
The full rule group as deployed in prometheus-values.yaml:
# -- Longhorn Disks ---------------------------------------------------------
# Measures actual disk pressure per node: replica data written (usage) plus
# space Longhorn will not allocate to volumes (reservation). Reservation is
# a static floor set per disk in the Longhorn UI — it does not change with
# volume scheduling. A volume's actual_size can exceed its nominal PVC size
# due to snapshots, so disk-level alerting is the authoritative signal for
# impending storage failure.
# Warning >75% for 30m, critical >90% for 15m.

- alert: LonghornDiskAlmostFull
  expr: |
    (longhorn_disk_usage_bytes + longhorn_disk_reservation_bytes)
    / longhorn_disk_capacity_bytes * 100 > 75
  for: 30m
  labels:
    severity: warning
  annotations:
    summary: "Longhorn disk almost full on {{ $labels.node }}"
    description: >
      Disk usage + reservation on {{ $labels.node }} ({{ $labels.disk }})
      is {{ $value | humanize }}% of capacity.

- alert: LonghornDiskCriticallyFull
  expr: |
    (longhorn_disk_usage_bytes + longhorn_disk_reservation_bytes)
    / longhorn_disk_capacity_bytes * 100 > 90
  for: 15m
  labels:
    severity: critical
  annotations:
    summary: "Longhorn disk critically full on {{ $labels.node }}"
    description: >
      Disk usage + reservation on {{ $labels.node }} ({{ $labels.disk }})
      is {{ $value | humanize }}% of capacity.
      Longhorn volume operations may fail.

# -- Longhorn Snapshot Overhead ---------------------------------------------
# LonghornSnapshotOverhead — fires when Longhorn's reported allocation for a
# volume exceeds 50% of its provisioned capacity. Longhorn's actual_size counts
# all blocks across the volume head and snapshot chain, so it grows beyond the
# live filesystem size as snapshots accumulate. The 50% threshold is a policy
# ceiling: a volume provisioned at 30 GiB should not routinely consume more
# than 45 GiB on disk.
#
# Expression: actual_size / capacity * 100, joined with kube_persistentvolumeclaim_info
# to resolve volume UIDs to human-readable namespace/PVC names in notifications.
# Settled overhead for prometheus-server (high-churn TSDB workload) is ~16.5%,
# so 50% gives meaningful headroom before this fires under normal operation.
#
# Remediation: enable UnmapMarkSnapChainRemoved per-volume so the daily
# filesystem-trim job reclaims snapshot blocks automatically after each backup cycle.

- alert: LonghornSnapshotOverhead
  expr: |
    (
      longhorn_volume_actual_size_bytes
      * on(volume) group_left(namespace, persistentvolumeclaim)
      label_replace(kube_persistentvolumeclaim_info, "volume", "$1", "volumename", "(.*)")
    )
    / on(volume, namespace, persistentvolumeclaim)
    (
      longhorn_volume_capacity_bytes
      * on(volume) group_left(namespace, persistentvolumeclaim)
      label_replace(kube_persistentvolumeclaim_info, "volume", "$1", "volumename", "(.*)")
    )
    * 100 > 50
  for: 30m
  labels:
    severity: warning
  annotations:
    summary: "Longhorn snapshot overhead excessive on {{ $labels.persistentvolumeclaim }}"
    description: >
      Snapshot overhead on {{ $labels.namespace }}/{{ $labels.persistentvolumeclaim }}
      is {{ $value | humanize }}% of PVC capacity. Consider enabling
      UnmapMarkSnapChainRemoved or reviewing backup retention.

# -- Longhorn Volume Health -------------------------------------------------
# longhorn_volume_robustness encodes volume health as an integer:
# 0 = healthy, 1 = unknown, 2 = degraded, 3 = faulted.
# Degraded means one or more replicas are unavailable but the volume is still
# accessible. Faulted means the volume is inaccessible — data at risk,
# immediate action required.

- alert: LonghornVolumeDegraded
  expr: longhorn_volume_robustness == 2
  for: 5m
  labels:
    severity: warning
  annotations:
    summary: "Longhorn volume {{ $labels.pvc }} ({{ $labels.pvc_namespace }}) is degraded"

- alert: LonghornVolumeFaulted
  expr: longhorn_volume_robustness == 3
  for: 1m
  labels:
    severity: critical
  annotations:
    summary: "Longhorn volume {{ $labels.pvc }} ({{ $labels.pvc_namespace }}) is faulted"

# -- PVC Filesystem Usage ---------------------------------------------------
# kubelet_volume_stats measures actual filesystem usage inside the pod,
# complementing the disk-level Longhorn alerts which measure replica allocation
# at the node level. These two can diverge significantly — a PVC can be
# filesystem-full while disk-level pressure is low, and vice versa.
# Warning >80%, critical >90%.

- alert: PVCAlmostFull
  expr: >
    kubelet_volume_stats_used_bytes{job="kubernetes-nodes"}
    / kubelet_volume_stats_capacity_bytes{job="kubernetes-nodes"} > 0.80
  for: 30m
  labels:
    severity: warning
  annotations:
    summary: "PVC {{ $labels.persistentvolumeclaim }} almost full"
    description: >
      PVC {{ $labels.namespace }}/{{ $labels.persistentvolumeclaim }} filesystem
      usage is above 80% — currently {{ $value | humanizePercentage }}.

- alert: PVCCriticallyFull
  expr: >
    kubelet_volume_stats_used_bytes{job="kubernetes-nodes"}
    / kubelet_volume_stats_capacity_bytes{job="kubernetes-nodes"} > 0.90
  for: 15m
  labels:
    severity: critical
  annotations:
    summary: "PVC {{ $labels.persistentvolumeclaim }} critically full"
    description: >
      PVC {{ $labels.namespace }}/{{ $labels.persistentvolumeclaim }} filesystem
      usage is above 90% — currently {{ $value | humanizePercentage }}.