The Cost of Saying "I'm Still Here"
Control-plane eMMCs take 13–15 GB a day. Most of it is etcd recording twenty leases saying they're still alive, at about 22 KB a time.
Introduction
The previous post ended with a number that did not fit. Each control-plane eMMC on Bletchley takes 13 to 15 GB a day more writes than a worker's, and I had been blaming etcd. Once its metrics were finally in Prometheus, etcd's write-ahead log turned out to append about 0.6 GB a day. Roughly 4% of the gap. So what is writing the rest?
The short answer is still mostly etcd, but not because it writes a lot of data. It commits about five and a half small changes a second, each one around 1 KB, and each one is synced to disk before etcd moves on. On these nodes a synced 1 KB change corresponds to about 22 KB of device writes, and because Raft replicates every change, all three control-plane nodes pay that for every write in the cluster. About 80% of those writes are lease renewals: twenty leases, each renewed every two to ten seconds by something telling the cluster it is still there. The largest single source is the CloudNativePG stack, about a third of the renewals, where the backup plugin renews its lease as often as the operator does. And the kube-apiserver's audit log then writes many of those renewals down a second time.
The rest of this post is how I got there. It is really two questions: what is generating the writes, and why a 1 KB change ends up as about 22 KB on the device. The first comes down to leases. For the second, the day CloudNativePG was installed works as an experiment: it added a known number of lease renewals at known times, and the eMMC recorded what each one cost. Around that sit one filesystem, a subtraction that leaves the three control-plane nodes identical, and a worker and an oddly busy rock5 to find the baseline. Whether any of it should change is a separate question for a separate post.
🔬 This is part of the Technical Deep Dives series - technical concepts explained in depth.
- Wear Without Writes
- The Cost of Saying "I'm Still Here" (you are here)
This post uses the etcd metrics set up in Getting etcd's Metrics Out of Talos. All times are CEST, which is what Grafana shows; Kubernetes CronJob schedules are in UTC.
Three Things to Explain
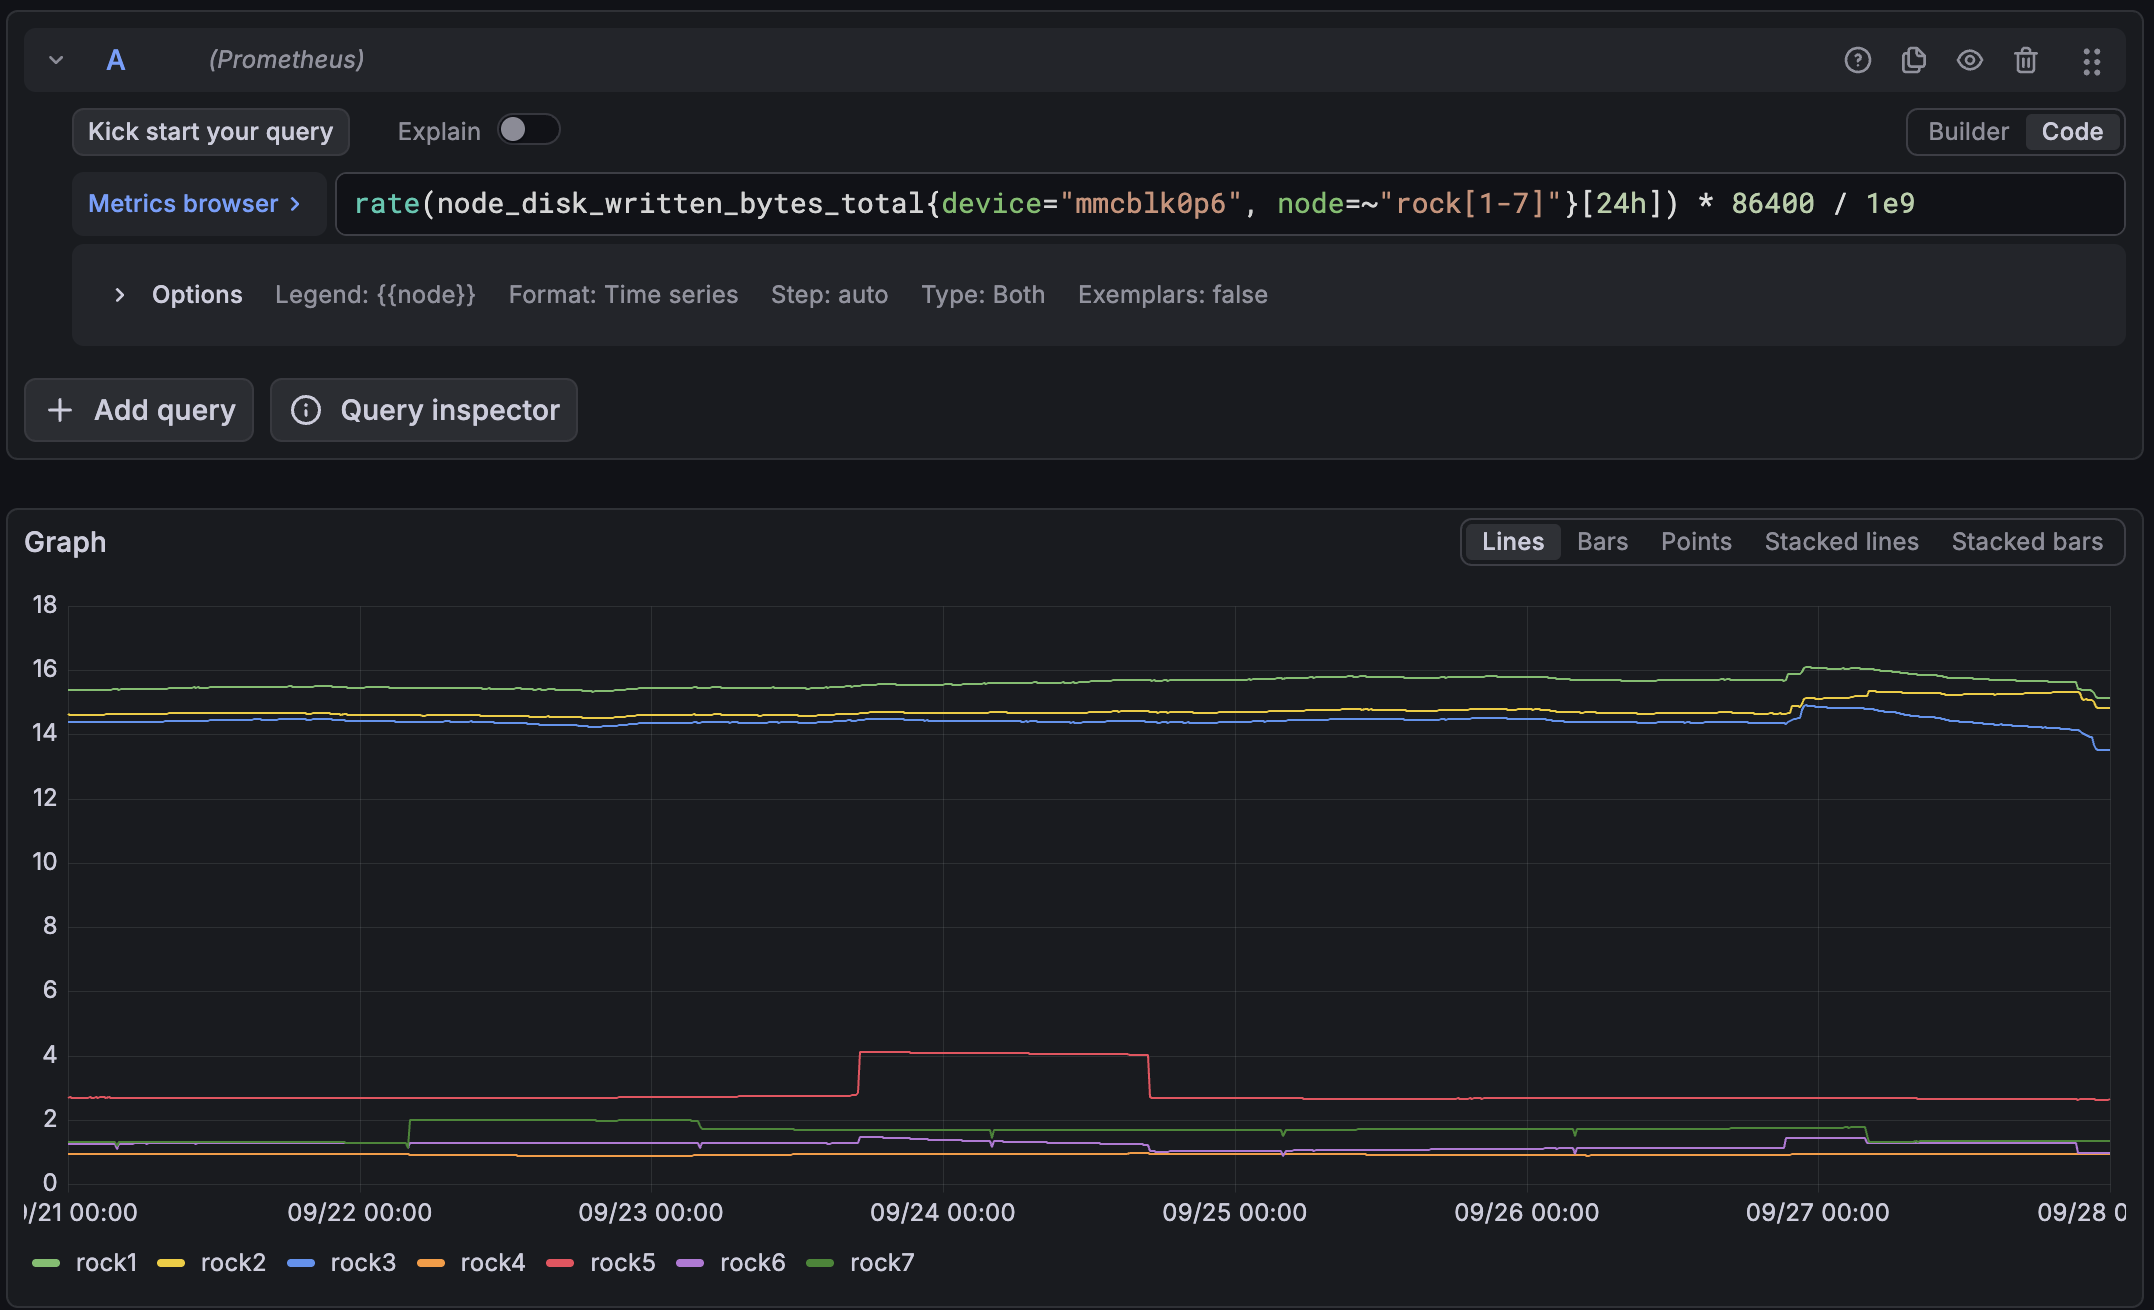
Every RK1 carries a 32 GB eMMC, soldered to the module. It holds Talos, and everything Talos keeps under /var: etcd, the container image store, kubelet's state and every container log. Per node, one week at the end of September:
| Node | Role | eMMC writes per day |
|---|---|---|
| rock1 | control plane | ~15.2 GB |
| rock2 | control plane | ~14.7 GB |
| rock3 | control plane | ~13.4 GB |
| rock4 | worker | ~0.95 GB |
| rock5 | worker | ~2.7 GB |
| rock6, rock7 | worker | ~1.1–1.7 GB |
That is roughly half the device every day on a control-plane node. rock1 had taken about 3.78 TB in 237 days when I first looked: about 118 complete writes of a 32 GB device.
So there are three questions:
- The control-plane excess. Why do rock1 to rock3 write 13 to 15 GB a day more than a worker?
- The worker baseline. What is the ~1 GB a day that every node writes?
- rock5. Why does one worker write nearly three times as much as the others?
One Filesystem
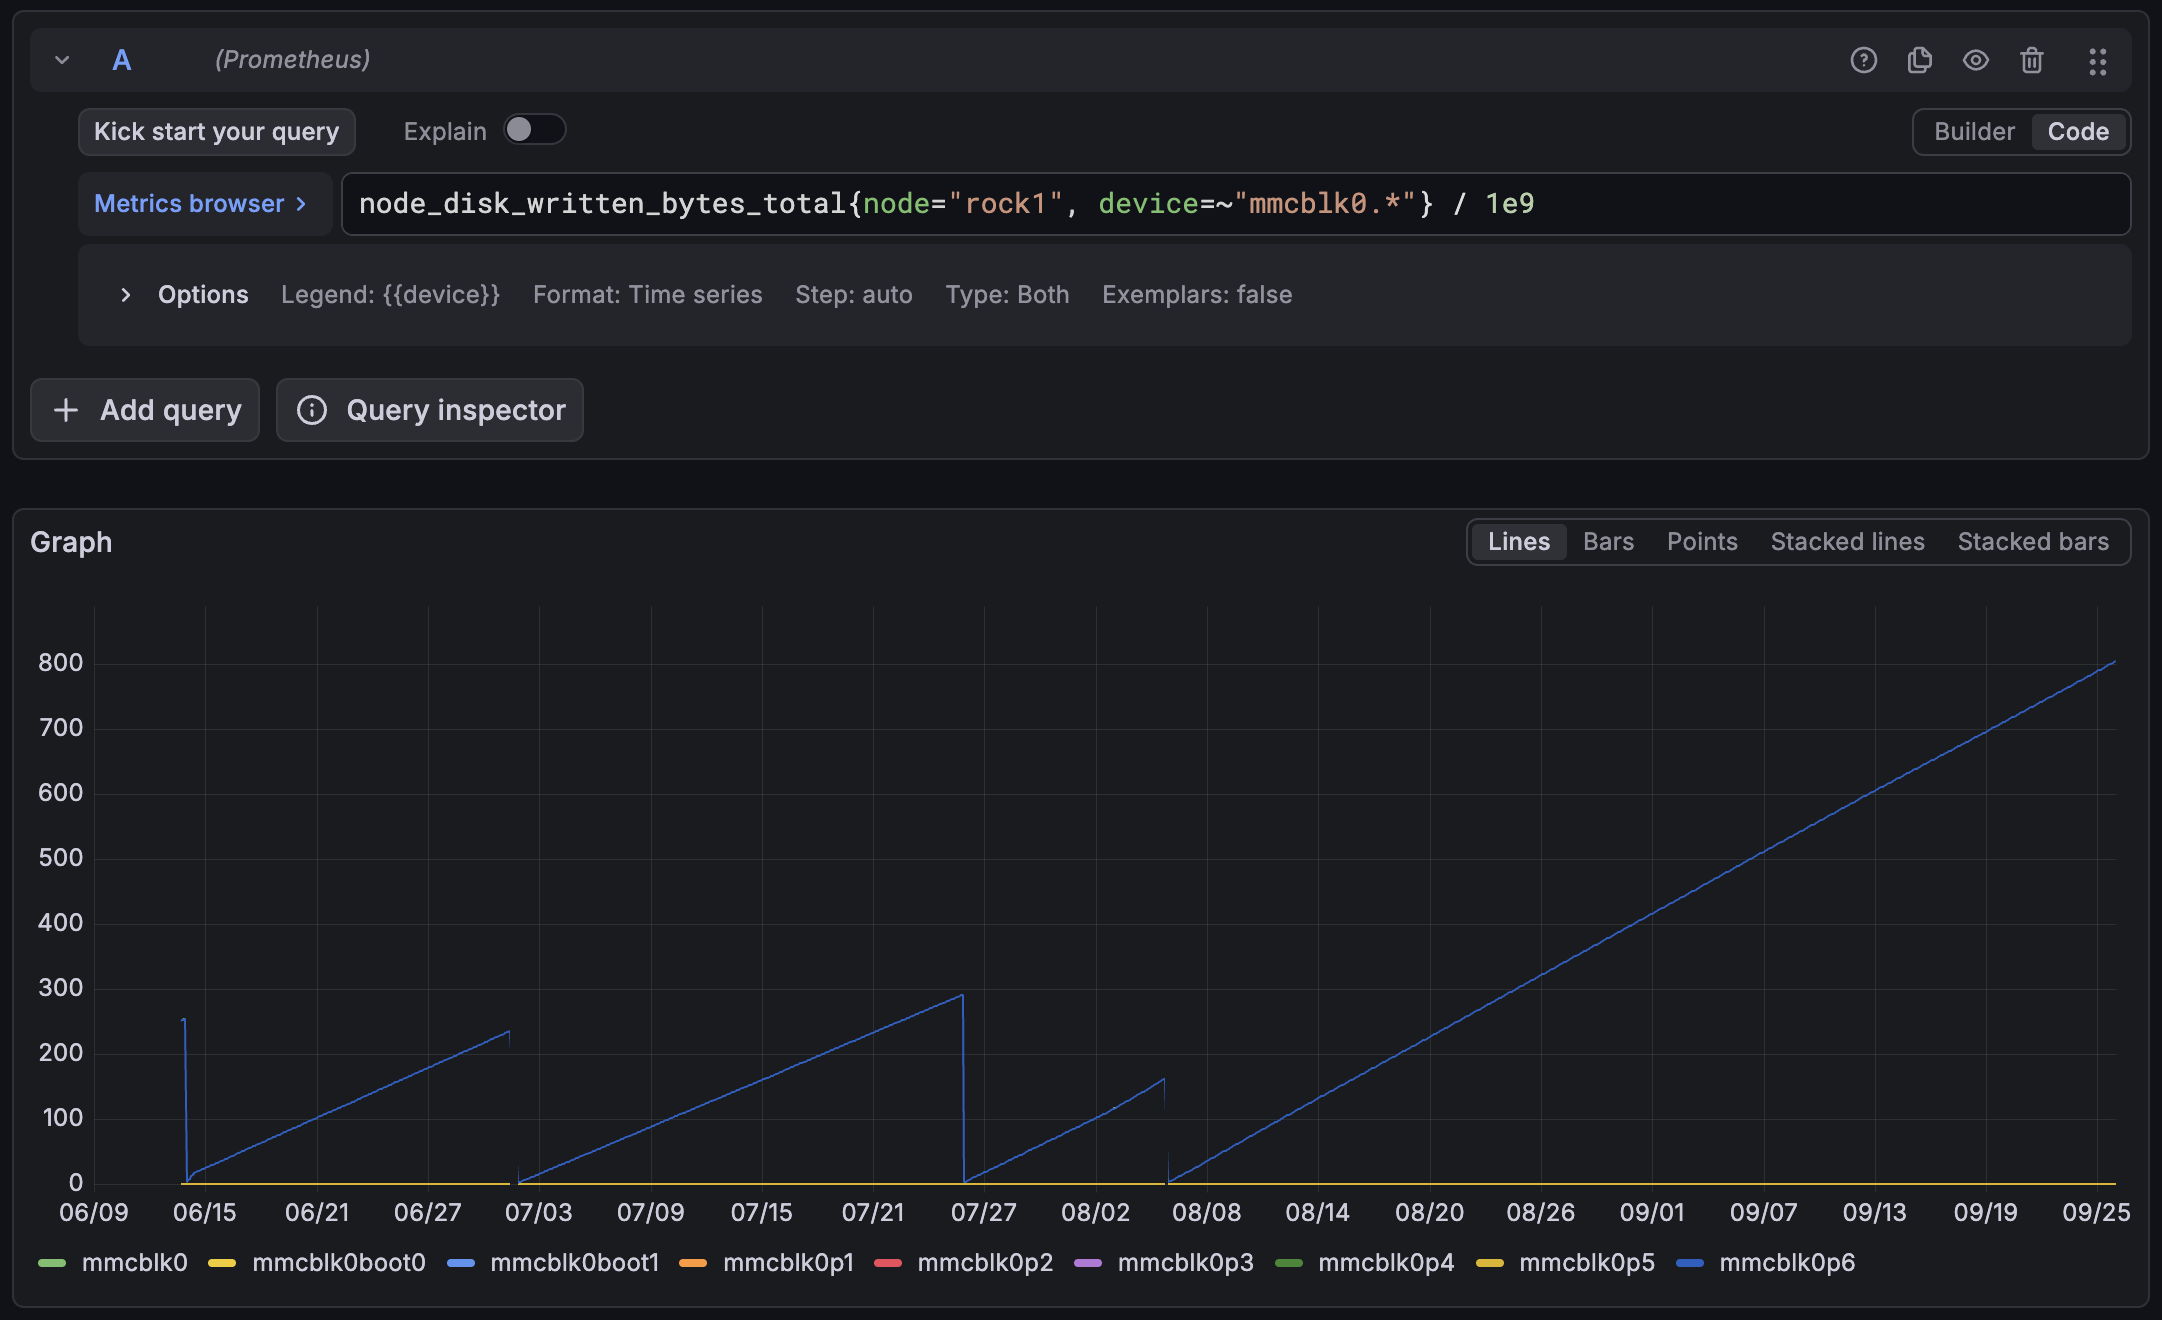
The eMMC is split into partitions, and node-exporter counts writes for each. The counters had been running since the 5 August power-cut reboot:
| Partition | What it is | rock1 (control plane) | rock4 (worker) |
|---|---|---|---|
mmcblk0 |
the whole device | ~818.87 GB | not recorded |
mmcblk0p6 |
EPHEMERAL, mounted at /var, XFS, 29 GB |
~818.86 GB | ~47.46 GB |
mmcblk0p5 |
STATE, Talos machine config, 105 MB | 4,273,664 B | 4,273,152 B |
| p1 to p4, boot0, boot1 | boot partitions | 0 | 0 |
Effectively everything lands on /var, on both roles. STATE differs between the two roles by 512 bytes, which is to say not at all, so it drops out. The question narrows to one filesystem, where etcd, kubelet, containerd and every log all live.
The WAL Is Small, and That Doesn't Clear etcd
The previous post's 0.6 GB a day is the number of bytes etcd appends to its write-ahead log. It is not the number of bytes the eMMC receives, and the difference is the whole story.
etcd does not buffer. Every change is appended to the log and fsynced, forced all the way to the device, before etcd acknowledges it. Then the change is applied to etcd's database file (bbolt), and that is committed and synced too. A sync of a few hundred bytes still rewrites at least a whole 4 KiB block, plus the XFS journal and metadata that describe it. Small writes, synced one at a time, can cost far more than their size. That is the likely mechanism; the counters I have show the total, not which layer adds which bytes.
The etcd metrics now in Prometheus show how many of these syncs happen. Per control-plane node, once things had settled:
| What | Query (rate or increase of) | Per hour | Per second |
|---|---|---|---|
eMMC writes on /var |
node_disk_written_bytes_total{device="mmcblk0p6"} |
~650 MB | |
| WAL fsyncs | etcd_disk_wal_fsync_duration_seconds_count |
~24,000 | ~6.7 |
| Database commits | etcd_disk_backend_commit_duration_seconds_count |
~20,000 | ~5.6 |
| WAL bytes appended | etcd_disk_wal_write_bytes_total |
~24 MB |
Divide the WAL bytes by the fsyncs and each change carries about 1 KB. Divide the device writes by the fsyncs and each one costs about 27 KB on the eMMC. That ratio, roughly twenty-something to one, would explain most of the gap.
But that division assumes its own conclusion. It charges every byte on /var to etcd, everything else that writes there included, which is the thing I am trying to prove. So 27 KB is an upper bound, not a price. A price needs a moment where I know how many new etcd writes appeared and can watch what the device did, and that comes two sections down.
Every member pays for every write. etcd uses Raft: a change is only committed once a majority of members have written it to their own log. In practice all three append, fsync and apply every entry. The leader's extra work is sending entries to the followers, which is network, not disk. The fsync and commit rates in Prometheus are the same on all three nodes, and rock1, the node that writes the most, was not the leader at the time. So whichever apiserver a client talks to, the cost of its write lands on all three eMMCs.
The tool that looked like the answer. Linux keeps per-process I/O counters in /proc/<pid>/io, and talosctl read will serve them. Over five minutes, etcd's write_bytes on rock1 grew by 704 MB. The entire partition received about 50 MB in the same window. Whatever that counter represents at this layer, it cannot be read as bytes reaching this eMMC, so per-process numbers were out and the cost per write had to come from somewhere else.
What etcd Is Writing: Leases
Before asking what each write costs, it helps to know what the writes are. The kube-apiserver counts its own requests to etcd, by resource and operation, without any scrape job:
kubectl get --raw /metrics \
  | grep -E '^etcd_request(s_total|_duration_seconds_count)' \
  | grep -E 'operation="(create|update|delete)"' \
  | sort -t' ' -k2 -g | tail -20
These are cumulative counts since that apiserver started, from one apiserver only, so the shares mean something and the absolute numbers do not:
| Resource | Share of writes |
|---|---|
leases (update) |
~82% |
| apiserver IP info | ~9% |
| events | ~4% |
| pods | ~3% |
| daemonsets, nodes | ~2% |
The pods and daemonsets were inflated by the drains and reboots earlier that evening. On a quiet day leases would dominate even more.
A lease is a small Kubernetes object that says "I hold this, until this time". Controllers use them for leader election: only one replica of a controller acts at a time, and it proves it is still alive by renewing its lease every few seconds. Nodes use them as heartbeats. Each renewal is an update, and every update is an etcd write.
To see whose leases they are, I watched every lease in the cluster for one minute and counted the updates:
timeout 60 kubectl get leases -A --watch-only --no-headers \
  -o custom-columns=NS:.metadata.namespace,NAME:.metadata.name \
  | sort | uniq -c | sort -rn
| Source | Leases | Renewals per minute | Share |
|---|---|---|---|
| CloudNativePG | operator, Barman Cloud plugin, bletchley-pg cluster |
89 | 34% |
| kube-scheduler and kube-controller-manager | 2 | 60 | 23% |
| Longhorn CSI sidecars | 4 | 48 | 18% |
| Node heartbeats | 7, one per node | 41 | 16% |
| kube-apiserver identity | 3 | 17 | 6% |
| cert-manager | 2 | 8 | 3% |
| Total | 20 | 263, about 4.4 a second |
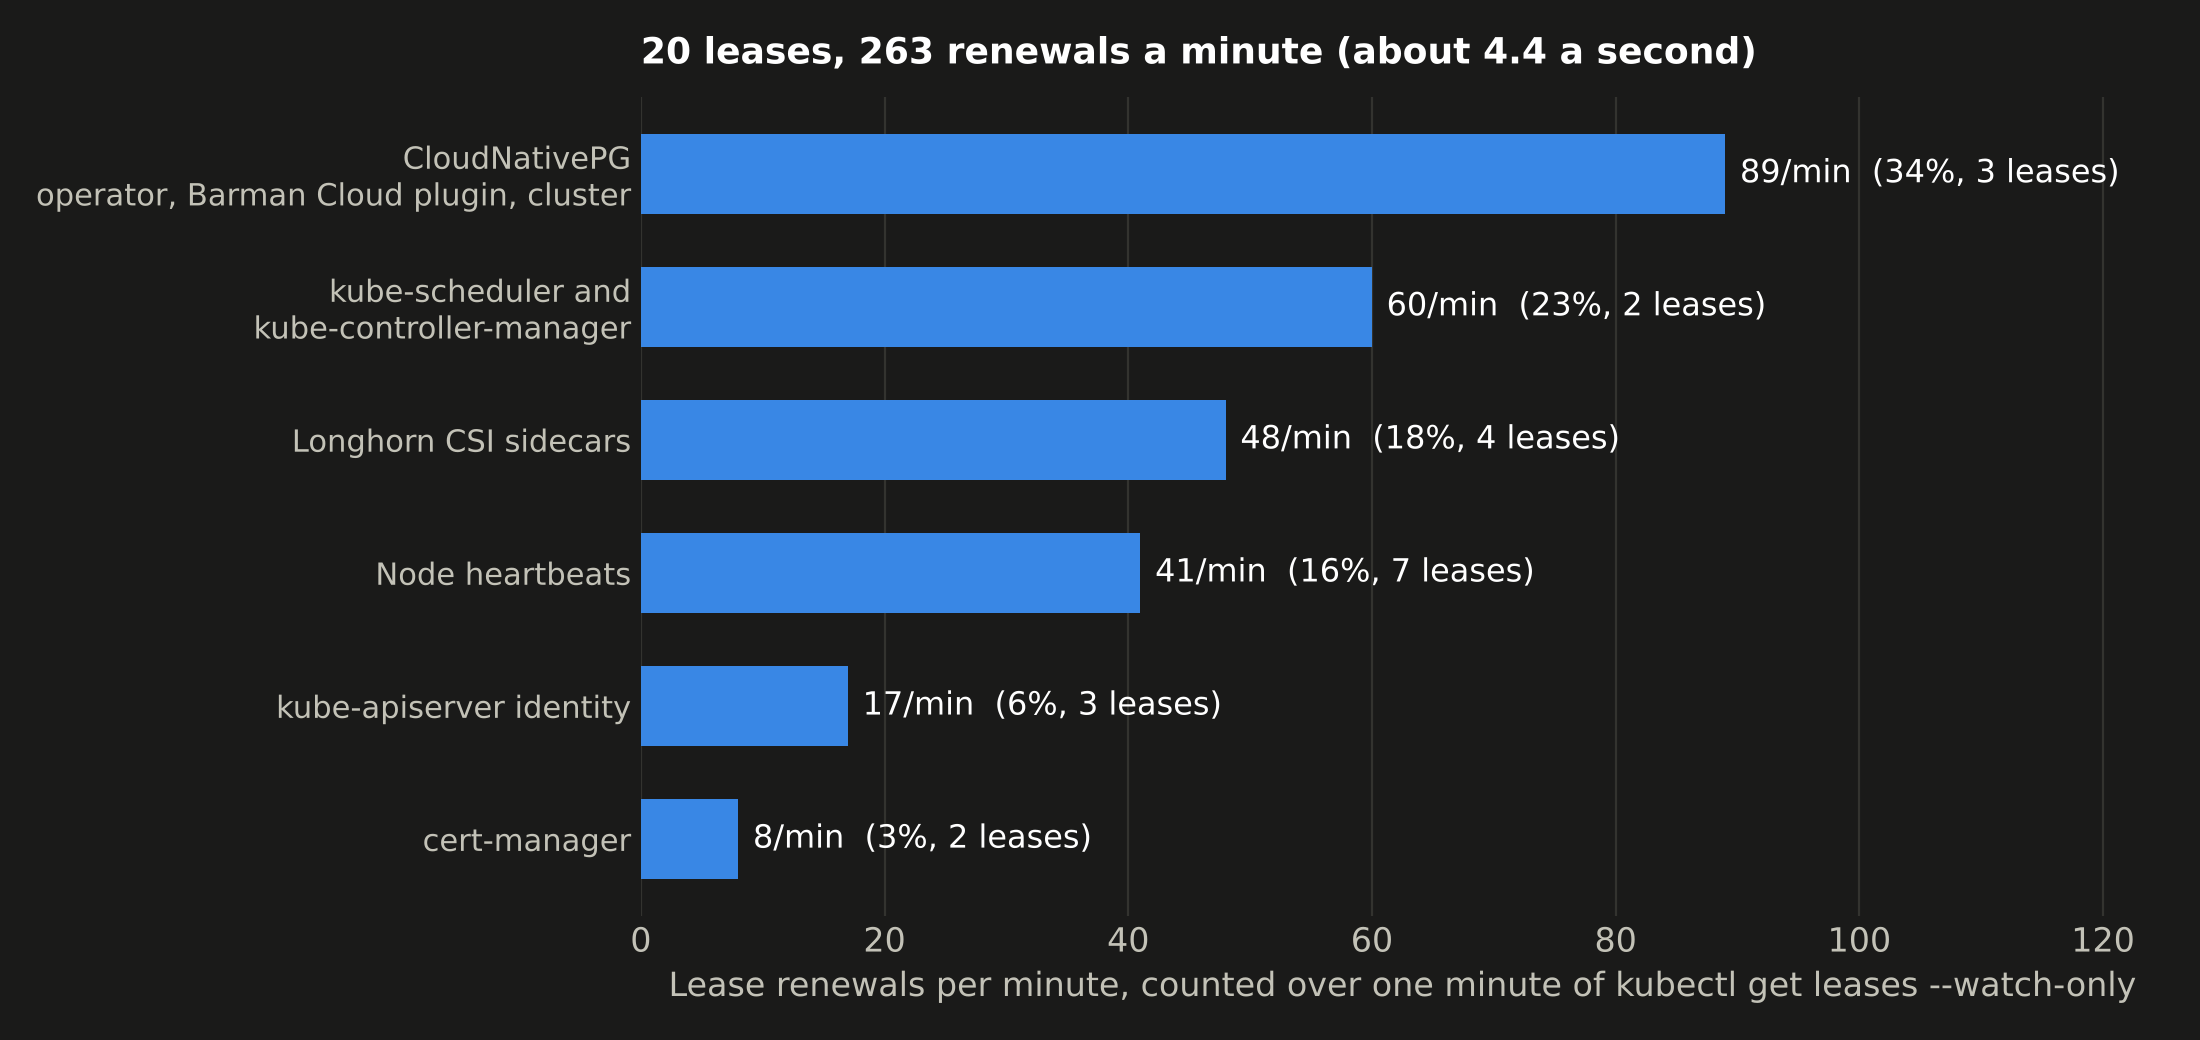
The renewal interval depends on the component. Leader-election leases are renewed about every 2 seconds (CloudNativePG, the scheduler and the controller-manager), the Longhorn CSI sidecars every 5, node and apiserver leases every 10, cert-manager every 15.
The cross-check is simple: 263 renewals a minute is about 4.4 a second, against about 5.6 database commits a second. Roughly four-fifths of etcd's commits are lease renewals, the same share the apiserver's own write counts showed. The remaining one or so commit a second is everything else: events, pod status, the apiserver's own records.
Two things about this list surprised me. First, only the current leader renews a leader-election lease, so the count does not grow with replicas. It grows with the number of controllers. Second, the three CloudNativePG leases:
| Lease | Held by | What it is |
|---|---|---|
db9c8771.cnpg.io |
the CloudNativePG operator | operator leader election |
822e3f5c.cnpg.io |
the Barman Cloud plugin | the backup plugin's own leader election |
bletchley-pg (namespace databases) |
the Postgres cluster | instance manager and primary |
All three use a 15-second lease renewed every 2 seconds. The backup plugin, which I installed in CloudNativePG Part 3 as a sidecar concern, writes to etcd exactly as often as the operator.
The Day CloudNativePG Arrived
The three CloudNativePG leases did not exist before 2 August. That makes the day CloudNativePG was installed a natural experiment: a known number of new lease writes, added at a known time. If etcd's writes really cost twenty-something KB each on the eMMC, the control-plane eMMCs should have stepped up that afternoon, all three by the same amount.
They did.
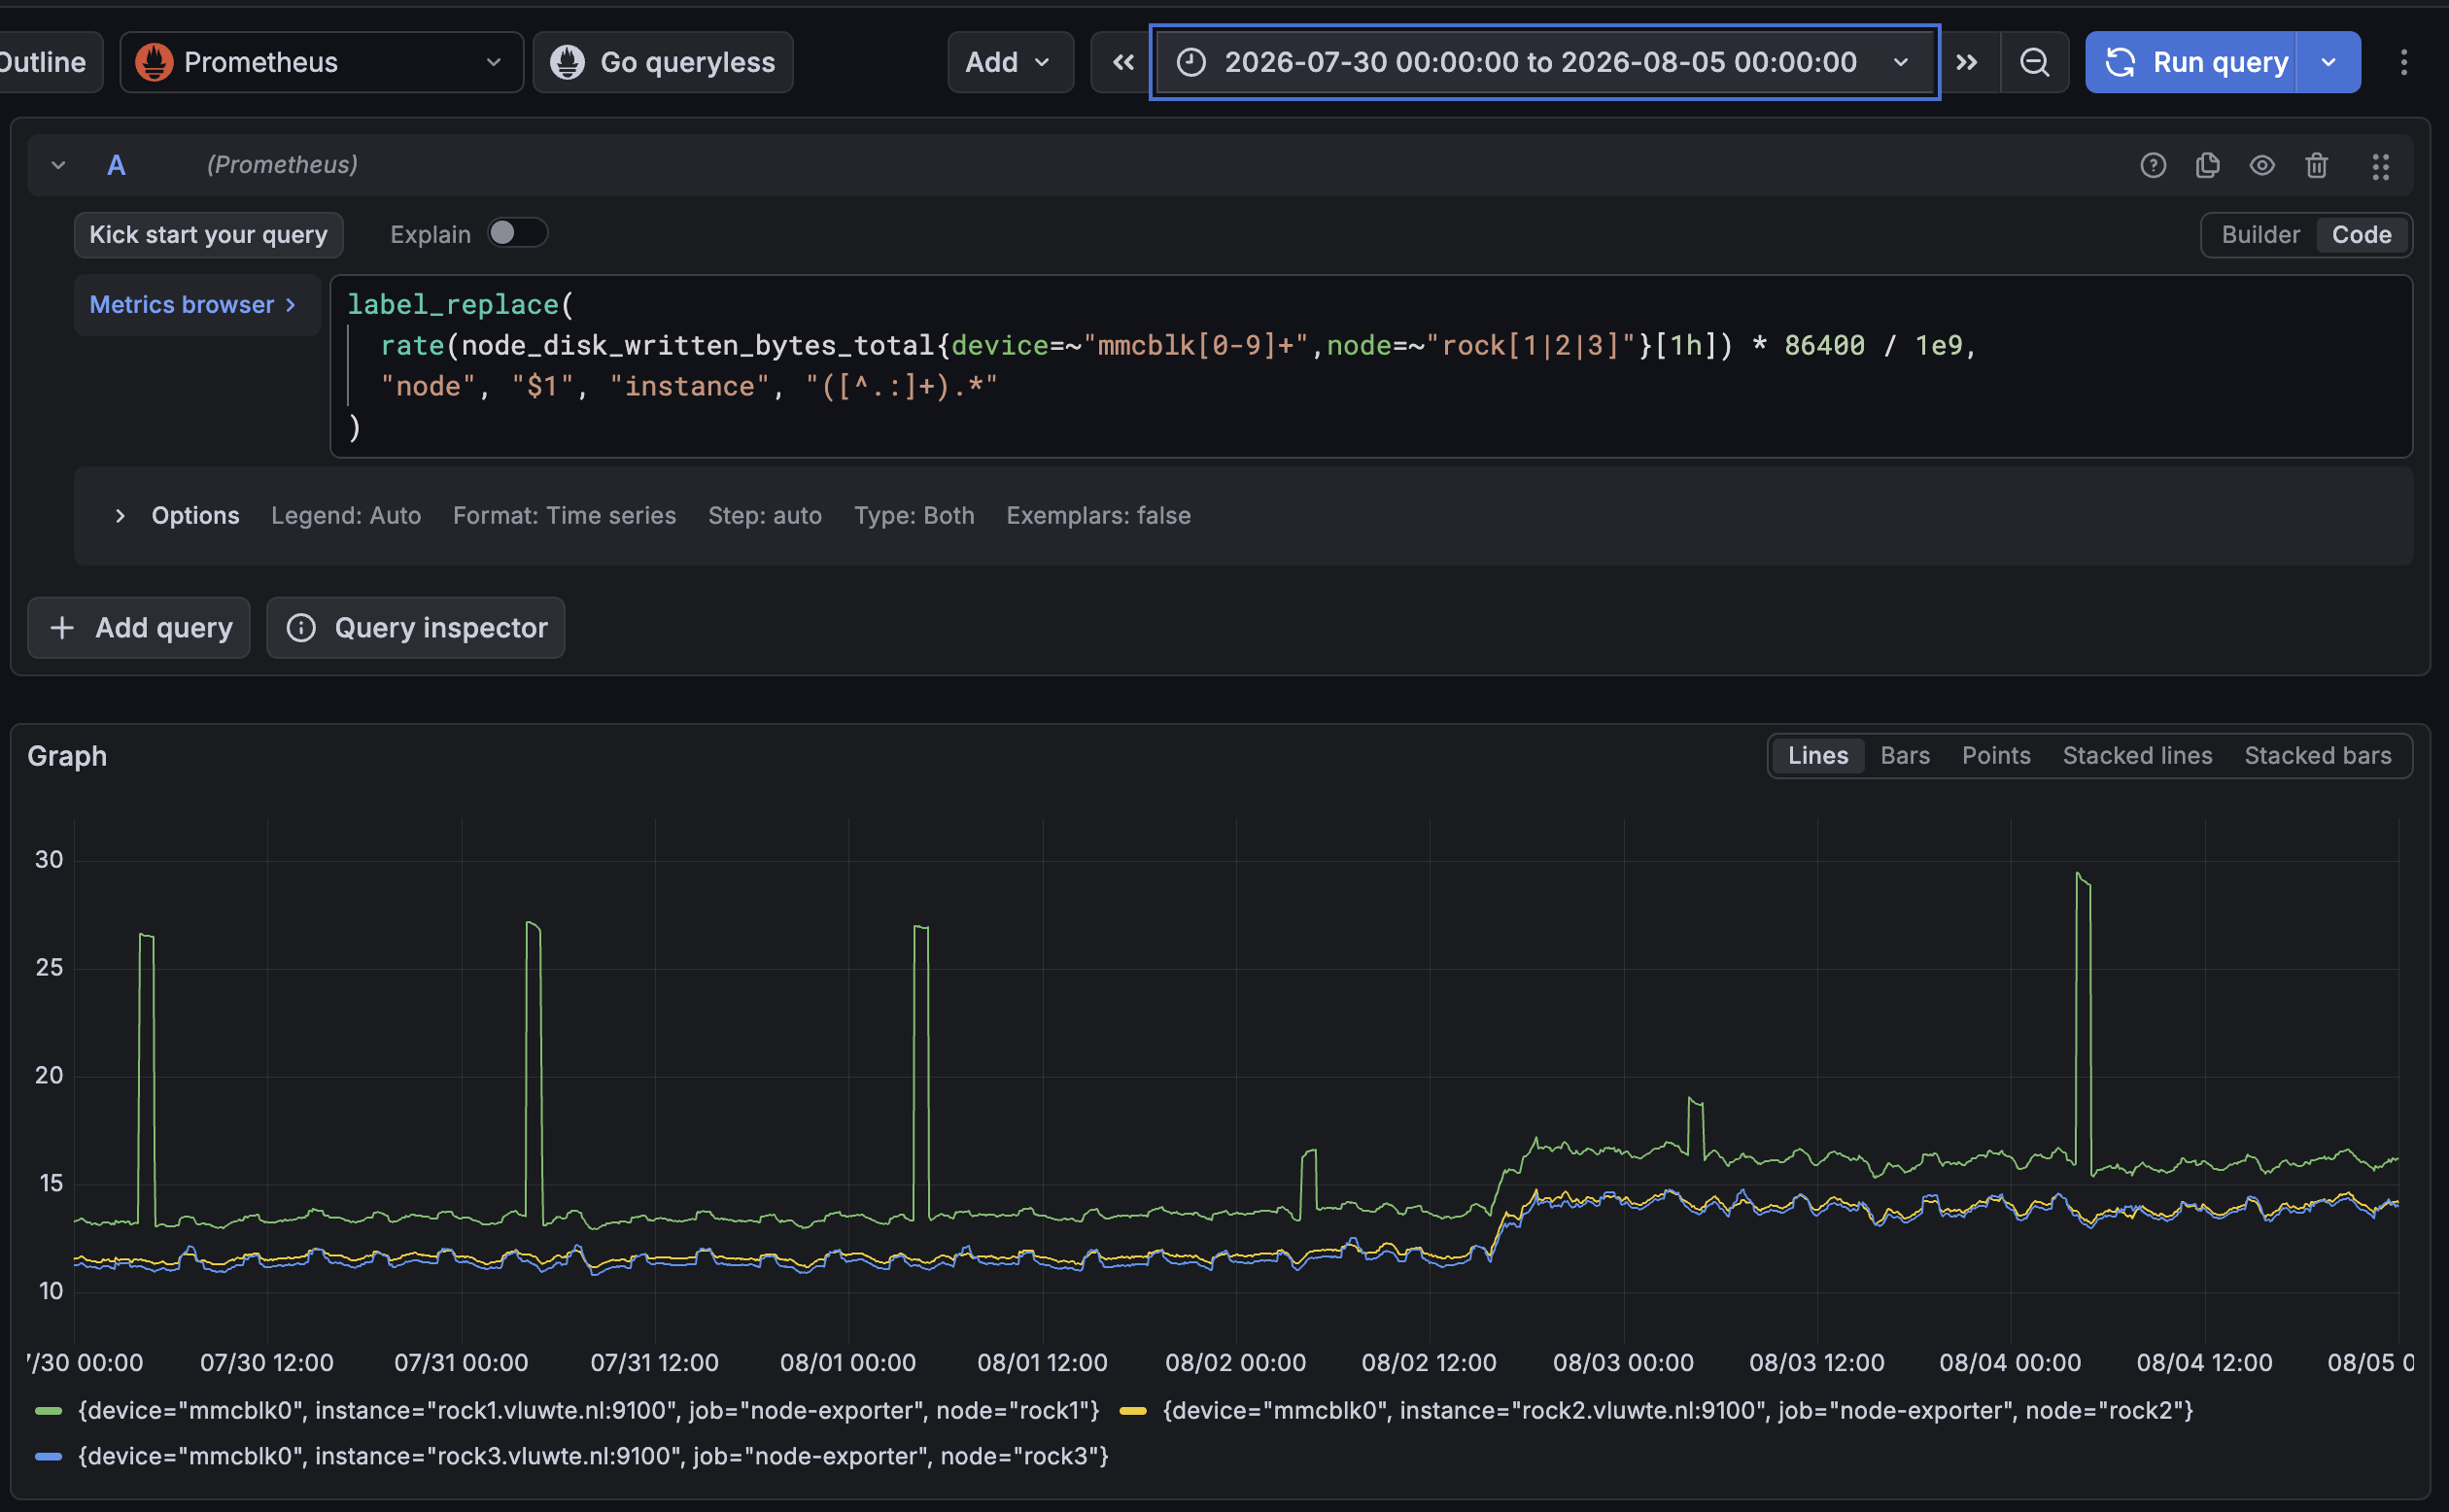
| Node | Before (30 Jul – 2 Aug) | After (3 – 5 Aug) | Step |
|---|---|---|---|
| rock1 | ~13.3 GB/day | ~16.3 GB/day | ~+3.0 |
| rock2 | ~11.5 GB/day | ~14.3 GB/day | ~+2.8 |
| rock3 | ~11.5 GB/day | ~14.3 GB/day | ~+2.8 |
The equal step on all three nodes is what makes this evidence for etcd. Anything local to one node, such as the operator's own pod logs or a pod's scratch files, would show up on one node only. Only replicated writes land equally on every control-plane eMMC, and in this cluster that means etcd.
Two steps, one price
The leases were not all created at once:
| Lease | Created (CEST) |
|---|---|
operator, db9c8771.cnpg.io |
15:45 |
Barman Cloud plugin, 822e3f5c.cnpg.io |
15:58 |
Postgres cluster, bletchley-pg |
17:37 |
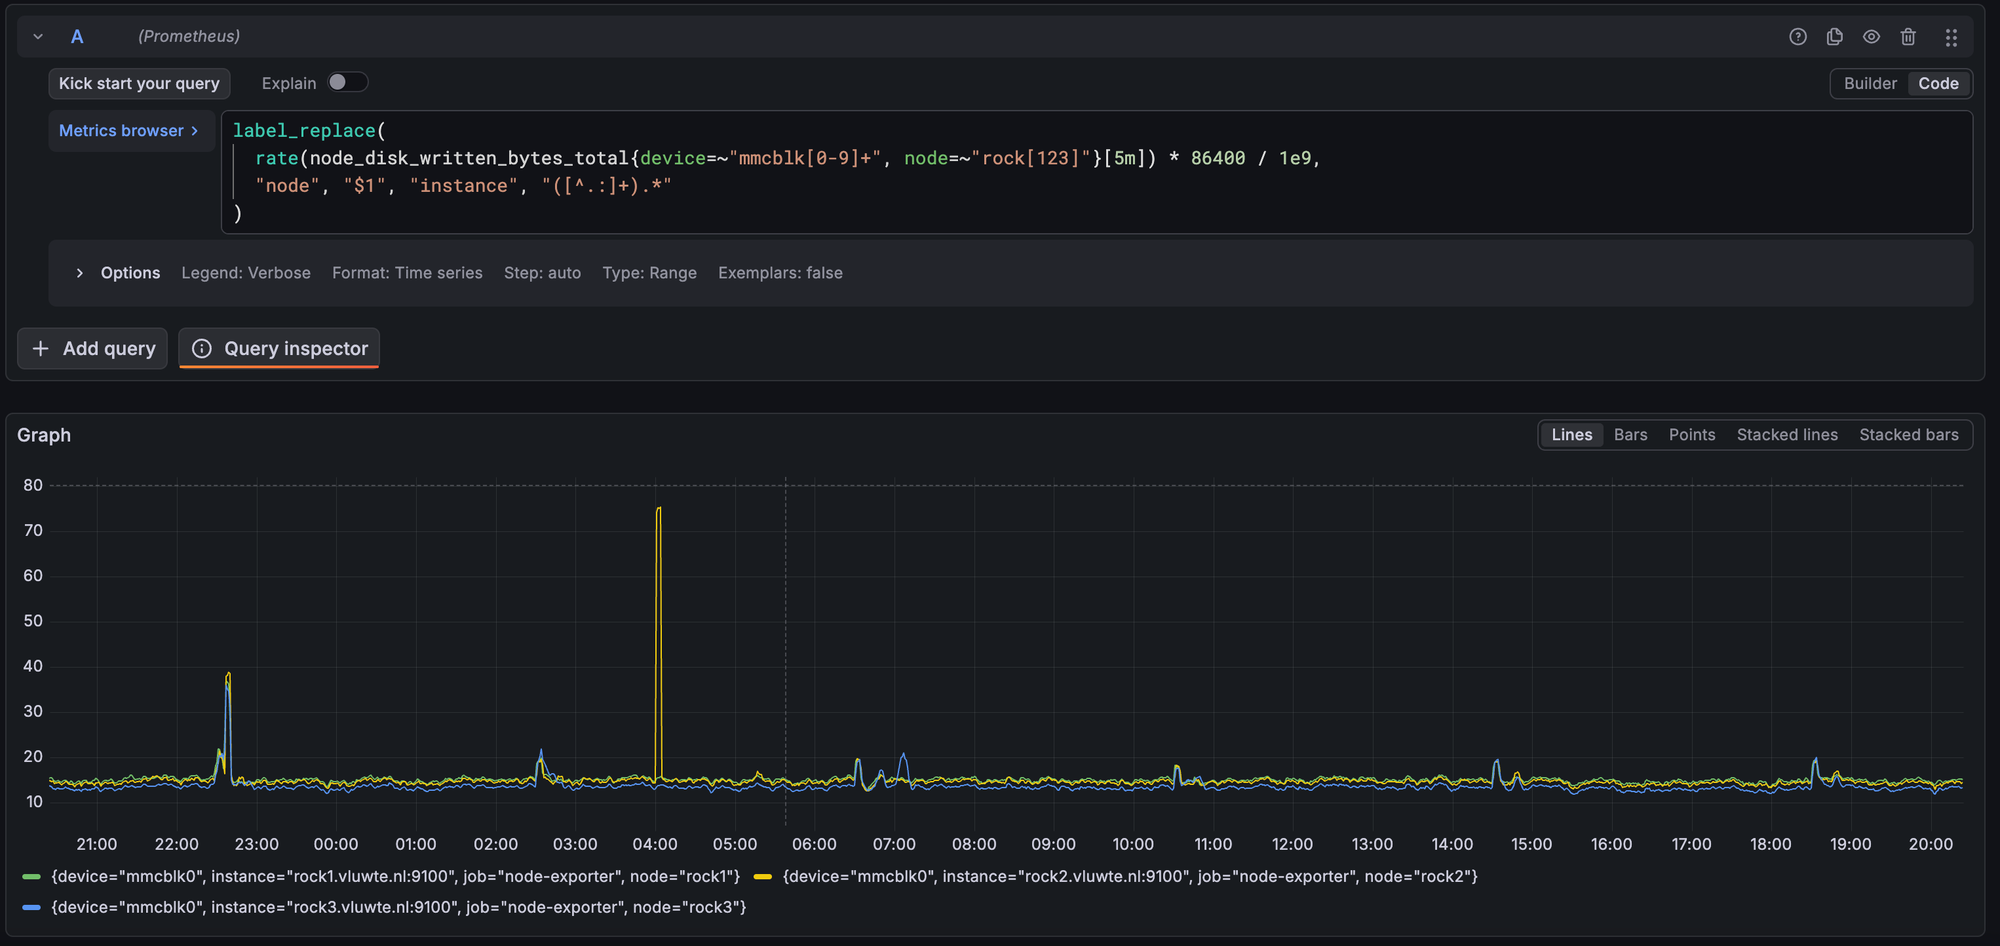
So the step should come in two stages: the operator and plugin first (58 renewals a minute between them), and the Postgres cluster almost two hours later (30 a minute). If etcd writes have a fixed price, the first step should be about twice the size of the second.
A note on reading these graphs: they use a 1-hour rate(), which averages over the previous hour. A lasting change at time T shows as a ramp from T to T plus one hour, ending at the new level. A short burst at T shows as a flat plateau exactly one hour wide that then drops back, and the plateau's height in GB a day, divided by 24, is the burst's size in GB.
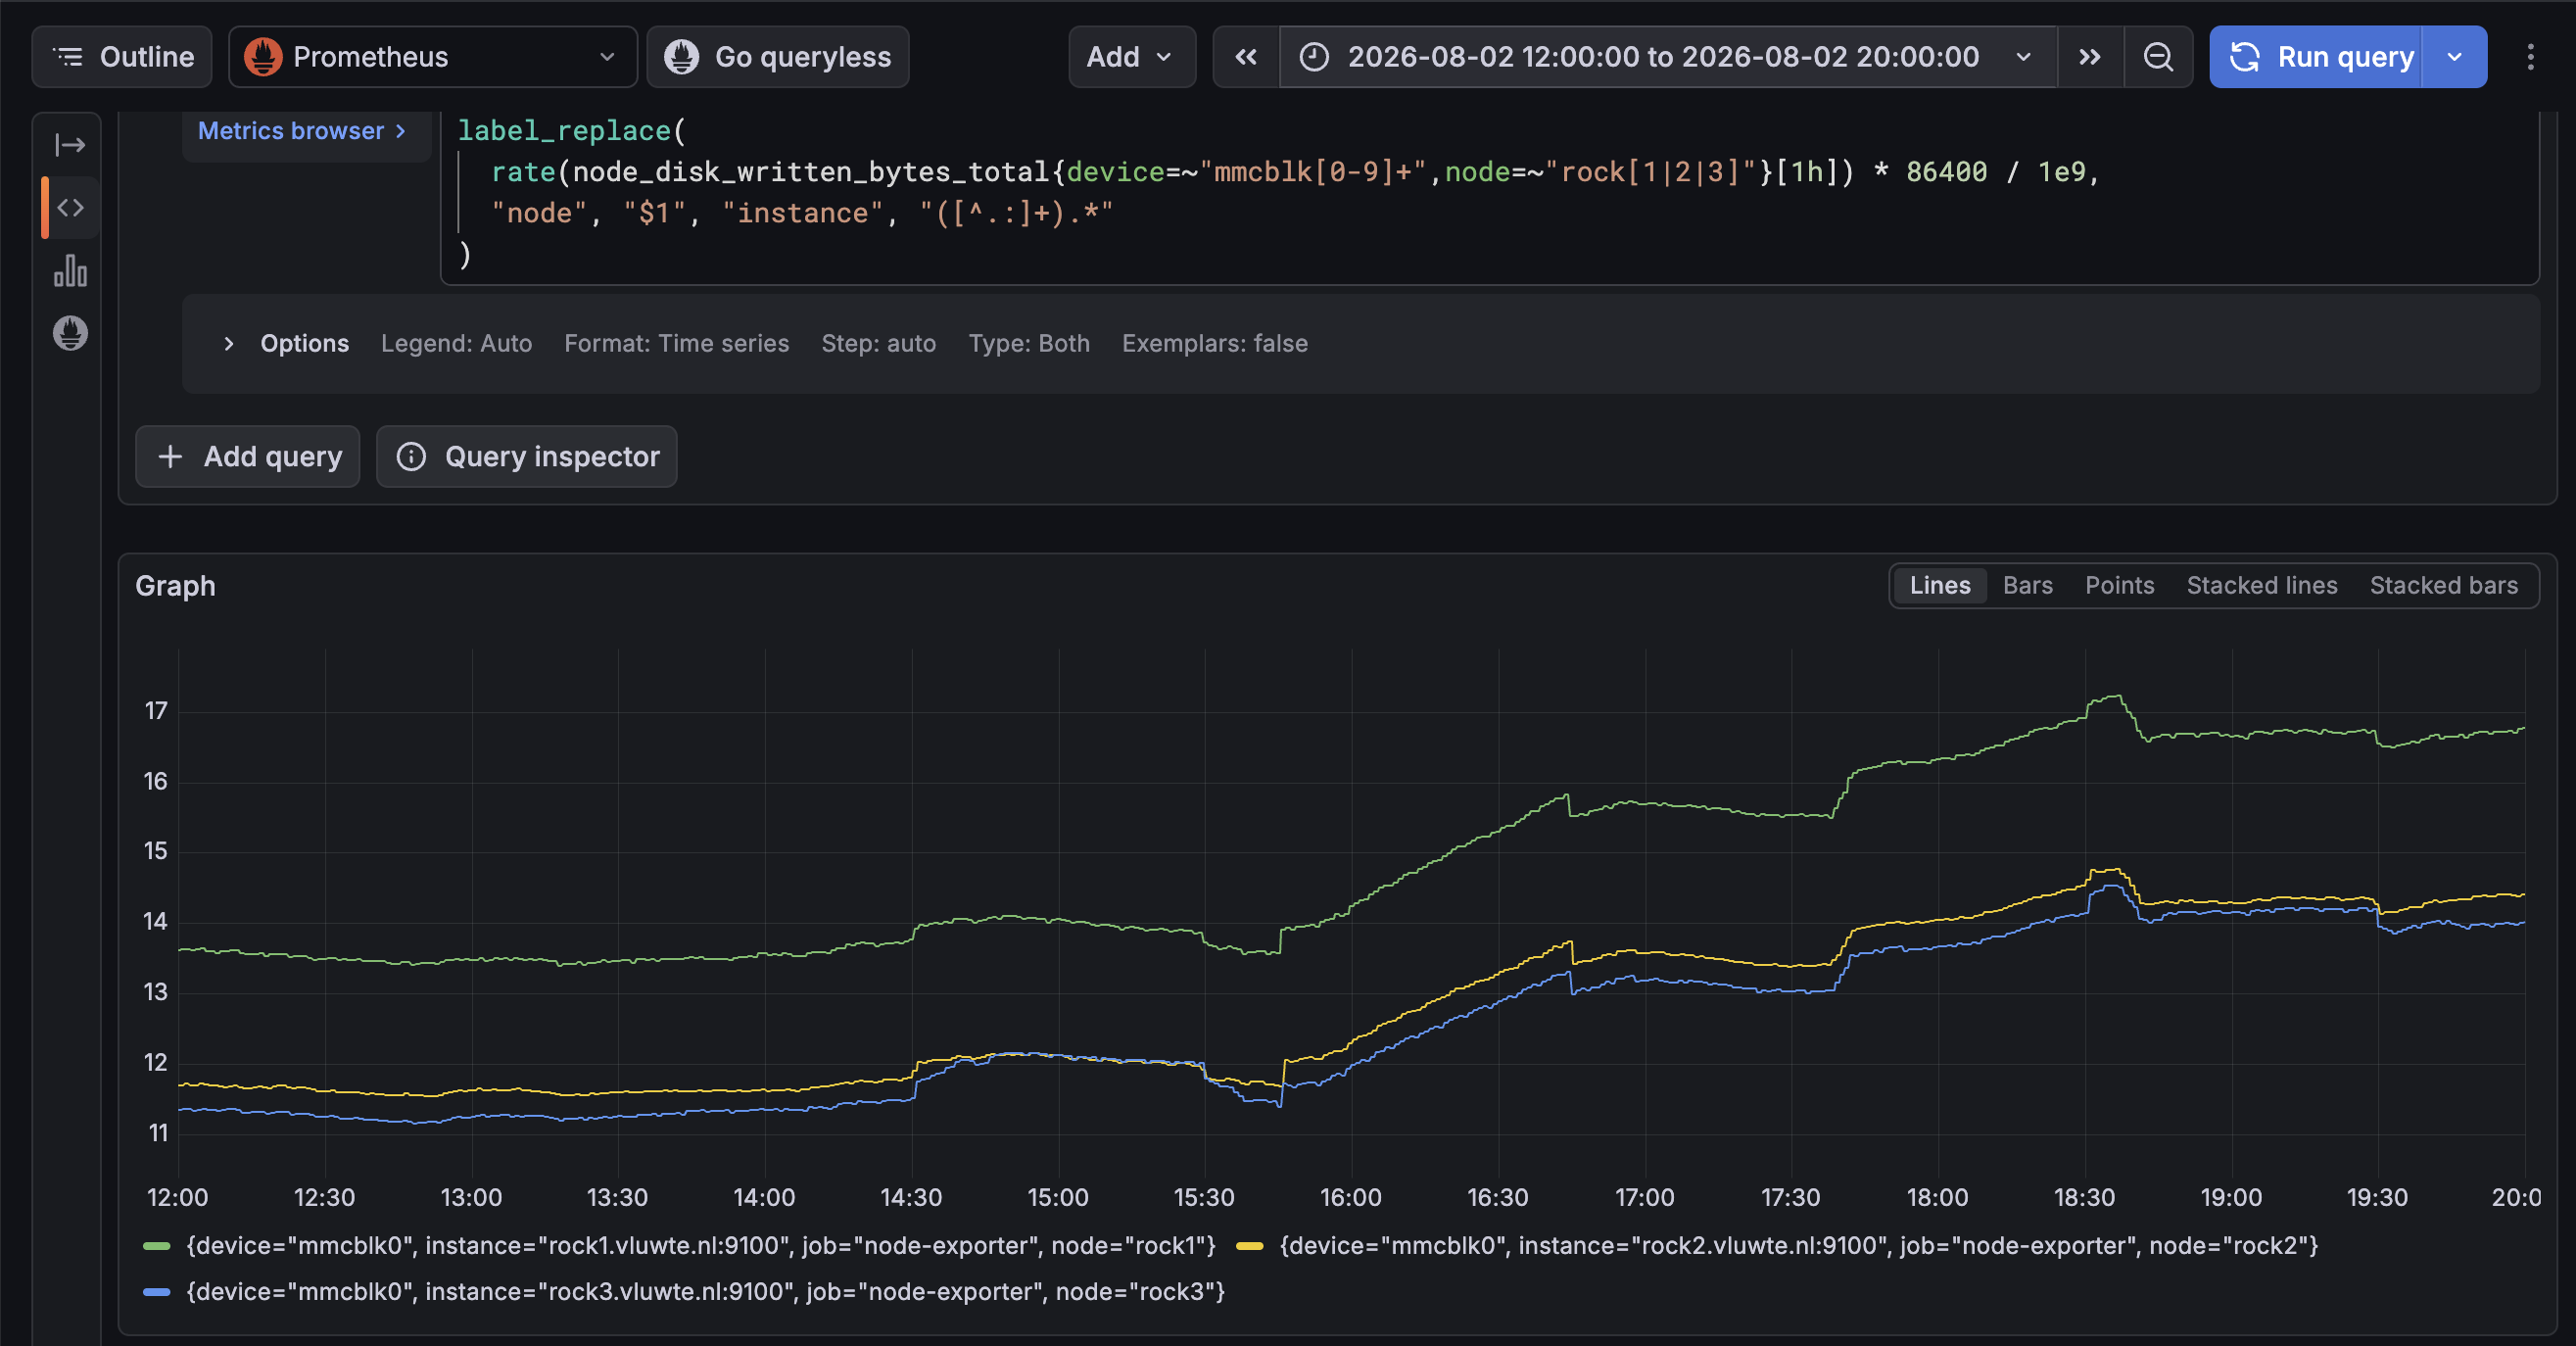
| When | What arrived | Renewals per minute added | Step | Cost per write |
|---|---|---|---|---|
| ~15:45 | operator and Barman Cloud plugin | 58 | ~+1.7 to 1.9 GB/day | ~20 to 23 KB |
| ~17:37 | the bletchley-pg cluster |
30 | ~+0.9 to 1.0 GB/day | ~21 to 23 KB |
The ratio between the two steps is about 1.8 to 1, against 1.9 to 1 predicted from the lease counts. And both give the same price: about 22 KB of eMMC writes per lease write, measured twice, without assuming anything about where the rest of /var's writes come from. That is the independent check the 27 KB upper bound needed. It measures what each write costs, not which layer of the storage stack adds the bytes.
It also closes the loop on CloudNativePG: 89 renewals a minute, at 22 KB each, is about 2.8 GB a day, which is the step in the first graph.
Each install also left a small one-off plateau on all three nodes, at about 15:43 and 17:37, exactly one hour wide: etcd absorbing the install itself (the custom resource definitions, secrets and cluster objects). One bump I cannot explain: from about 14:30 to 15:35 all three nodes sit about 0.5 GB a day higher, a burst of roughly 20 MB, before any CloudNativePG lease existed. It is on all three nodes, so it is probably etcd again, perhaps the CRDs being applied before the operator started. I have no record that confirms it.
Why the Three Nodes Differ: The Audit Log
etcd is equal on all three members, but the three nodes are not equal: rock1 writes about 1.8 GB a day more than rock3. Something besides etcd differs per node.
That something is the kube-apiserver audit log. Talos enables it by default and writes it to /var/log/audit/kube/ on each control-plane node, rotating at exactly 100 MiB and keeping ten old files. Because every rotated file is the same size, the time between rotations is the write rate:
| Node | Time between rotations | Audit log per day |
|---|---|---|
| rock1 | 77 to 79 minutes | ~1.9 GB |
| rock2 | 110 to 112 minutes | ~1.4 GB |
| rock3 | ~13 hours for the current file | ~0.1 GB |
The audit log is not replicated. Each apiserver logs only the requests that reached it, so each node's share depends on which clients happen to be connected to that apiserver.
The second way to measure it is cAdvisor, which counts writes per container. It cannot see etcd (a Talos service, not a container), but it does see the apiserver's static pod:
topk(15, sum by (instance, namespace, pod) (
  rate(container_fs_writes_bytes_total{instance=~"rock[123]", device=~"/dev/mmcblk.*", container!=""}[1h])
) * 86400 / 1e9) > 0
| Pod | rock1 | rock2 | rock3 |
|---|---|---|---|
kube-apiserver-rockN |
1.93 | 1.35 | 0.10 |
alloy (log shipper) |
0.28 | 0.30 | 0.28 |
| everything else | ~0 | ~0 | ~0 |
| All containers | ~2.21 | ~1.66 | ~0.38 |
The apiserver's writes match the rotation arithmetic almost exactly. Two independent methods, the same numbers. And everything else running on the control plane, the workloads included, barely writes to the eMMC at all; their data lives on Longhorn volumes on the NVMe.
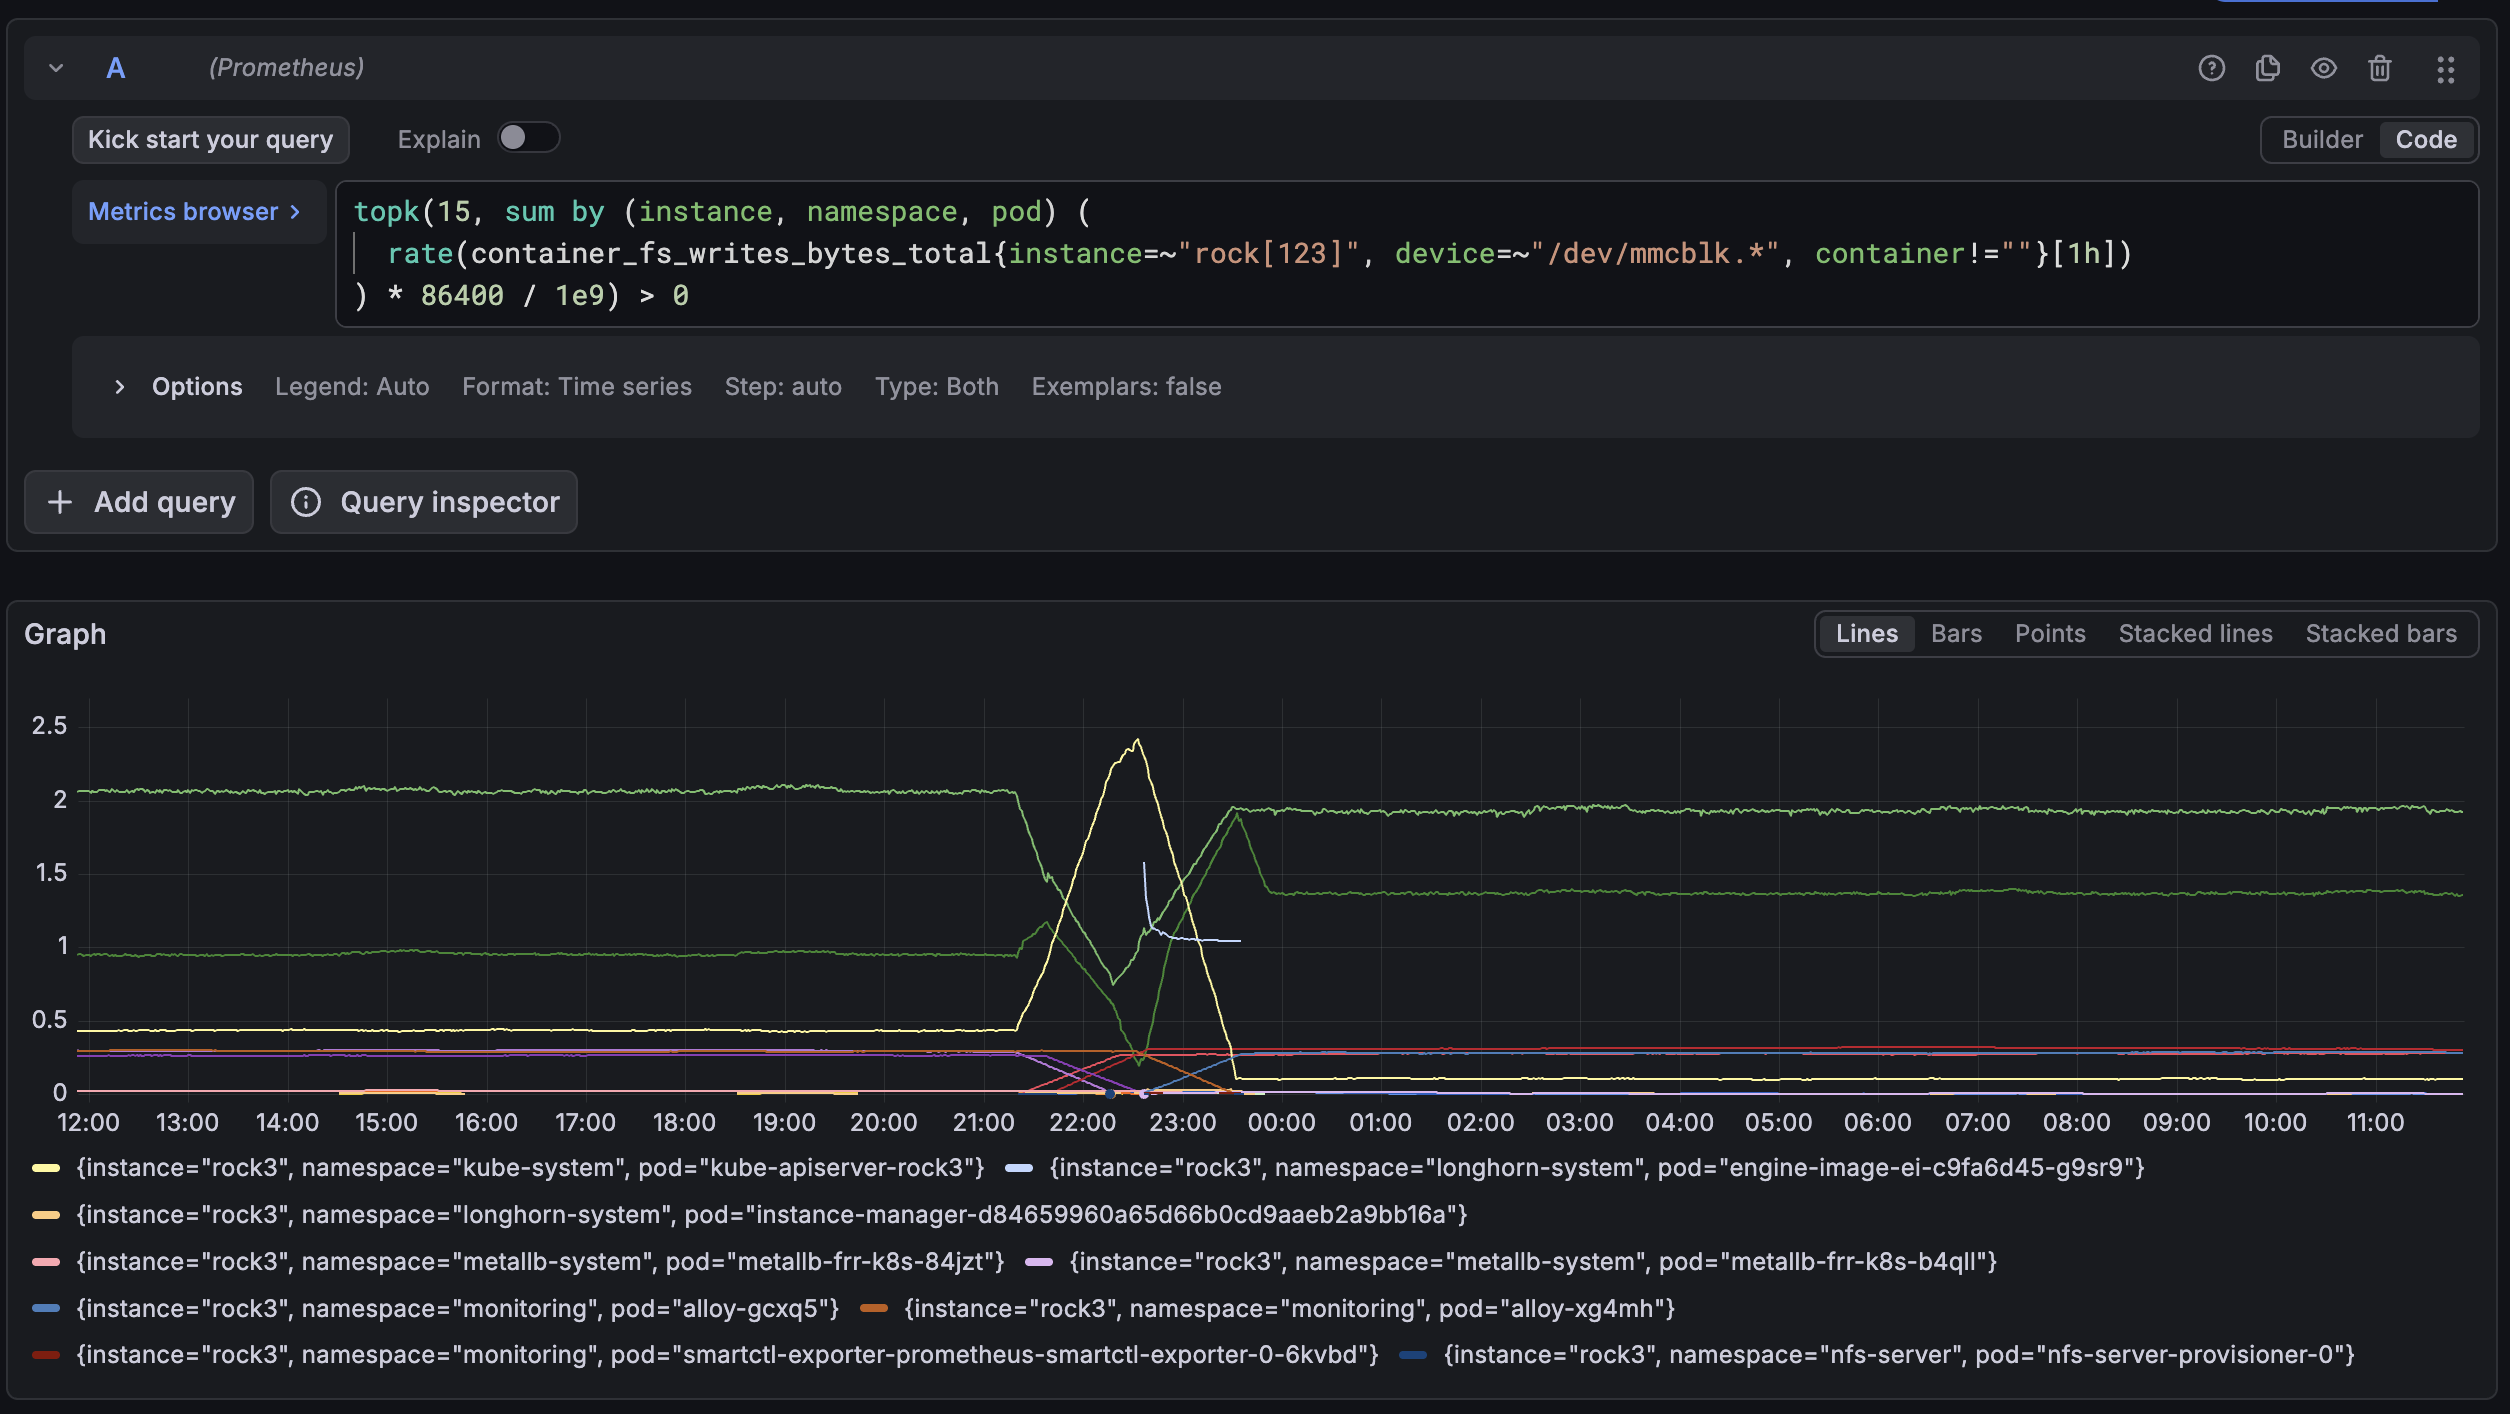
Before the reboots of 26 September the split was different (about 2.05, 0.95 and 0.45), but the total was the same, about 3.4 GB a day. Clients reconnect to whichever apiserver answers when theirs goes away, and stay there.
Now subtract the containers from each node's device writes:
| Device | Containers | Remainder | |
|---|---|---|---|
| rock1 | ~15.2 | ~2.21 | ~13.0 |
| rock2 | ~14.7 | ~1.66 | ~13.0 |
| rock3 | ~13.4 | ~0.38 | ~13.0 |
After containers, the three control-plane nodes are identical. That is what etcd, equal on every member, plus an equal node baseline should look like.
What the audit log writes down
The audit policy logs every request at Metadata level: who asked, for what, about which object, and the result, without request or response bodies. Even so, one line is about 1.5 to 2 KB of JSON: user, service account, the caller's pod and node, source IP, the authorisation reason. That is larger than the ~1 KB etcd write it describes.
Counting the last 5,000 lines on each node by verb and resource:
talosctl -n rock1.vluwte.nl read /var/log/audit/kube/kube-apiserver.log \
  | tail -n 5000 | jq -r '[.verb, .objectRef.resource // "-"] | @tsv' \
  | sort | uniq -c | sort -rn | head -20
| rock1 | rock2 | rock3 | |
|---|---|---|---|
update leases |
38% | 12% | 14% |
get leases |
16% | 11% | not in the top items |
| Leases in total | ~54% | ~23% | ~14% |
On rock1, more than half the audit log is leases. So every lease renewal is written twice: once to etcd, on all three control-plane eMMCs, and once as an audit line on the apiserver that handled it. And because reads are logged too, a get leases that changes nothing in etcd still costs a 2 KB line on the eMMC. Even asking "are you still there?" gets written down.
The Worker Baseline
etcd's share of the 13.0 GB remainder depends on what a node writes outside containers when it is not running etcd. rock4 is the cleanest place to measure that: a worker, flat at about 0.95 GB a day for the whole week, no bursts, no reboots.
| rock4 pod | GB per day |
|---|---|
alloy |
0.343 |
metallb-frr-k8s |
0.018 |
| Longhorn instance manager | 0.005 |
| All containers | ~0.37 |
0.95 minus 0.37 leaves about 0.58 GB a day outside containers: kubelet, containerd and Talos's own services. Container stdout logs would also land here, because containerd writes them to /var/log/pods itself, outside the container's cgroup, where cAdvisor cannot see them. But Loki says rock4's pods logged only about 11 MB in a day. So about 0.58 GB a day is a reasonable estimate of the node baseline of an RK1 running Kubernetes: roughly what the node writes just to be a node.
That gives etcd: ~13.0 minus ~0.58 is about 12.4 GB a day on each control-plane node.
One other line stands out. Alloy, the log shipper from Cluster Observability Part 7, writes 0.28 to 0.40 GB a day on every node, more than a third of a worker's whole eMMC load. I have not yet looked at what it writes (its positions file, a write-ahead buffer, or both).
rock5: The Log System Logging About Itself
rock5 writes about 2.7 GB a day, against rock4's 0.95. Its containers write about 0.43, barely more than rock4's 0.37. So rock5's extra ~1.7 GB a day is not written by any container.
That pointed at pod logs, which containerd writes outside cAdvisor's view. Nothing on rock5 was crash-looping, so I asked Loki how much each pod on rock5 had logged in a day:
sum by (namespace, pod) (bytes_over_time({node="rock5"}[24h]))
| Pod | Logged in 24 h |
|---|---|
monitoring/loki-0 |
856 MB |
monitoring/loki-gateway |
168 MB |
traefik |
31 MB |
longhorn-manager |
18 MB |
loki-canary |
7 MB |
| others | under 5 MB |
| Total | ~1.08 GB |
Loki and its gateway both run on rock5, and together they print about a gigabyte a day about themselves. containerd writes those lines to rock5's eMMC. Alloy then ships them back into Loki, which logs about ingesting them. loki-gateway is an nginx in front of Loki, and its access log gets a line for every push from every Alloy on every node.
The same query for rock4 returns about 11 MB. So between the two workers:
- outside containers: rock5 ~2.3 minus rock4 ~0.58, about 1.7 GB a day more on disk
- pod log content: rock5 ~1.08 minus rock4 ~0.01, about 1.07 GB a day more as logged
On rock5 in this period, each gigabyte of logged content corresponded to about 1.6 GB on the eMMC. The likely extra comes from containerd's log format, which prefixes every line with a timestamp, stream name and flag (a large fraction of a short nginx line), from kubelet compressing rotated log files and so writing them a second time, and from the XFS journal. This assumes rock4 and rock5 are otherwise alike outside containers. They run the same DaemonSets, so I think that is fair.
rock5's extra is Loki's own logs. Where Loki runs is a scheduling accident: loki-0 is a StatefulSet that happened to land on rock5. Wherever it runs, that node carries this gigabyte a day.
The Budget
Per node, in GB per day, at the end of September:
| Source | rock1 | rock2 | rock3 | rock4 | rock5 | Basis |
|---|---|---|---|---|---|---|
| etcd | ~12.4 | ~12.4 | ~12.4 | none | none | inferred: remainder minus baseline |
| Audit log | 1.93 | 1.35 | 0.10 | none | none | measured twice |
| Alloy | 0.28 | 0.30 | 0.28 | 0.34 | 0.40 | measured |
| Other containers | ~0 | ~0 | ~0 | ~0.02 | ~0.03 | measured |
| Pod logs | small | small | small | ~0.01 | ~1.7 | measured in Loki, ~1.6× inferred |
| Node baseline: kubelet, containerd, Talos | ~0.6 | ~0.6 | ~0.6 | ~0.58 | ~0.6 | estimated from rock4 |
| Device total | ~15.2 | ~14.7 | ~13.4 | ~0.95 | ~2.7 | measured |
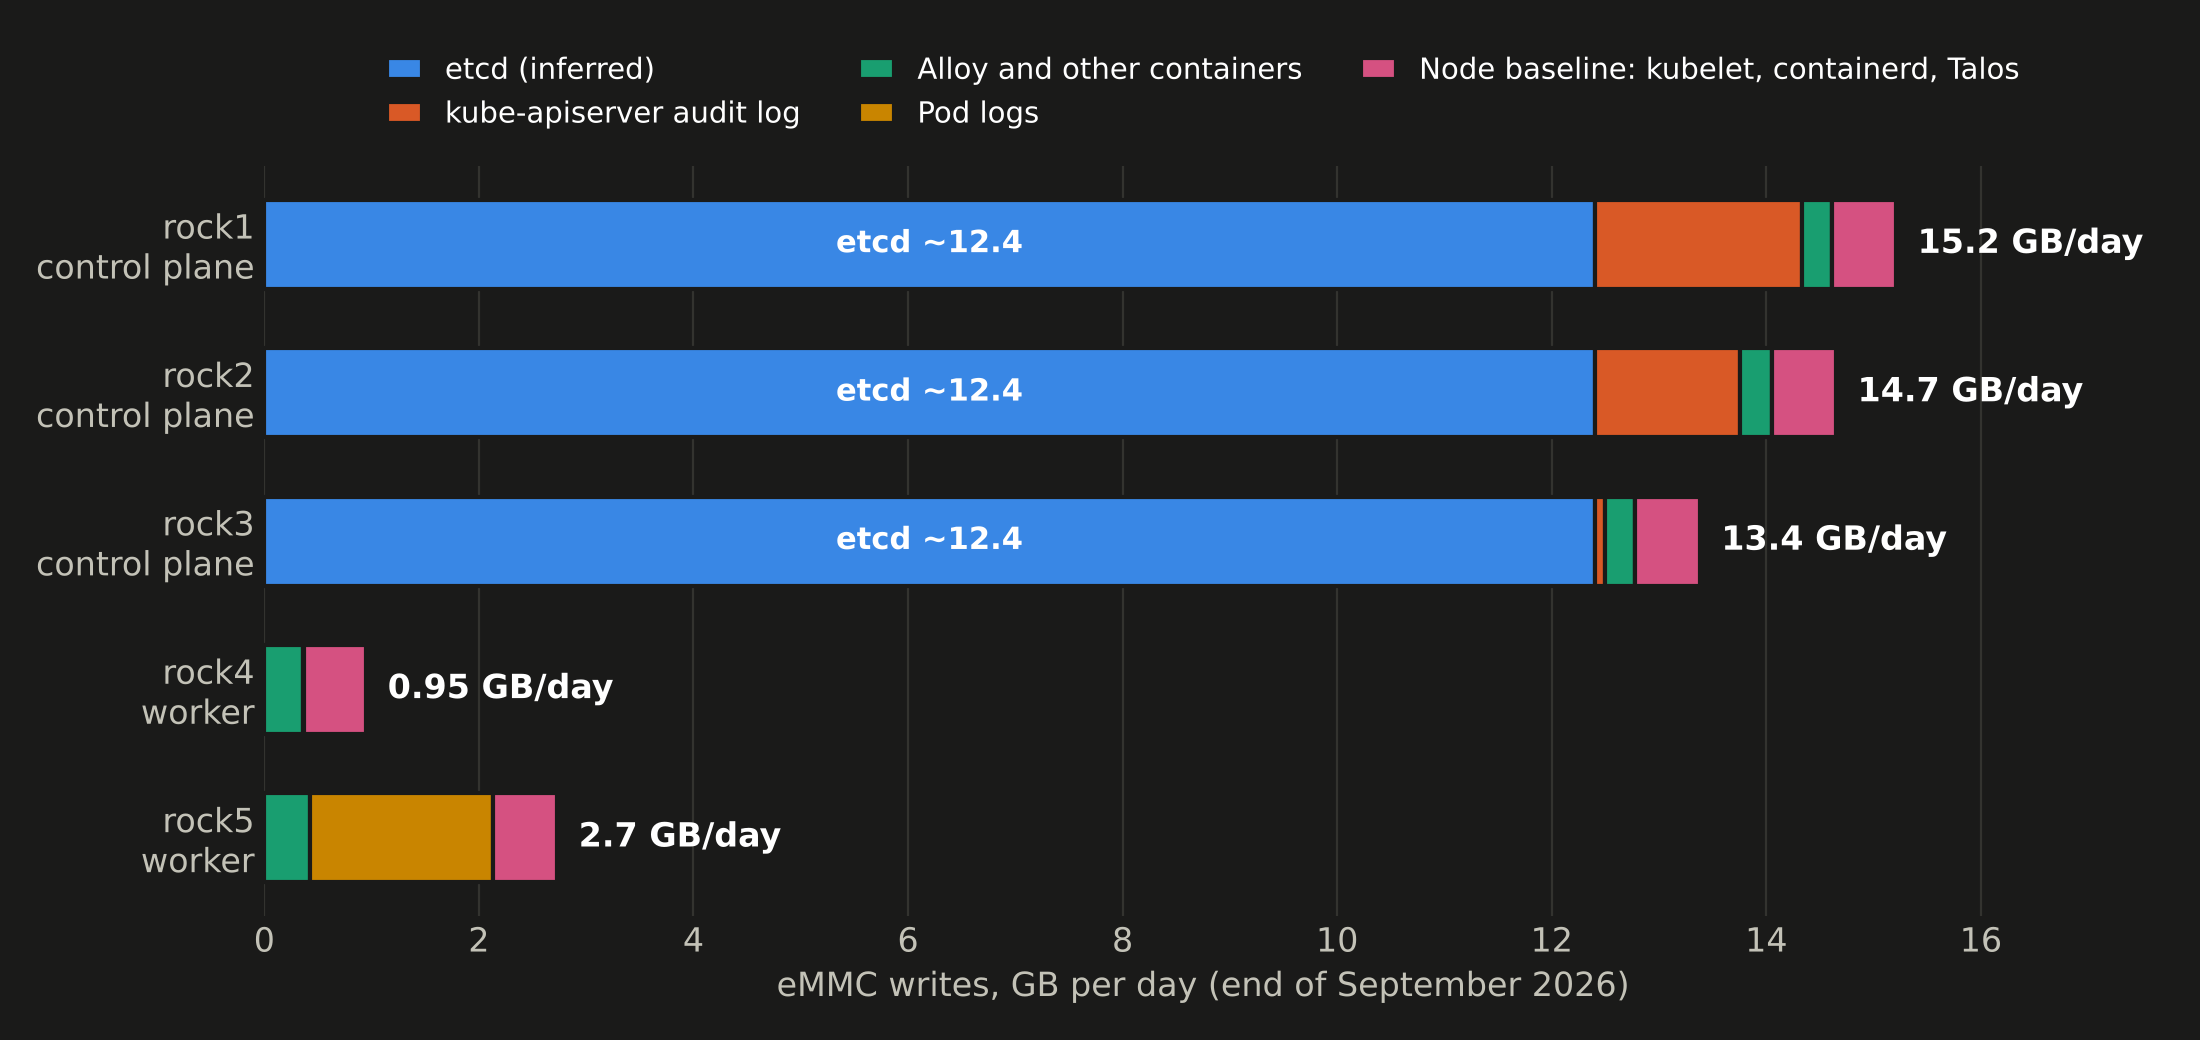
etcd is 82% of rock1's eMMC writes and 93% of rock3's. The three answers, one line each:
- The control plane: etcd, about 12.4 GB a day on every member. Mostly lease renewals, each ~1 KB write corresponding to ~22 KB on the eMMC, on all three nodes. The differences between the nodes are the audit log.
- The worker baseline: about 0.6 GB a day of kubelet, containerd and Talos, plus 0.3 to 0.4 of Alloy.
- rock5: Loki and its gateway logging about a gigabyte a day about themselves, written at about 1.6×.
The cost of saying "I'm still here"
263 renewals a minute is about 379,000 a day. At the measured ~22 KB per lease write, that is roughly 8 GB a day on each control-plane eMMC, about 25 GB a day across the three, before the audit log writes many of them down again. On a 32 GB device, the cluster's heartbeats alone rewrite a quarter of it every day, on every control-plane node. None of these writes record anything that happened. They record that nothing did.
What is measured and what is inferred
- The cost per write is inferred, not traced. It comes from two step changes on 2 August and from averages over all writes, which agree. I did not trace individual writes at the block layer (
bpftracewould), and the per-process counters cannot measure it. - The 22 KB is measured on lease writes. Averaged over all of etcd's writes, the figure is 26 to 32 KB, which makes sense: leases are the smallest objects, and larger writes and etcd's own compaction cost more. The 8 GB a day for renewals uses the lease figure.
- etcd's 12.4 GB assumes a control-plane node's baseline equals a worker's. The static pods' own stdout logs could add a little, which would make etcd slightly smaller. Not by much: the remainder is equal on all three control-plane nodes regardless of what each one runs.
- The 1.6× log factor assumes rock4 and rock5 are otherwise alike outside containers.
Two Things the Budget Doesn't Need
Two patterns in the graphs looked like they might matter. Both are real, and both are too small to change the budget.
The nightly etcd backup. The talos-backup CronJob from Backup Validation runs at 0 2 * * *, which is 02:00 UTC and 04:00 CEST. It takes an etcd snapshot, writes it to local disk with a compressed and encrypted copy, and uploads the result to Garage. That is about 170 MB in roughly a minute, about twice the 81 MB database, on whichever node the job lands on. In August that was rock1, which explains its spikes in the CloudNativePG graph. Since the reboots of 26 September it has been rock2. About 1% of that node's daily writes.
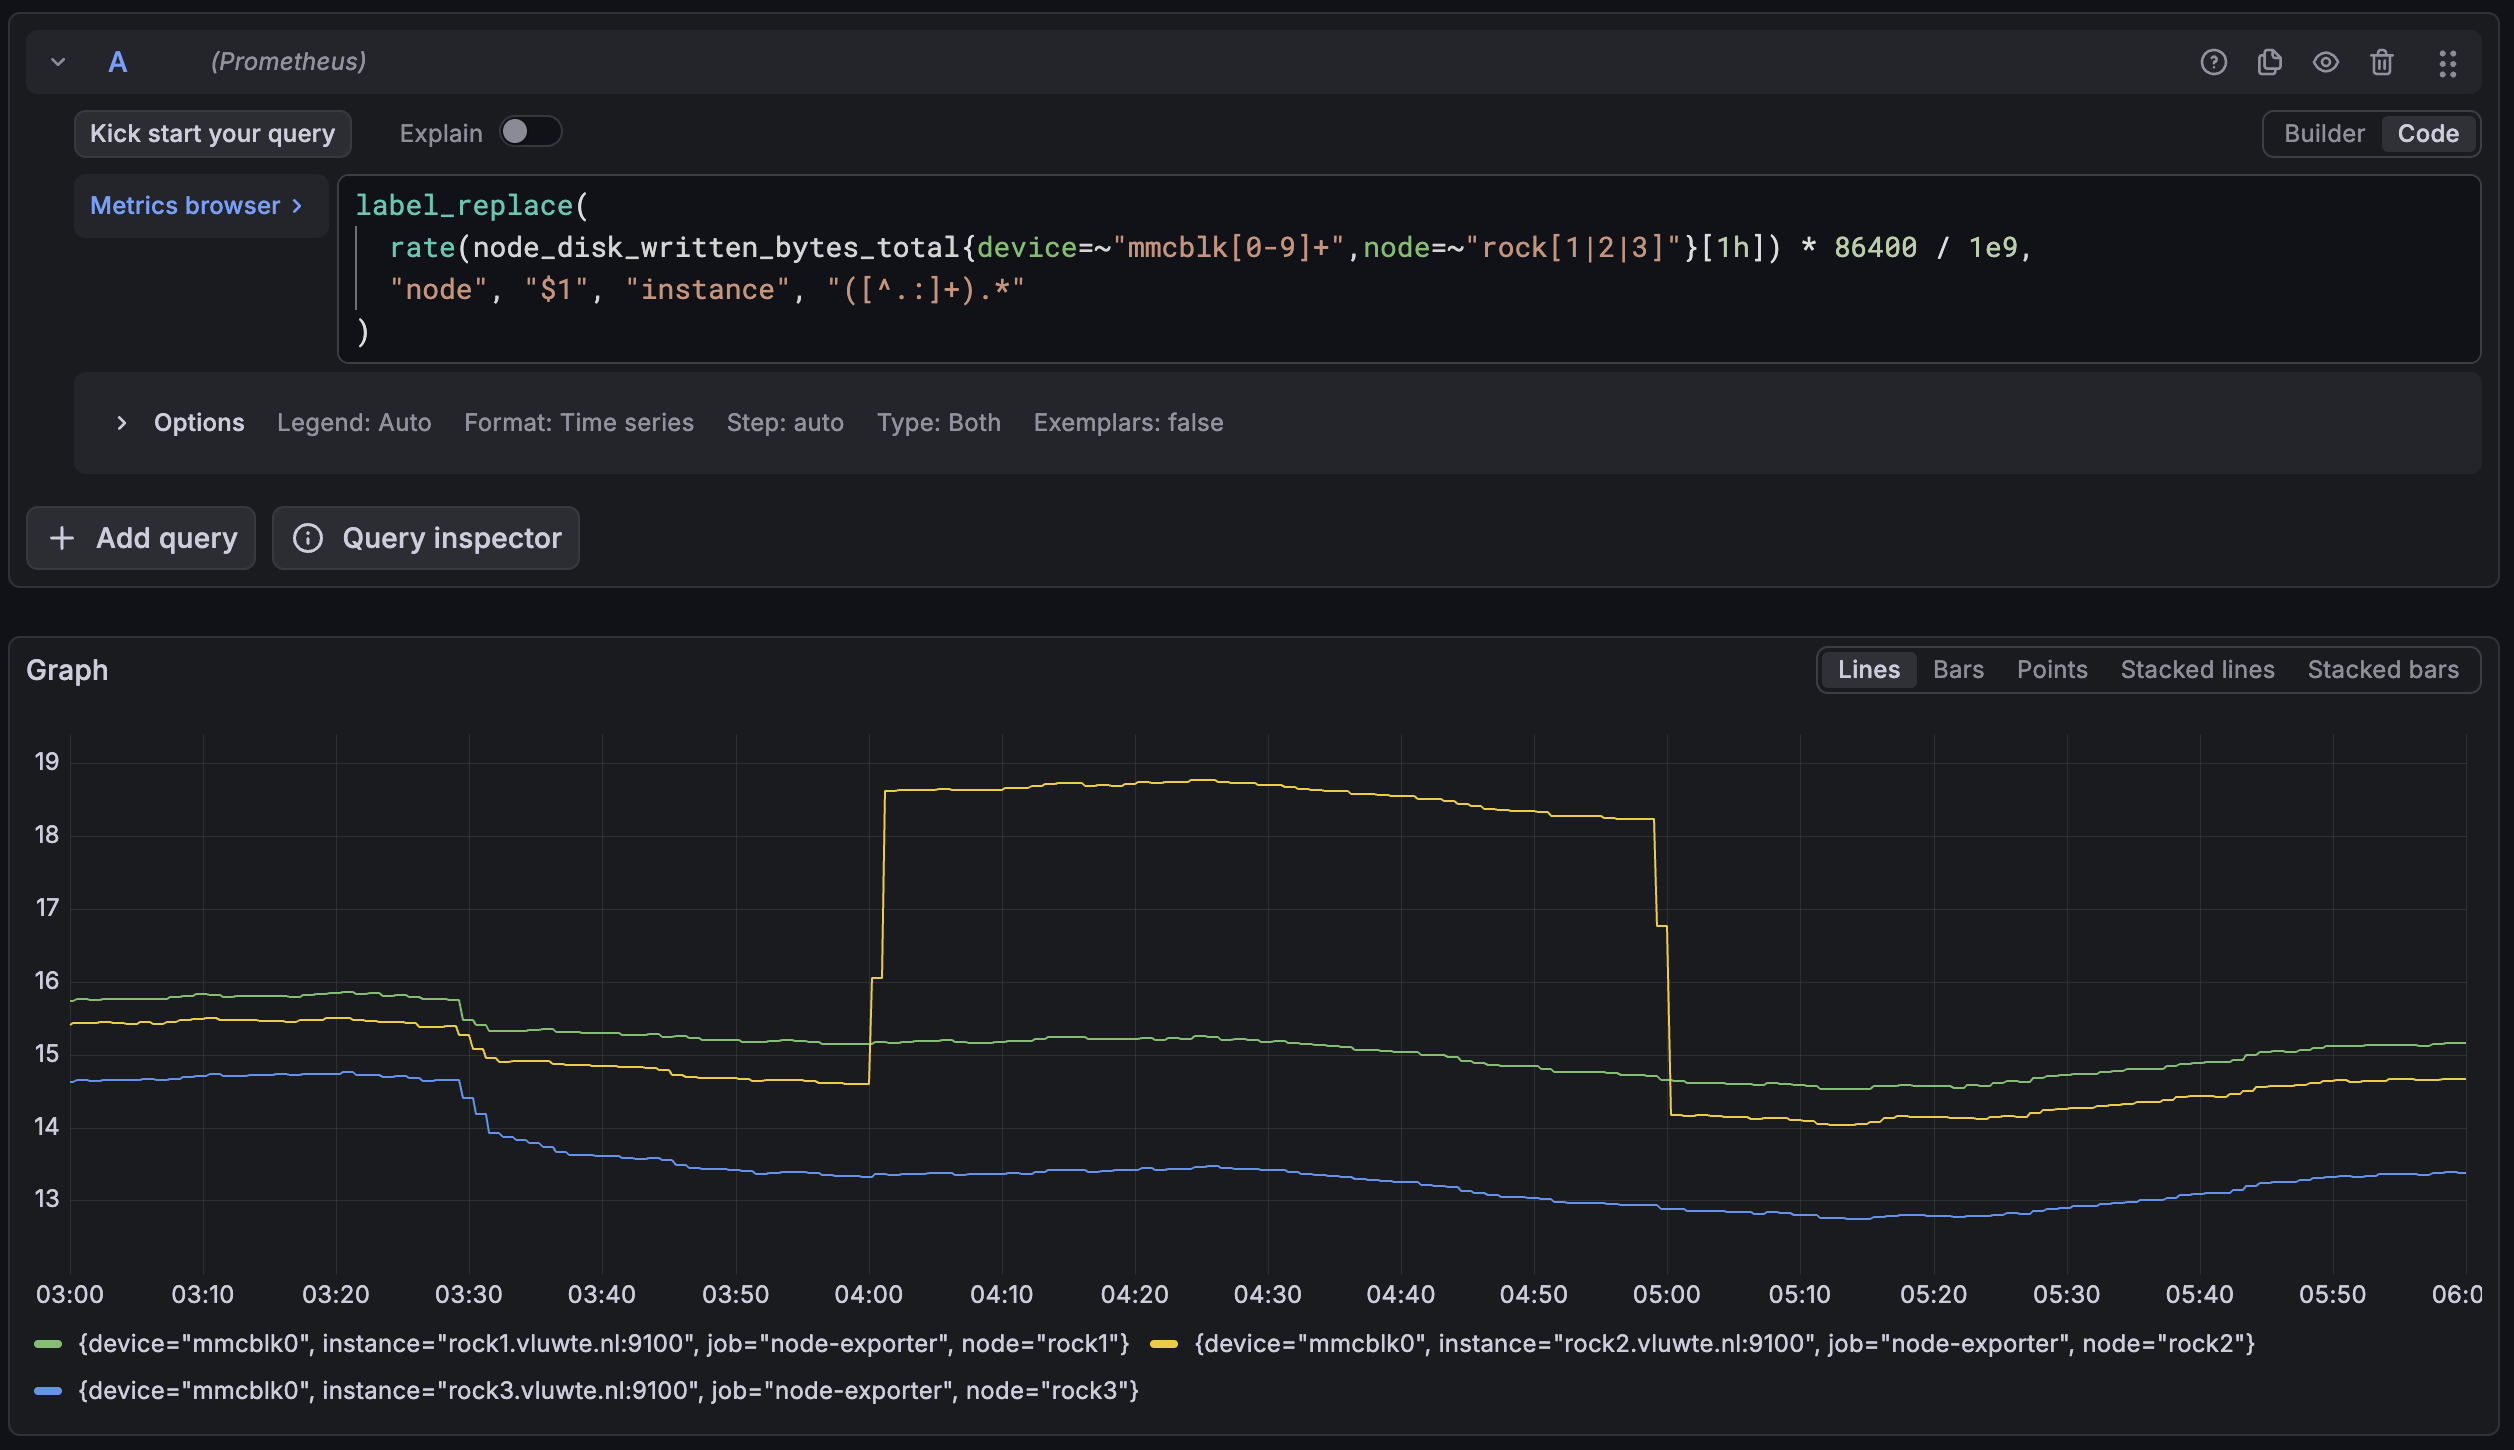
The four-hourly heartbeat. At a 5-minute resolution, all three control-plane nodes show a small bump every four hours: 22:30, 02:30, 06:30 and so on. These are Longhorn's recurring backup jobs, created by the backup controller and scheduled at 30 0/4 * * ? in UTC. The backup data itself goes from the NVMe to Garage, but each run creates backup objects, job pods and events, and those are etcd writes. Hence all three nodes at once.
Conclusion
The caption I wrote under a graph in The Disk With No S.M.A.R.T. said "The three control-plane lines are etcd." It was right, for a reason I did not know at the time. etcd does not write much. It writes often, and it writes carefully, and on a soldered eMMC careful is expensive. Most of what it so carefully writes is twenty leases announcing that their holders are still alive, and the controller I added most recently is the loudest of them.
Lessons learned:
- Bytes appended are not bytes written. etcd's WAL counter said 4%. The device said otherwise: every 1 KB change is synced on its own, and on this eMMC each one corresponds to about twenty times its size in device writes.
- A step change on a known date is worth more than a month of averages. The CloudNativePG install gave a known number of new writes at a known time, and priced them twice without assuming the answer.
- Replicated writes are paid in full on every member. Raft means every control-plane eMMC records every write in the cluster, whichever node it came from.
- Leader election costs per controller, not per replica. Each new operator, and each operator plugin with its own leader election, adds a heartbeat to etcd forever.
- The tools that look like the answer need checking.
/proc/<pid>/ioovercounted by 14×. cAdvisor cannot see etcd or container logs. Both were useful, once I knew what they could not see.
What's Next
This post only answers what writes to the eMMC. The obvious follow-up is whether any of it should change: moving etcd to the NVMe (which is fully committed to Longhorn, and etcd is sensitive to fsync latency), slowing down lease renewals where a controller allows it, trimming the audit policy, turning down Loki's log level, or deciding that 15 GB a day on a 32 GB device is acceptable and writing down why. If that post happens, etcd's placement becomes a recorded decision rather than a default.
← Previous: Getting etcd's Metrics Out of Talos
Questions or suggestions? Leave a comment below or reach out at igor@vluwte.nl.