Getting etcd's Metrics Out of Talos
etcd on Talos is not a pod, so nothing scraped it. One patch, a restart Talos refuses, a rolling reboot, and alerts so the metrics can't go quiet.
Introduction
In The Disk With No S.M.A.R.T. I found that the three control-plane nodes write 14 to 16 GB a day to their soldered eMMC, against 1 to 3 GB on a worker. Under the 90-day graph I wrote the caption "The three control-plane lines are etcd." In Teaching Prometheus to Read an eMMC I built the collector that watches what those writes do to the device. Neither post checked that caption.
etcd is the obvious suspect. It runs on exactly the three nodes that write the most, and it syncs every change to disk before acknowledging it. So I went to Prometheus to confirm it, and etcd_disk_wal_write_bytes_total returned nothing. Nothing in the cluster was scraping etcd. I had been building a case against a process I had never measured.
This post is the fix. One line of Talos config, a patch that reported success and changed nothing, a restart Talos refuses to do, a rolling reboot of the control plane, a scrape job, and two alert rules so the new metrics cannot disappear without someone noticing. It ends with the first number etcd reported, which was not the one I expected.
🔭 This is part of the Cluster Observability series - monitoring, logging and alerting for the Bletchley cluster.
- Teaching Prometheus to Read an eMMC
- Getting etcd's Metrics Out of Talos (you are here)
Why etcd's Metrics Aren't There
On a kubeadm cluster, etcd runs as a static pod. kubelet starts it from a manifest, it shows up in kubectl get pods -n kube-system, and anything that scrapes pods can find it.
Talos does it differently. etcd is a Talos system service, listed next to kubelet and containerd:
talosctl -n rock1.vluwte.nl service etcd
kubelet does not run it, Kubernetes does not schedule it, and there is no pod to annotate or discover. The other control-plane components (kube-apiserver, kube-controller-manager, kube-scheduler) are static pods, which is why they appear in Loki and cAdvisor (see Know Your Logs Before You Hunt Them). etcd does not.
etcd does serve /metrics, on its client port 2379, but only behind mutual TLS: every client has to present a certificate signed by etcd's own CA. Prometheus has no such certificate, and that is deliberate.
Three ways to get the numbers
| Option | What it does | Why it did or didn't win |
|---|---|---|
| A: A second metrics listener on 2381 | One etcd flag, listen-metrics-urls, set through a Talos machine-config patch. Plain HTTP, metrics only. A static Prometheus job on the three control-plane hosts |
Chosen. One line of config and nothing to distribute or rotate. It costs an unauthenticated endpoint on the cluster VLAN, and a reboot per node to take effect (more on that below) |
| B: Scrape 2379 with an etcd client certificate | Give Prometheus an etcd client cert and key, and scrape the main client port | Lost on what it hands out. An etcd client certificate in a Prometheus secret is far more than read access to metrics, and it would have to follow Talos's certificate rotation. Too much for a read-only metrics feed |
| C: Use what is already collected | cAdvisor and kubelet already report per-container I/O | Cannot work. etcd is not a container kubelet manages, so cAdvisor never sees it |
The Patch
etcd-metrics.patch.yaml, git-tracked next to the other Talos patches:
cluster:
  etcd:
    extraArgs:
      listen-metrics-urls: http://0.0.0.0:2381
listen-metrics-urls is an ordinary etcd flag. It opens a second listener that serves /metrics and /health and nothing else: no keys, no writes, no client API.
Why 0.0.0.0. Prometheus runs in a pod and reaches the nodes over the network, so the listener cannot be loopback-only. Binding to each node's own address would mean one patch per node; 0.0.0.0 keeps it to one file for all three. The cost is stated plainly: anything on the cluster VLAN can read etcd's metrics without authenticating. Talos's ingress firewall is not enabled on Bletchley, so the port is reachable as soon as etcd listens on it. I accepted that because the metrics are counters and latencies, not data. If I ever turn on the ingress firewall, 2381 needs a rule.
One standing rule comes with this file. The listener lives in its own patch, not in the base control-plane patch. If I ever regenerate the machine configs from the base patch, this one has to be reapplied, or the port silently disappears. That failure mode is what the alerts further down are built around.
"Applied Configuration Without a Reboot"
I applied the patch to rock1:
talosctl -n rock1.vluwte.nl patch mc --patch @etcd-metrics.patch.yaml
Talos answered: "Applied configuration without a reboot". Good. Then I checked whether anything was listening:
talosctl -n rock1.vluwte.nl netstat -l -t | grep 2381
Nothing. And talosctl service etcd showed etcd still running since its last start, 1249 hours earlier.
Both statements were true. Talos had applied the new machine configuration, and it did not need a reboot to do so. But etcd reads its command-line arguments once, when it starts, and nothing had restarted it. "Applied" describes the configuration on the node, not the process that is supposed to use it.
So I asked Talos to restart it:
talosctl -n rock1.vluwte.nl service etcd restart
It refused: service "etcd" doesn't support restart operation via API.
Talos manages etcd's lifecycle itself and does not expose a restart for it. My guess is that this is deliberate: restarting a member at the wrong moment is how you lose quorum, and a reboot goes through Talos's own shutdown sequence. Whatever the reason, it left one way forward.
The Rolling Reboot
talosctl reboot does not drain the node first, so I did that myself. One node at a time, and only after confirming the other two etcd members were healthy, because a three-member etcd cluster needs two members for quorum, while one member is rebooting, the other two need to remain healthy:
# before each node: the other two members must be healthy
talosctl -n rock2.vluwte.nl etcd status

kubectl cordon rock1
kubectl drain rock1 --ignore-daemonsets --delete-emptydir-data
talosctl -n rock1.vluwte.nl reboot

# after it comes back
talosctl -n rock1.vluwte.nl etcd status
talosctl -n rock1.vluwte.nl netstat -l -t | grep 2381
kubectl uncordon rock1
Then the same for rock2 and rock3.
| Node | Patched | Rebooted | 2381 listening | Uncordoned |
|---|---|---|---|---|
| rock1 | ✅ | ✅ 26 Sep | ✅ | ✅ |
| rock2 | ✅ | ✅ 26 Sep | ✅ | ✅ |
| rock3 | ✅ | ✅ 26 Sep | ✅ | ✅ |
A side effect of the reboots
Garage, again. After rock3's reboot, Garage came back with its old node ID, the same failure described in The Reboot That Broke Garage. This time Silent Failures caught it instead of leaving it unnoticed for sixteen hours. A kubectl rollout restart fixed it; the underlying mount-order problem remains on the to-do list.
The Scrape Job
In the serverFiles section of apps/monitoring/prometheus/prometheus-values.yaml, directly after the node-exporter job:
      - job_name: etcd
        static_configs:
          - targets:
              - rock1.vluwte.nl:2381
              - rock2.vluwte.nl:2381
              - rock3.vluwte.nl:2381
        relabel_configs:
          # same node derivation as the node-exporter job, copy its exact rule
          - source_labels: [__address__]
            regex: '([^.]+)\..*'
            target_label: node
            replacement: '$1'
The relabel rule is the important part. It is the same rule the node-exporter job uses, built in Prometheus Storage Overhead: take the target address rock1.vluwte.nl:2381, keep everything before the first dot, and write it to node. The result is that etcd's series and node-exporter's disk series carry the same node="rock1", so they can be joined on(node) in a single query. That join is what the next post runs on. The Alert That Named a Pod is the story of what happens when a job skips this step.
The targets are static on purpose. There are three control-plane hosts and no Service to discover them through. The price of static targets is that nothing updates them when the control plane changes, and that is the third thing the alert below has to cover.
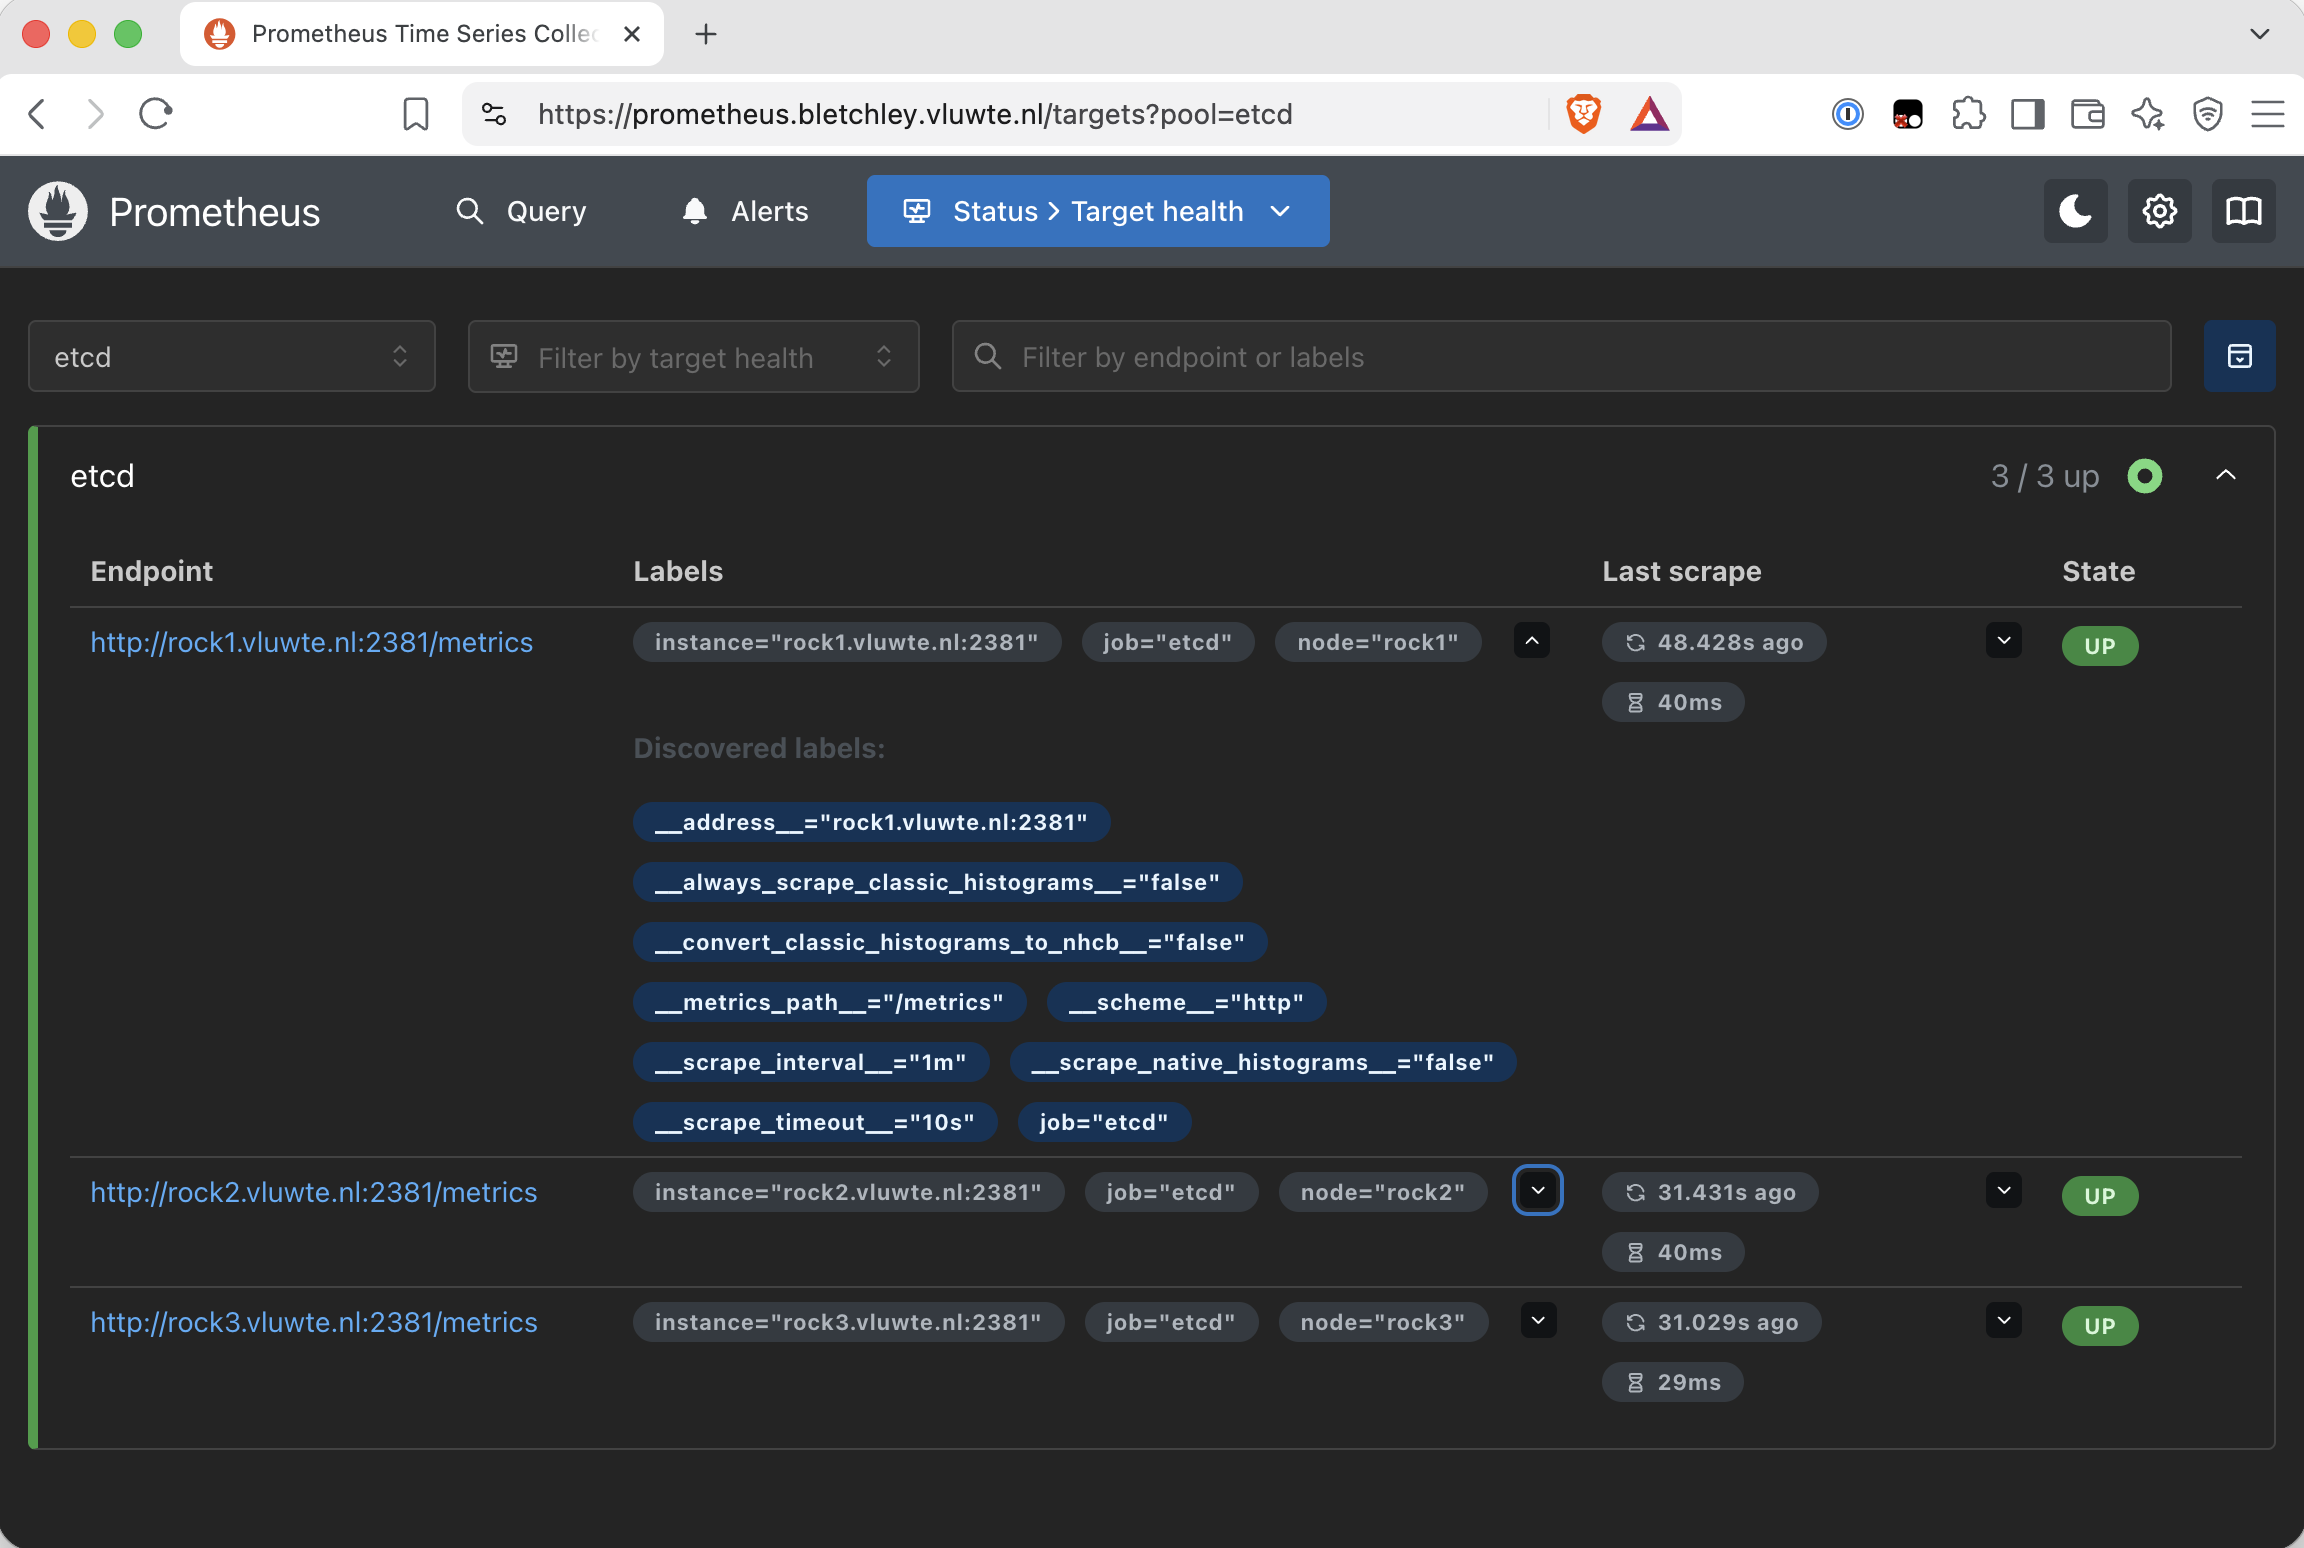
After a helm upgrade, all three targets came up on the Prometheus Targets page.
Alerts for a Metric That Can Go Quiet
Teaching Prometheus to Read an eMMC was built around one idea: a healthy disk and a dead collector both produce a flat line, so the collector needs watching too. The etcd job has the same problem in a different shape. If the listener patch gets lost, the etcd graphs go empty and nothing fires. Empty is not an error to Prometheus.
There are three ways for this job to go quiet, and one rule covers all three. It sits in the monitoring group, next to the eMMC exporter rules:
          # -- etcd metrics ----------------------------------------------------
          # Fires when a member's metrics endpoint (2381) stops answering,
          # or the whole job disappears. etcd itself may be fine: the usual
          # cause is the listener patch missing after a config regeneration.
          - alert: etcdExporterDown
            expr: |
              up{job="etcd"} == 0
              or absent(up{job="etcd"})
              or count(up{job="etcd"})
                 < (count(kube_node_role{role="control-plane"}) or count(kube_node_role{role="master"}))
            for: 5m
            labels:
              severity: warning
            annotations:
              summary: "etcd metrics unavailable{{ if $labels.node }} on {{ $labels.node }}{{ end }}"
              description: "Nothing answers on :2381. Check `talosctl -n <node> netstat -l -t | grep 2381` and that etcd-metrics.patch.yaml is still applied."
| Clause | Catches | Example |
|---|---|---|
up{job="etcd"} == 0 |
A target that is configured but not answering | The patch lost after a config regeneration, or a node down |
absent(up{job="etcd"}) |
The job itself gone | The scrape job dropped from the values file |
count(up) < count(control-plane nodes) |
Fewer targets than control-plane nodes | A fourth control-plane node added, static target list never updated |
A few details that are easy to miss:
- The summary handles all three shapes. The first clause returns series that carry a
nodelabel, so the alert can name the member. The other two return a single series with no labels at all. The{{ if $labels.node }}keeps the summary readable in both cases instead of ending in "on ". role="master"is a fallback for the older control-plane label, in case kube-state-metrics or a future Talos version reports it that way.- The description is written for whoever has forgotten this post, which will probably be me. It names the most likely cause and the command that checks it.
The hole in the third clause
The third clause compares the number of targets with the number of control-plane nodes, as reported by kube-state-metrics. If kube-state-metrics stops publishing kube_node_role, the right-hand side is empty, the comparison returns nothing, and the clause can never fire. It fails quiet, which is exactly what this rule exists to prevent.
So it has a companion, next to the existing node-count rule from the eMMC post:
          # The one place the cluster control-plane size is written down.
          # When this fires after a deliberate change, update the 3 here.
          - alert: ControlPlaneNodeCountChanged
            expr: |
              (
                count(kube_node_role{role="control-plane"})
                or count(kube_node_role{role="master"})
                or vector(0)
              ) != 3
            for: 1h
            labels:
              severity: info
            annotations:
              summary: "Cluster has {{ $value }} control-plane nodes, expected 3"
              description: "The control-plane count differs from the recorded size. If a node was added or removed on purpose, update this rule and the etcd scrape targets. A value of 0 means kube-state-metrics is not publishing kube_node_role, and etcdExporterDown's member-count check cannot fire until it is back."
The or vector(0) is the same trick as in the 7-node rule: it turns "no data" into a 0, and 0 is not 3, so the rule fires when kube-state-metrics goes quiet. It also makes this rule the single place where the size of the control plane is written down. If I ever add a fourth control-plane node, this fires, and its description tells me to update the etcd targets in the same change.
Testing it
A rule that has never fired is a rule I hope works. So I broke one target on purpose: in the scrape job, I changed rock3's port from 2381 to 2382, where nothing listens, and waited out the for: 5m.
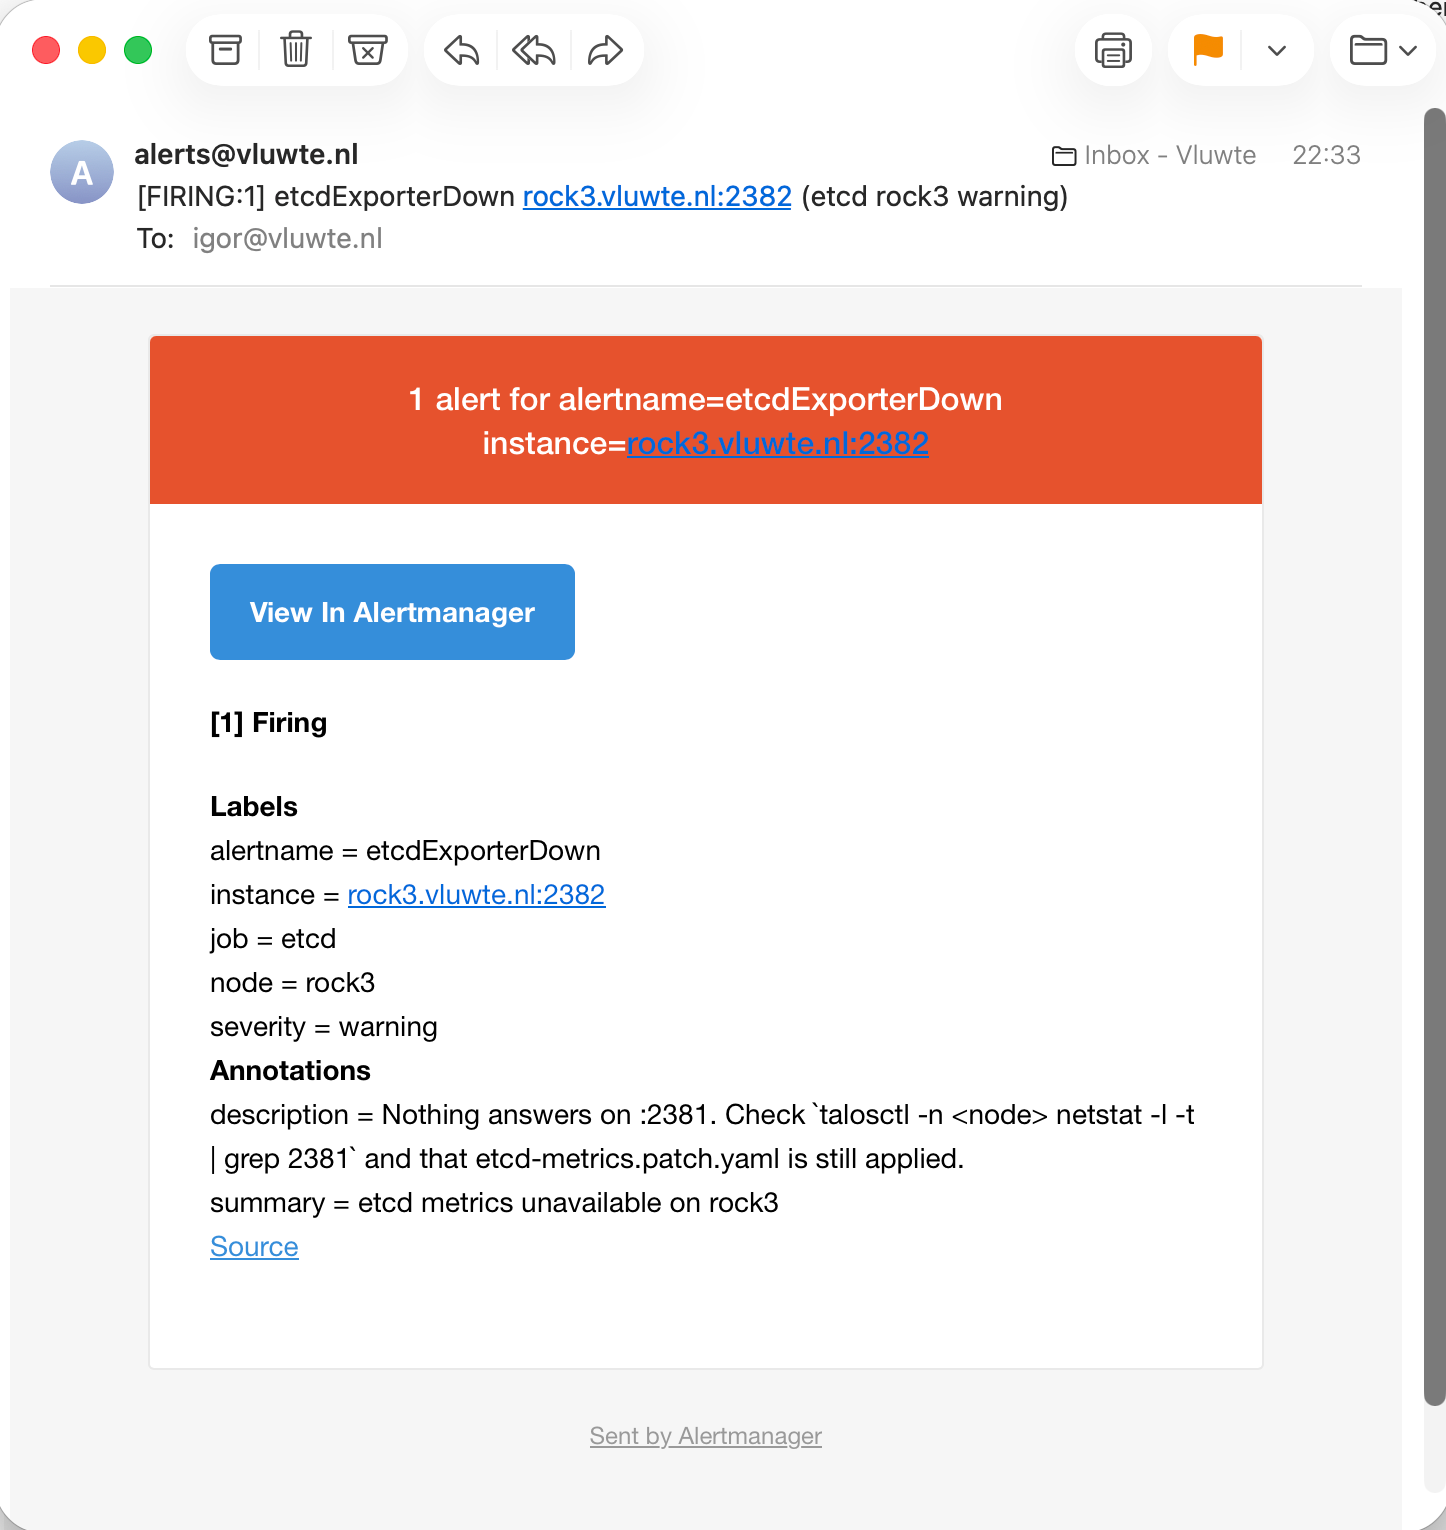
The email names the node, not just the address, and the summary reads "on rock3" because the first clause carries the node label. With the port put back, the alert resolved. I tested only the first clause this way; the other two return label-less series, and the summary template is written to cope with that, but I have not watched them fire.
One trade-off I left as it is: a rolling reboot may keep a member's endpoint down for longer than the five-minute for:, so maintenance could set this off. A warning during maintenance is a smaller problem than a long delay before it fires when the patch has really gone missing, so for: 5m stays.
Checking It Works
From any machine on the cluster VLAN, without Prometheus:
curl -s http://rock1.vluwte.nl:2381/metrics | grep '^etcd_disk_wal_write_bytes_total'
One quirk: etcd_disk_wal_write_bytes_total is declared a gauge in etcd's metadata, but it only ever goes up. rate() works on it as on any counter. Prometheus may print a "might not be a counter" hint in the query editor; it can be ignored.
A dashboard
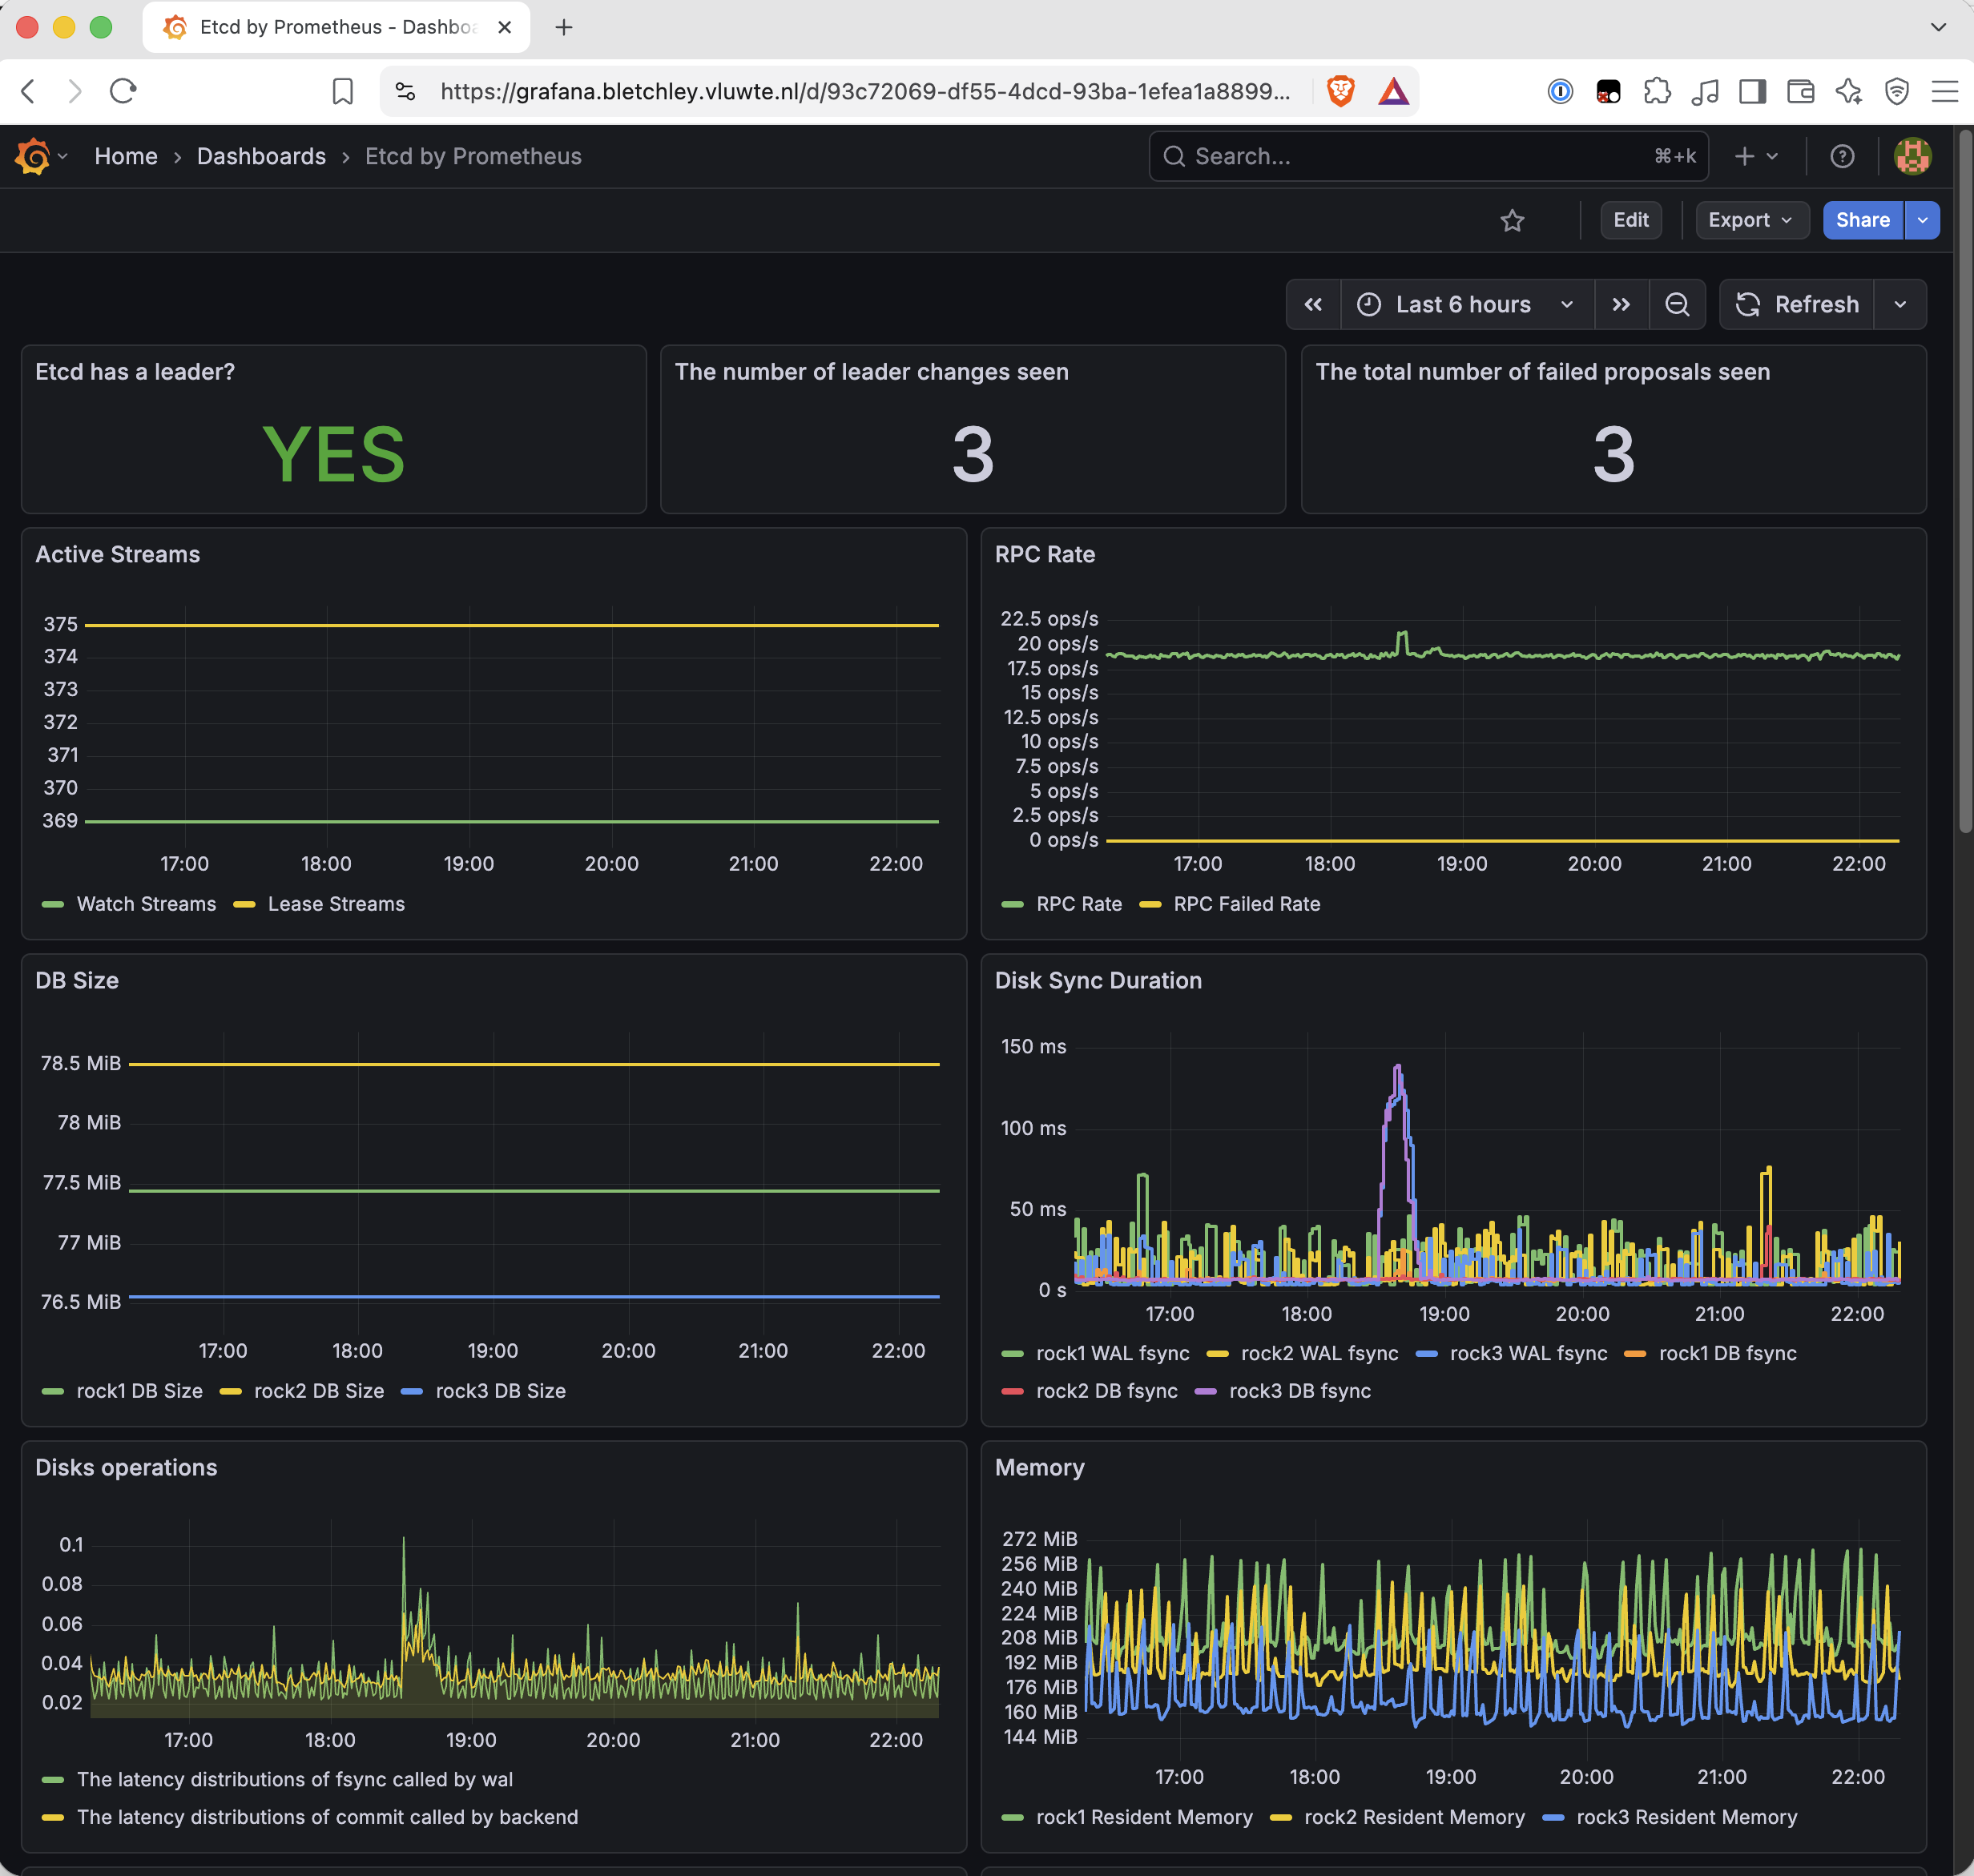
For a quick overview I imported the community dashboard Etcd by Prometheus (ID 3070). Two kinds of panel came up empty, for different reasons:
- Every
rate(...[1m]). The dashboard was written for a 15-second scrape. Bletchley scrapes every minute, so a one-minute window rarely holds the two samplesrate()needs. I changed the windows to[5m]. - DB Size. It queries
etcd_debugging_mvcc_db_total_size_in_bytes, a name from etcd 3.3 and earlier. On etcd 3.6 it isetcd_mvcc_db_total_size_in_bytes.
One panel was not empty but wrong: Memory plotted process_resident_memory_bytes with no filter, which is every process Prometheus scrapes, Prometheus included. {job="etcd"} leaves the three members.
The First Number
The metric I came for is etcd_disk_wal_write_bytes_total: every byte etcd appends to its write-ahead log, the file it writes before anything else. If etcd is responsible for 13 GB a day of extra writes, this is where it should show.
I could not wait for a day of data, so I read rock1's counter twice by hand, five minutes apart, shortly after its reboot:
| Value | |
|---|---|
| First read | 2,816,328 B |
| Second read, 300 s later | 4,935,976 B |
| Difference | ~2.12 MB |
| Rate | ~7 KB/s, or ~610 MB a day |
A day later, Prometheus agreed, and it agreed on all three members:
rate(etcd_disk_wal_write_bytes_total[1h]) * 86400 / 1e9
About 0.6 GB a day. (While rock3 rejoined after its reboot, its numbers ran higher for about an hour as it caught up with the other two, and then settled at the same level.)
The gap between a control-plane eMMC and a worker's is about 13 to 15 GB a day. etcd's write-ahead log accounts for roughly 4% of it.
The obvious suspect, now measured, appends about a twenty-fifth of what I had been blaming it for. Either the caption in The Disk With No S.M.A.R.T. was wrong, or bytes appended are not the same thing as bytes that reach the device. That is the next post.
What's Working Now
- ✅ etcd metrics on port 2381 on rock1, rock2 and rock3, plain HTTP, metrics and health only
- ✅ A Prometheus job
etcdwith three static targets and anodelabel that matches node-exporter's - ✅
etcdExporterDown, covering a target that stops answering, a job that disappears, and fewer targets than control-plane nodes - ✅
ControlPlaneNodeCountChanged, the one place the control-plane size is recorded, and the guard for the alert above - ✅ The patch in git, with a standing rule: regenerate the machine configs, reapply
etcd-metrics.patch.yaml - ⚠️ Known limitation: nothing prevents the patch from being dropped. The alert only makes sure I find out
Lessons Learned
- "Applied" is about the config, not the process. Talos applied the change correctly and needed no reboot to do so. etcd still ran with its old arguments. When a change only matters to a running process, check the process.
- On Talos, etcd is not a pod. Anything that discovers pods, from cAdvisor to the
kubernetes-podsscrape job, will never find it. It needs its own job. - An exporter you add is an exporter that can go quiet. Every new scrape job needs an
uprule, and a job with static targets needs a count check as well, or its targets drift out of date without a sound. - Measure the suspect before writing the caption. I wrote "the three control-plane lines are etcd" without a single etcd metric. The first one I collected says the story is at least more complicated than that.
What's Next
The next post takes the 96% that the write-ahead log does not explain, and follows it through etcd's other counters, the apiserver, cAdvisor and Loki until every gigabyte on every eMMC has a name.
← Previous: Wear Without Writes
Questions or suggestions? Leave a comment below or reach out at igor@vluwte.nl.