Teaching Prometheus to Read an eMMC
A flat line can mean a healthy eMMC or a dead collector. An arm64 exporter, eleven tested alert rules and a dashboard that tell the two apart.
Introduction
The Disk With No S.M.A.R.T. ended with a deliberately unresolved problem: the 32 GB eMMC on every RK1 in Bletchley has no S.M.A.R.T. interface, yet it holds etcd, containerd's image store, kubelet state and every log line. On a control-plane node, that is around 15 GB of writes a day.
The device does report its health, through two registers the kernel exposes in sysfs: life_time and pre_eol_info. Until now, nothing in the cluster was watching them. I could read them by hand, but that only told me what the device said today. And life_time reports in 10%-wide buckets, so the most useful event is not that a device is in its second bucket rather than its first. It is the date it first leaves the first bucket, and if nothing is watching continuously, that date is lost.
So this post closes that gap: a small arm64 exporter reads the two registers from /sys, Prometheus watches the exporter as well as the eMMC, and Grafana puts the resulting health signals next to the write rate that was already being collected.
The interesting part is not the Go code. A value that may not change for years creates an odd problem: a healthy disk and a broken collector both produce the same flat line, so the monitoring itself becomes something that needs watching. Most of this post is about that: how a nearly static metric proves its collector is still alive, how to keep Kubernetes labels from changing the identity of the data, and how to test alerts that are supposed to stay quiet for years. The YAML is in the addendum; the Go source, Dockerfile and Makefile are available on request.
🔭 This is part of the Cluster Observability series - making the Bletchley cluster observable, from metrics and logs to the alerts built on them.
- Cluster-Wide Certificate Expiry Monitoring
- Teaching Prometheus to Read an eMMC (you are here)
This post builds on The Disk With No S.M.A.R.T., which explains why the eMMC was never monitored and what its two registers mean.
Where it stood
Two registers, both plain sysfs files under the RK3588's eMMC controller:
| Register | Values | Closest NVMe analogue |
|---|---|---|
pre_eol_info |
0x01 normal, 0x02 warning (80% of reserve blocks used), 0x03 urgent |
available_spare: a count of things that happened |
life_time |
TYP_A and TYP_B, each 0x01 to 0x0A in 10% steps, 0x0B exceeded |
percentage_used, but derived from erase counts |
life_time has two values because an eMMC's flash has two regions that wear differently: a small, durable SLC region (TYP_A) and the denser MLC bulk (TYP_B). The controller estimates each separately, so both need exposing. On these modules they have always agreed: 0x01 on six nodes, 0x02 on rock5.
None of this was monitored, by design of the tool rather than by decision: the smartctl exporter cannot see a device without S.M.A.R.T.
Why an exporter, and not something smaller
I looked at five ways to get these values into Prometheus:
| Option | Outcome |
|---|---|
DaemonSet exporter reading /sys |
Chosen. Two file reads and a read-only hostPath; no privileged device access |
Quarterly talosctl read by hand |
Produces no time series, rounds the first-tick date to the nearest quarter and is easily forgotten |
| node_exporter textfile collector | No custom image, but a second workload, a shared writable hostPath and a stale file that looks healthy |
An mmc collector in node_exporter itself |
The right long-term home, far too slow for this |
Privileged pod running mmc extcsd read |
Device access and a privileged pod to get two bytes sysfs already gives away |
The textfile collector is the one that came closest, and it is the one anyone already running node_exporter will ask about. It needs no custom image, which is a real advantage. But something still has to read the registers and write the .prom file, so it means a second workload, plus a writable hostPath shared between that writer and node-exporter. More moving parts for the same few gauges. The deciding weakness is what happens when the writer stops: node-exporter keeps serving the last file it saw, and a frozen value looks exactly like a healthy eMMC. Catching that would mean building staleness handling into the writer, which is most of an exporter anyway.
What made the exporter cheap enough to win is that the registers are plain files. Two reads from a read-only /sys mount need no ioctl, no privileged device access and no vendor tooling.
Step 1: the exporter image
A small Go program, standard library only. No client_golang, no go.sum, nothing for Renovate to chase except the builder image. The runtime image is scratch. It publishes seven metrics:
emmc_pre_eol_info{node,device}                  1 normal, 2 warning, 3 urgent
emmc_life_time_est{node,device,type}            1..11, type = typ_a | typ_b
emmc_reading_timestamp_seconds{node}            last successful read, 0 = never
emmc_devices_discovered{node}
emmc_read_errors_total{node,device,attribute}
emmc_device_info{node,device,name,manfid,oemid,hwrev,fwrev,date}
emmc_exporter_build_info{node,version,goversion,goarch}
Four design decisions do most of the work, and none of them is about Go.
TYP_A and TYP_B are a label, not two metrics. They are the same estimate for the two regions of cells described above. As one metric with a type label, "the worst of the two" is max by (node, device) (emmc_life_time_est), which is exactly what the alert rules and the dashboard need.
A missing reading is no metric, never a zero. A register that is absent, unreadable or reads 0x00 simply does not appear. A zero would be a plausible-looking value that means nothing.
The liveness stamp only moves on success. These values will sit at 1 for years, and a healthy eMMC and a stuck exporter look identical on a graph. So emmc_reading_timestamp_seconds advances only when a read actually succeeds. An exporter that is running but no longer reading shows up as a stamp that stops moving, which is something an alert can see.
The exporter owns the node label, and refuses to start without it. The node name comes from the downward API. If it is empty, the process exits rather than fall back to the hostname, which inside a pod is the pod name. The Alert That Named a Pod was entirely about that mistake.
It reads sysfs every five minutes and serves the cached values. Prometheus scrapes every two. That split is deliberate: Prometheus's lookback window is five minutes, so a scrape interval at or above it leaves gaps where queries find nothing, and a rule that finds nothing cannot fire.
Building for arm64
This time I build the image myself, with docker build --platform linux/arm64. The Makefile has one cheap check before anything is pushed: it reads the image manifest, then runs the binary and lets it report its own platform and Go version:
igor@granite exporter % make verify-arch
docker image inspect --format '{{.Architecture}} {{.Os}}' 10.0.0.80:5000/emmc-exporter:0.1.1
arm64 linux
docker run --rm --platform linux/arm64 10.0.0.80:5000/emmc-exporter:0.1.1 -version
emmc_exporter 0.1.1 (go1.27.1 linux/arm64)
That second line is also where the version number matters. It says 0.1.1, not the 0.1.0 I first built and pushed. The first build used golang:1.25-alpine, which has known vulnerabilities. A scratch runtime image does not help there: the Go toolchain and standard library are compiled into the binary, so the builder's Go version is what ships. I rebuilt on golang:1.27-alpine under a new tag rather than overwriting the old one.
Step 2: deploying the exporter
One DaemonSet and one Service in monitoring, both in the addendum. The DaemonSet tolerates the control-plane taint, because the three control-plane nodes are the ones that matter most here. Reading the registers needs only one thing from the host: its /sys, mounted read-only at /host/sys. No other privileges are needed. The container runs as non-root, drops all capabilities, has a read-only root filesystem and uses the RuntimeDefault seccomp profile.
Every other workload in monitoring is installed by Helm, and Helm sets the app.kubernetes.io/* labels for free. A hand-written manifest has to set them itself, so I matched what is already there: name: emmc-exporter, instance: emmc-exporter, component: metrics. Only name is functional, since the DaemonSet selector, the Service and the scrape job all match on it. It is also the one to get right first time, because a DaemonSet's selector cannot be changed later.
The apply prints a PodSecurity warning about the hostPath volume. It is expected: the monitoring namespace enforces privileged, which admits the mount, and the warning only prints. Where that warning comes from, and what else in the cluster triggers it, is a post of its own.
Seven pods, one per node across both boards, all Running within twelve seconds. Their startup logs contain the line that matters:
emmc-exporter-hsgqp exporter 2026/09/22 19:16:51 emmc_exporter 0.1.1 starting: node=rock1 sysfs=/host/sys refresh=5m0s devices=1
emmc-exporter-tmgx8 exporter 2026/09/22 19:16:51 emmc_exporter 0.1.1 starting: node=rock5 sysfs=/host/sys refresh=5m0s devices=1
emmc-exporter-zhn4b exporter 2026/09/22 19:16:52 emmc_exporter 0.1.1 starting: node=rock3 sysfs=/host/sys refresh=5m0s devices=1
node= is a node name on all seven, not a pod name. devices=1 means discovery found exactly one eMMC against the real sysfs tree on every node. And no ImagePullBackOff on rock5 to rock7, which pull from the local registry on the second board, something that has tripped me up before.
Step 3: Prometheus
The scrape job
The scrape job discovers the pods, keeps those labelled app.kubernetes.io/name: emmc-exporter, and sets instance to the node name. It deliberately does not set node.
That is the opposite of the advice I wrote down after The Alert That Named a Pod, and the reason is ownership. The exporter already publishes node. If the scrape job sets it as well, Prometheus keeps the target's value and renames the exporter's to exported_node. Every rule written against node then matches nothing, silently. One label, one owner.
The label I did not think about
The first version of the scrape job also kept a pod label, for debugging. Nothing alerted on it, so I reasoned it was harmless.
rock6 needed a physical re-seat for an unrelated reason, which made it the node reboot this build had been waiting for. The node label did exactly what it should: rock6 came back as node="rock6", with no exported_node and no pod IPs anywhere. And the dashboard drew eight tiles for a seven-node cluster, two of them rock6.
Nothing was wrong with the data. The replacement pod had a new name, so every rock6 series ended and a new one started, and for the length of the dashboard's time range both existed. A panel that turns each series into a tile drew rock6 twice.
Two changes: the pod label came out of the scrape job, and the panels and rules now aggregate max by (node) anyway, so a duplicate series can never become a duplicate tile or a double alert again. Then the cheap version of a reboot test: delete all seven pods at once.
igor@granite bletchley % kubectl -n monitoring delete pod -l app.kubernetes.io/name=emmc-exporter
Seven new pod names within forty seconds, and the dashboard stayed at seven tiles. The rule I took from it: a label that changes for reasons the measurement does not care about does not belong on the measurement. "Nothing alerts on it" was the wrong test.
Eleven alert rules
The rules went into three groups in prometheus-values.yaml, two existing and one new:
cluster(one rule): whether we still have 7 nodes in the cluster.hardware(four rules): what the device reports about itself.monitoring(new, six rules): whether we are still being told the truth about the device.
| Group | Rule | Fires when |
|---|---|---|
cluster |
ClusterNodeCountChanged |
count(kube_node_info) != 7, or kube-state-metrics returns nothing (severity info) |
hardware |
EMMCPreEOLWarning |
pre_eol_info > 1: the reserve pool is running out |
hardware |
EMMCLifeTimeFirstTick |
worst life-time bucket leaves 0x01 (severity info) |
hardware |
EMMCLifeTimeHigh |
worst bucket >= 5: at least 40% of rated endurance used |
hardware |
EMMCLifeTimeExceeded |
worst bucket >= 11: past the rated lifetime |
monitoring |
EMMCExporterStale |
last successful read more than an hour old |
monitoring |
EMMCExporterDown |
a target is down |
monitoring |
EMMCExporterMissing |
the whole job has disappeared |
monitoring |
EMMCNoDeviceFound |
an exporter found no eMMC |
monitoring |
EMMCCoverageIncomplete |
fewer nodes reporting than count(kube_node_info) |
monitoring |
EMMCReadErrors |
read or parse errors are increasing |
Two details from writing them.
The coverage rule reads the cluster size from kube-state-metrics instead of a literal 7. That makes kube-state-metrics a dependency: if it stops publishing, the comparison has nothing to compare against and the rule goes quiet. So the 7 does exist, in exactly one place: a separate info rule that fires when the node count differs from it, and also when kube-state-metrics returns nothing at all. Coverage follows the cluster automatically, and the one hard-coded number is attached to a rule whose whole job is to say when it is out of date.
And annotations are alert text, not code comments. One description used to end by explaining why the expression used unless. That is useful to whoever edits the file and useless to whoever reads the email. It moved into a YAML comment, and the description now says what the number means and what to do about it.
promtool check rules ran against the rules extracted back out of the values file, not against my source copy, because only the extracted file proves the merge:
igor@granite bletchley % yq '.serverFiles."alerting_rules.yml"' \
  apps/monitoring/prometheus/prometheus-values.yaml | \
  promtool check rules
Checking standard input
  SUCCESS: 85 rules found
Testing rules that cannot fire
Every eMMC in the cluster is healthy, so ten of these eleven rules cannot fire on real data, possibly for years. A rule I have never seen fire is a rule I am trusting on faith, including the delivery path behind it.
So I tested them the way I have tested alerts in earlier posts: move the threshold, not the data. Every rule can be made to fire against the live targets by changing a number or a matcher, then reverted. No fake exporter, no invented values, nothing running next to the seven real ones.
Four passes, in this order:
- Roll out the final rules, exactly as they will stay.
- Check everything is quiet and nothing fails to evaluate.
- Lower each threshold (and the
for:) until it fires. Observe, record. - Put the final rules back.
The order matters. Pass 2 establishes that silence means healthy, so pass 3 proves the rules can break that silence.
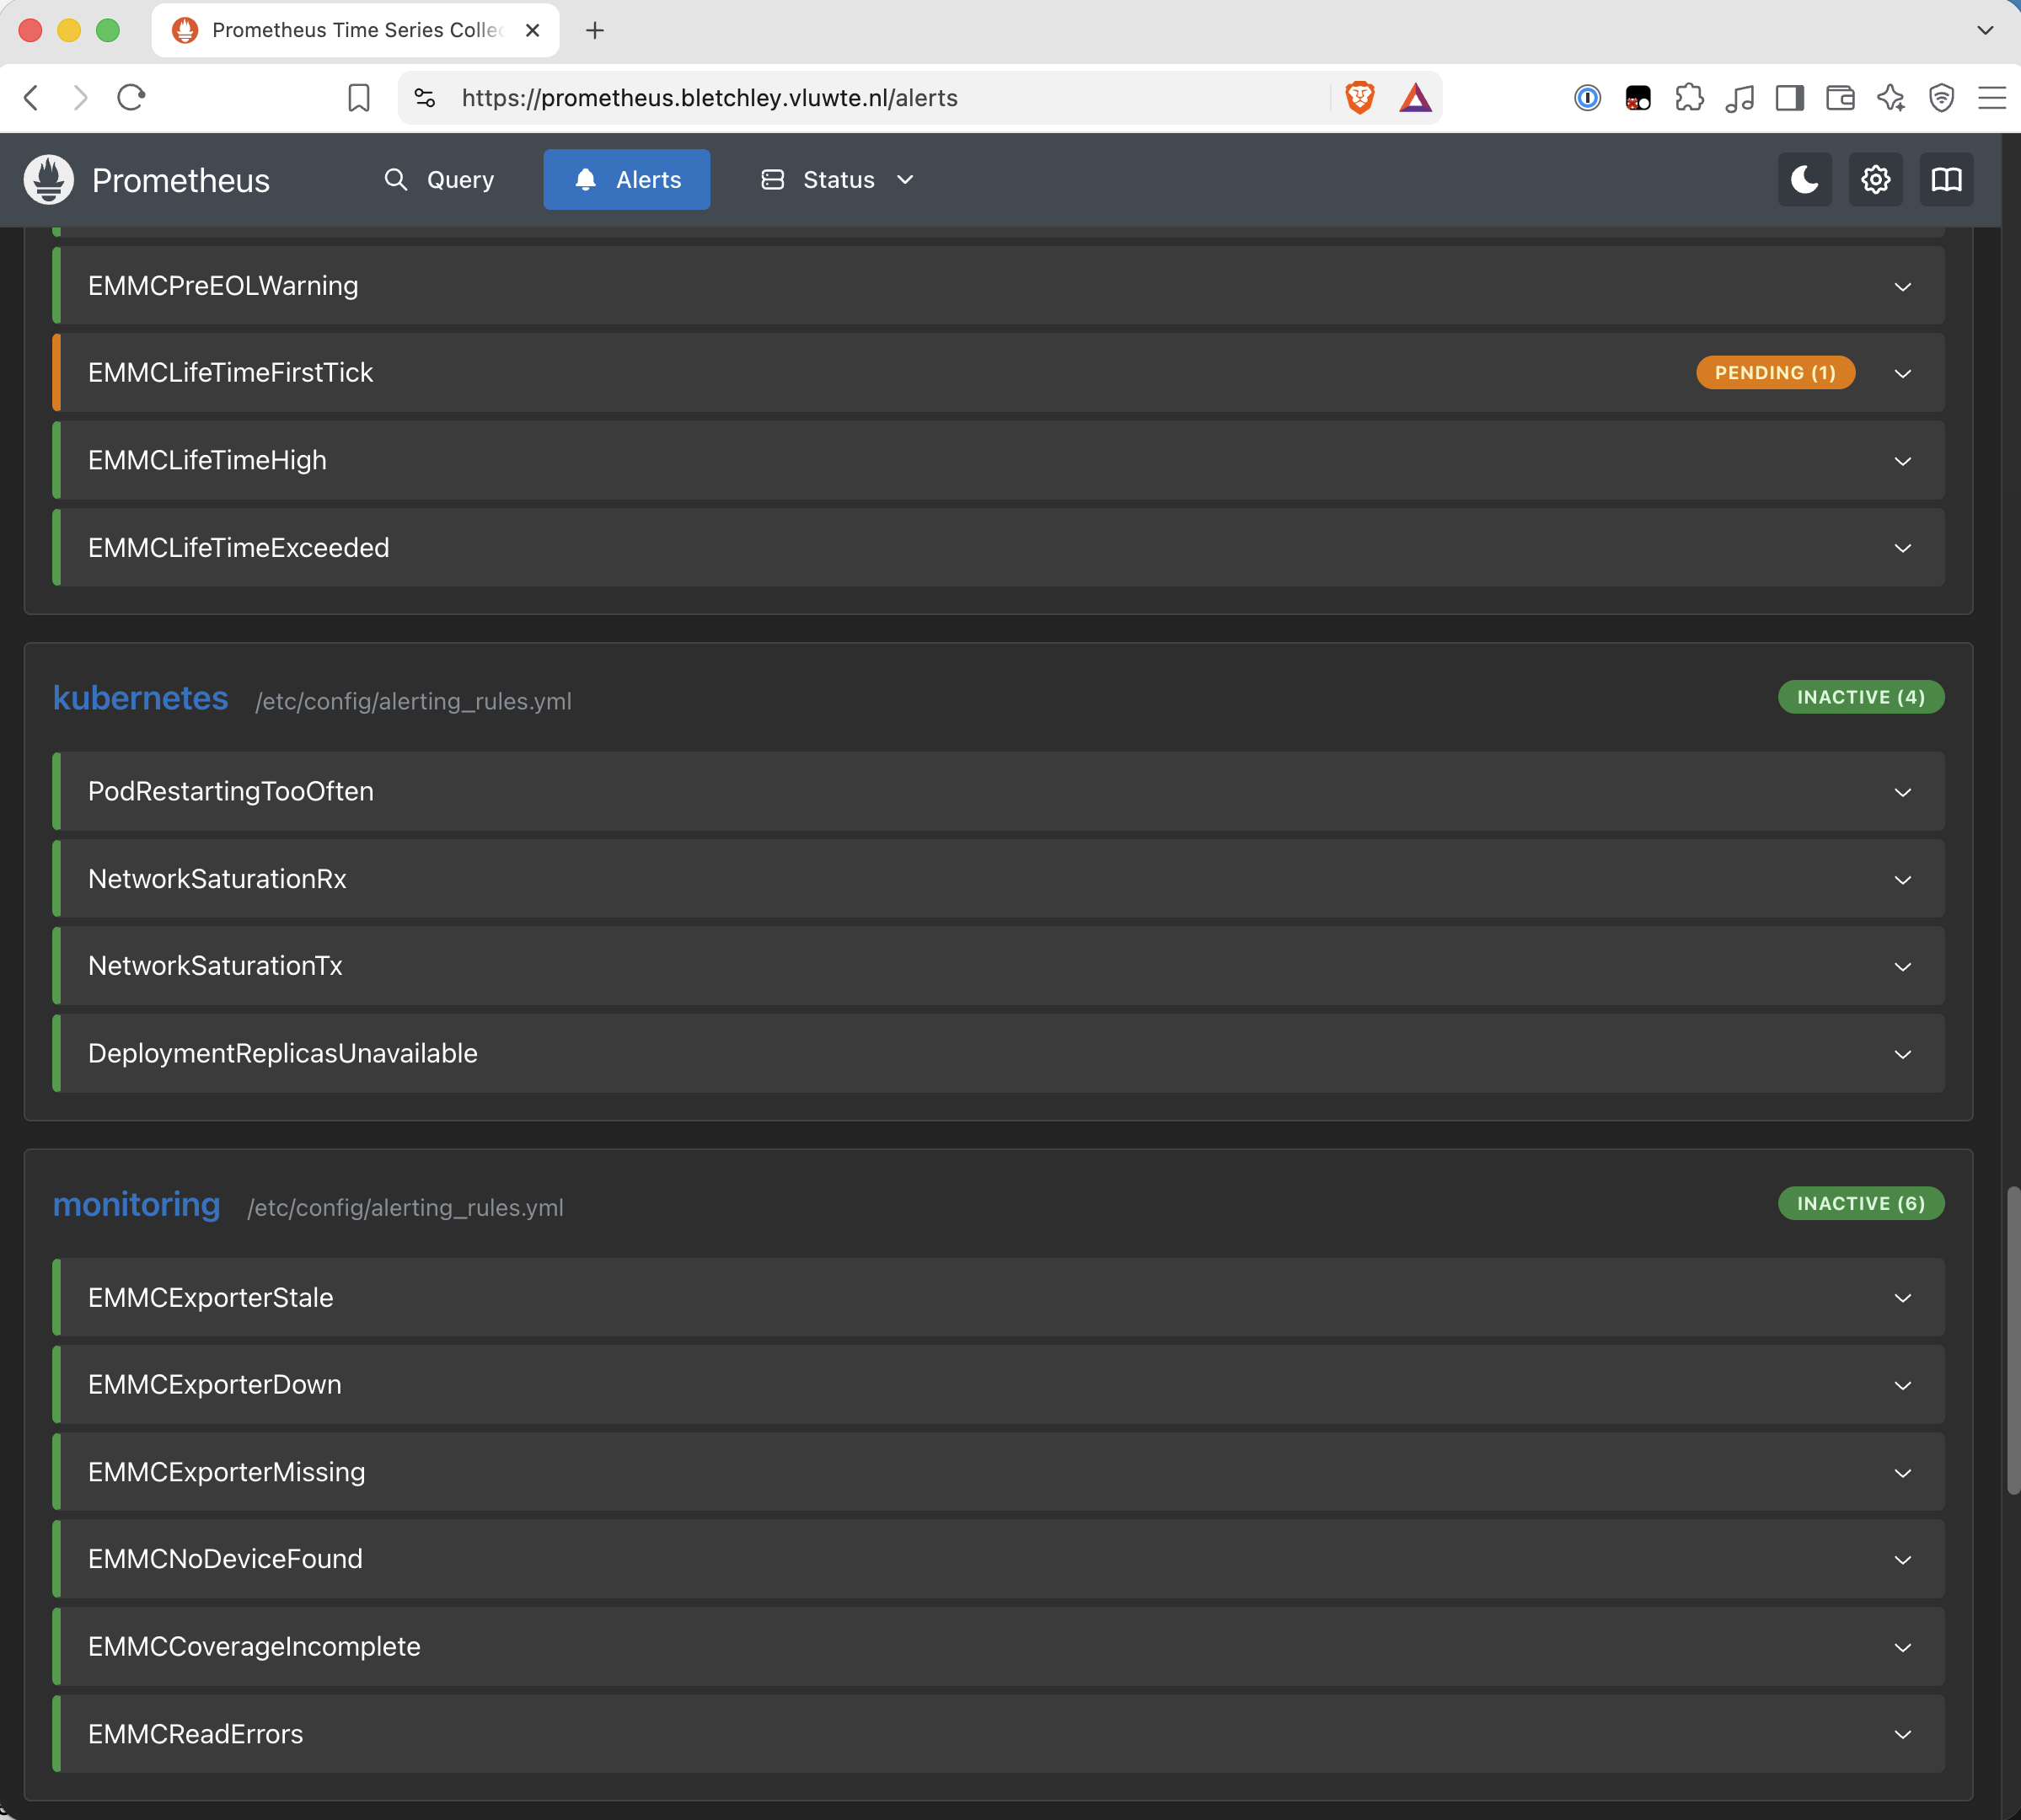
One rule was never going to be quiet. rock5 already reads 0x02, so EMMCLifeTimeFirstTick goes pending for it as soon as the rules load. It is the only one of the eleven that fired on real data with no change at all.
Pass 3, every other rule fired by a one-line change:
| Rule | Test change | Fired for |
|---|---|---|
ClusterNodeCountChanged |
!= 7 → != 8 |
1 |
EMMCPreEOLWarning |
> 1 → >= 1 |
7 |
EMMCLifeTimeFirstTick |
none | 1, rock5 |
EMMCLifeTimeHigh |
>= 5 → >= 2 |
1, rock5 |
EMMCLifeTimeExceeded |
>= 11 → >= 2 |
1, rock5 |
EMMCExporterStale |
> 3600 → > 60 |
7 |
EMMCExporterDown |
== 0 → == 1 |
7 |
EMMCExporterMissing |
job matcher → a name that does not exist | 1 |
EMMCNoDeviceFound |
== 0 → == 1 |
7 |
EMMCCoverageIncomplete |
< count(kube_node_info) → < count(kube_node_info) * 2 |
1 |
EMMCReadErrors |
> 0 → >= 0 |
7 |
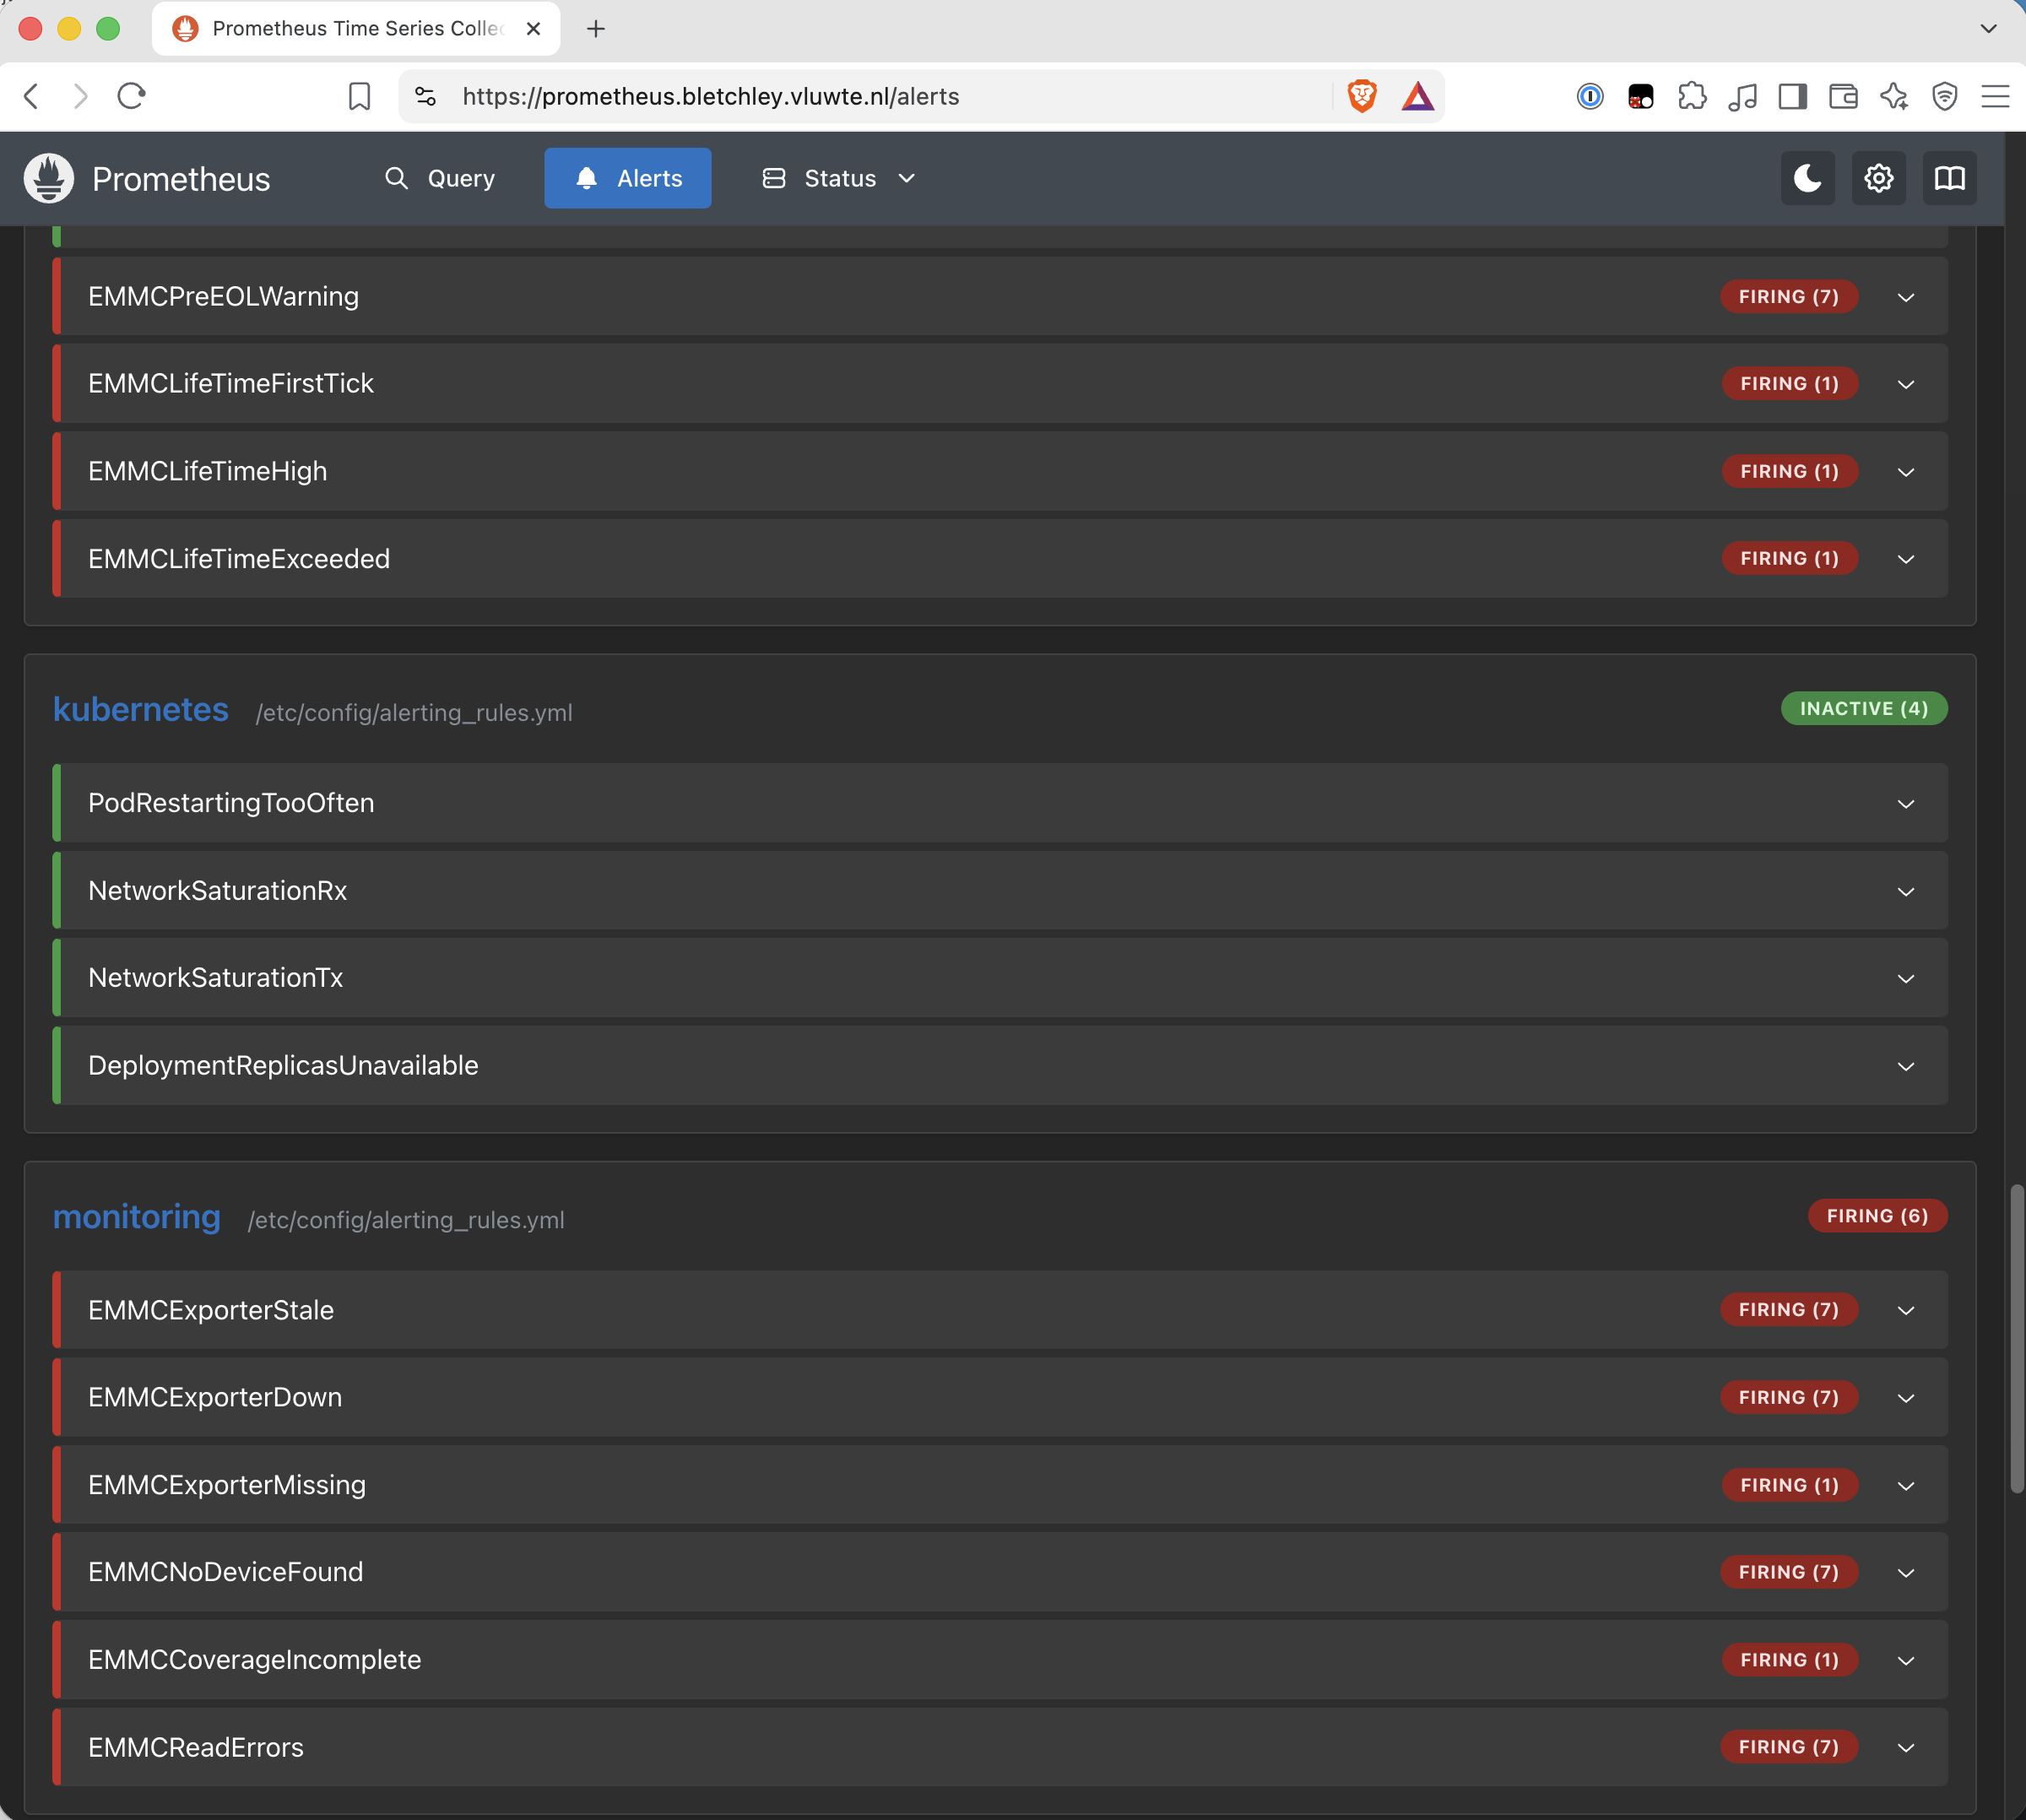
The eleventh rule is not in that screenshot. ClusterNodeCountChanged sits in the cluster group, further up the same page, and the three groups do not fit in one frame. It was tested the same way: != 7 became != 8, and it fired once, with a value of 7, the cluster's real node count.
I also pointed it at a metric name that does not exist, to exercise the fallback: it fired with a value of 0, which is what it will report if kube-state-metrics ever goes quiet.
EMMCReadErrors firing seven times is the detail I like most. It only has something to compare because the exporter emits a baseline emmc_read_errors_total{device="",attribute=""} 0 when nothing has failed, written so that increase() has a series to work from. Without it, this would have been the one rule no threshold could reach.
The mails arrived, severity: info included, and pass 4 put everything back: green, with rock5 pending again.
One thing I would not have noticed without doing it this way: reloading the rules restarts every for: clock. rock5 was pending, not firing, right after both pass 1 and pass 4. A quiet alerts page thirty seconds after a reload proves less than it looks like it does.
The silence for rock5
rock5's first tick is real, but it has no date. The module read 0x02 on 5 September and almost certainly arrived that way. So the alert is correct, permanent, and tells me nothing new. I silenced it rather than adding node != "rock5" to the rule, because a silence is visible, dated, attributed, and says why. An exception inside an expression is none of those.
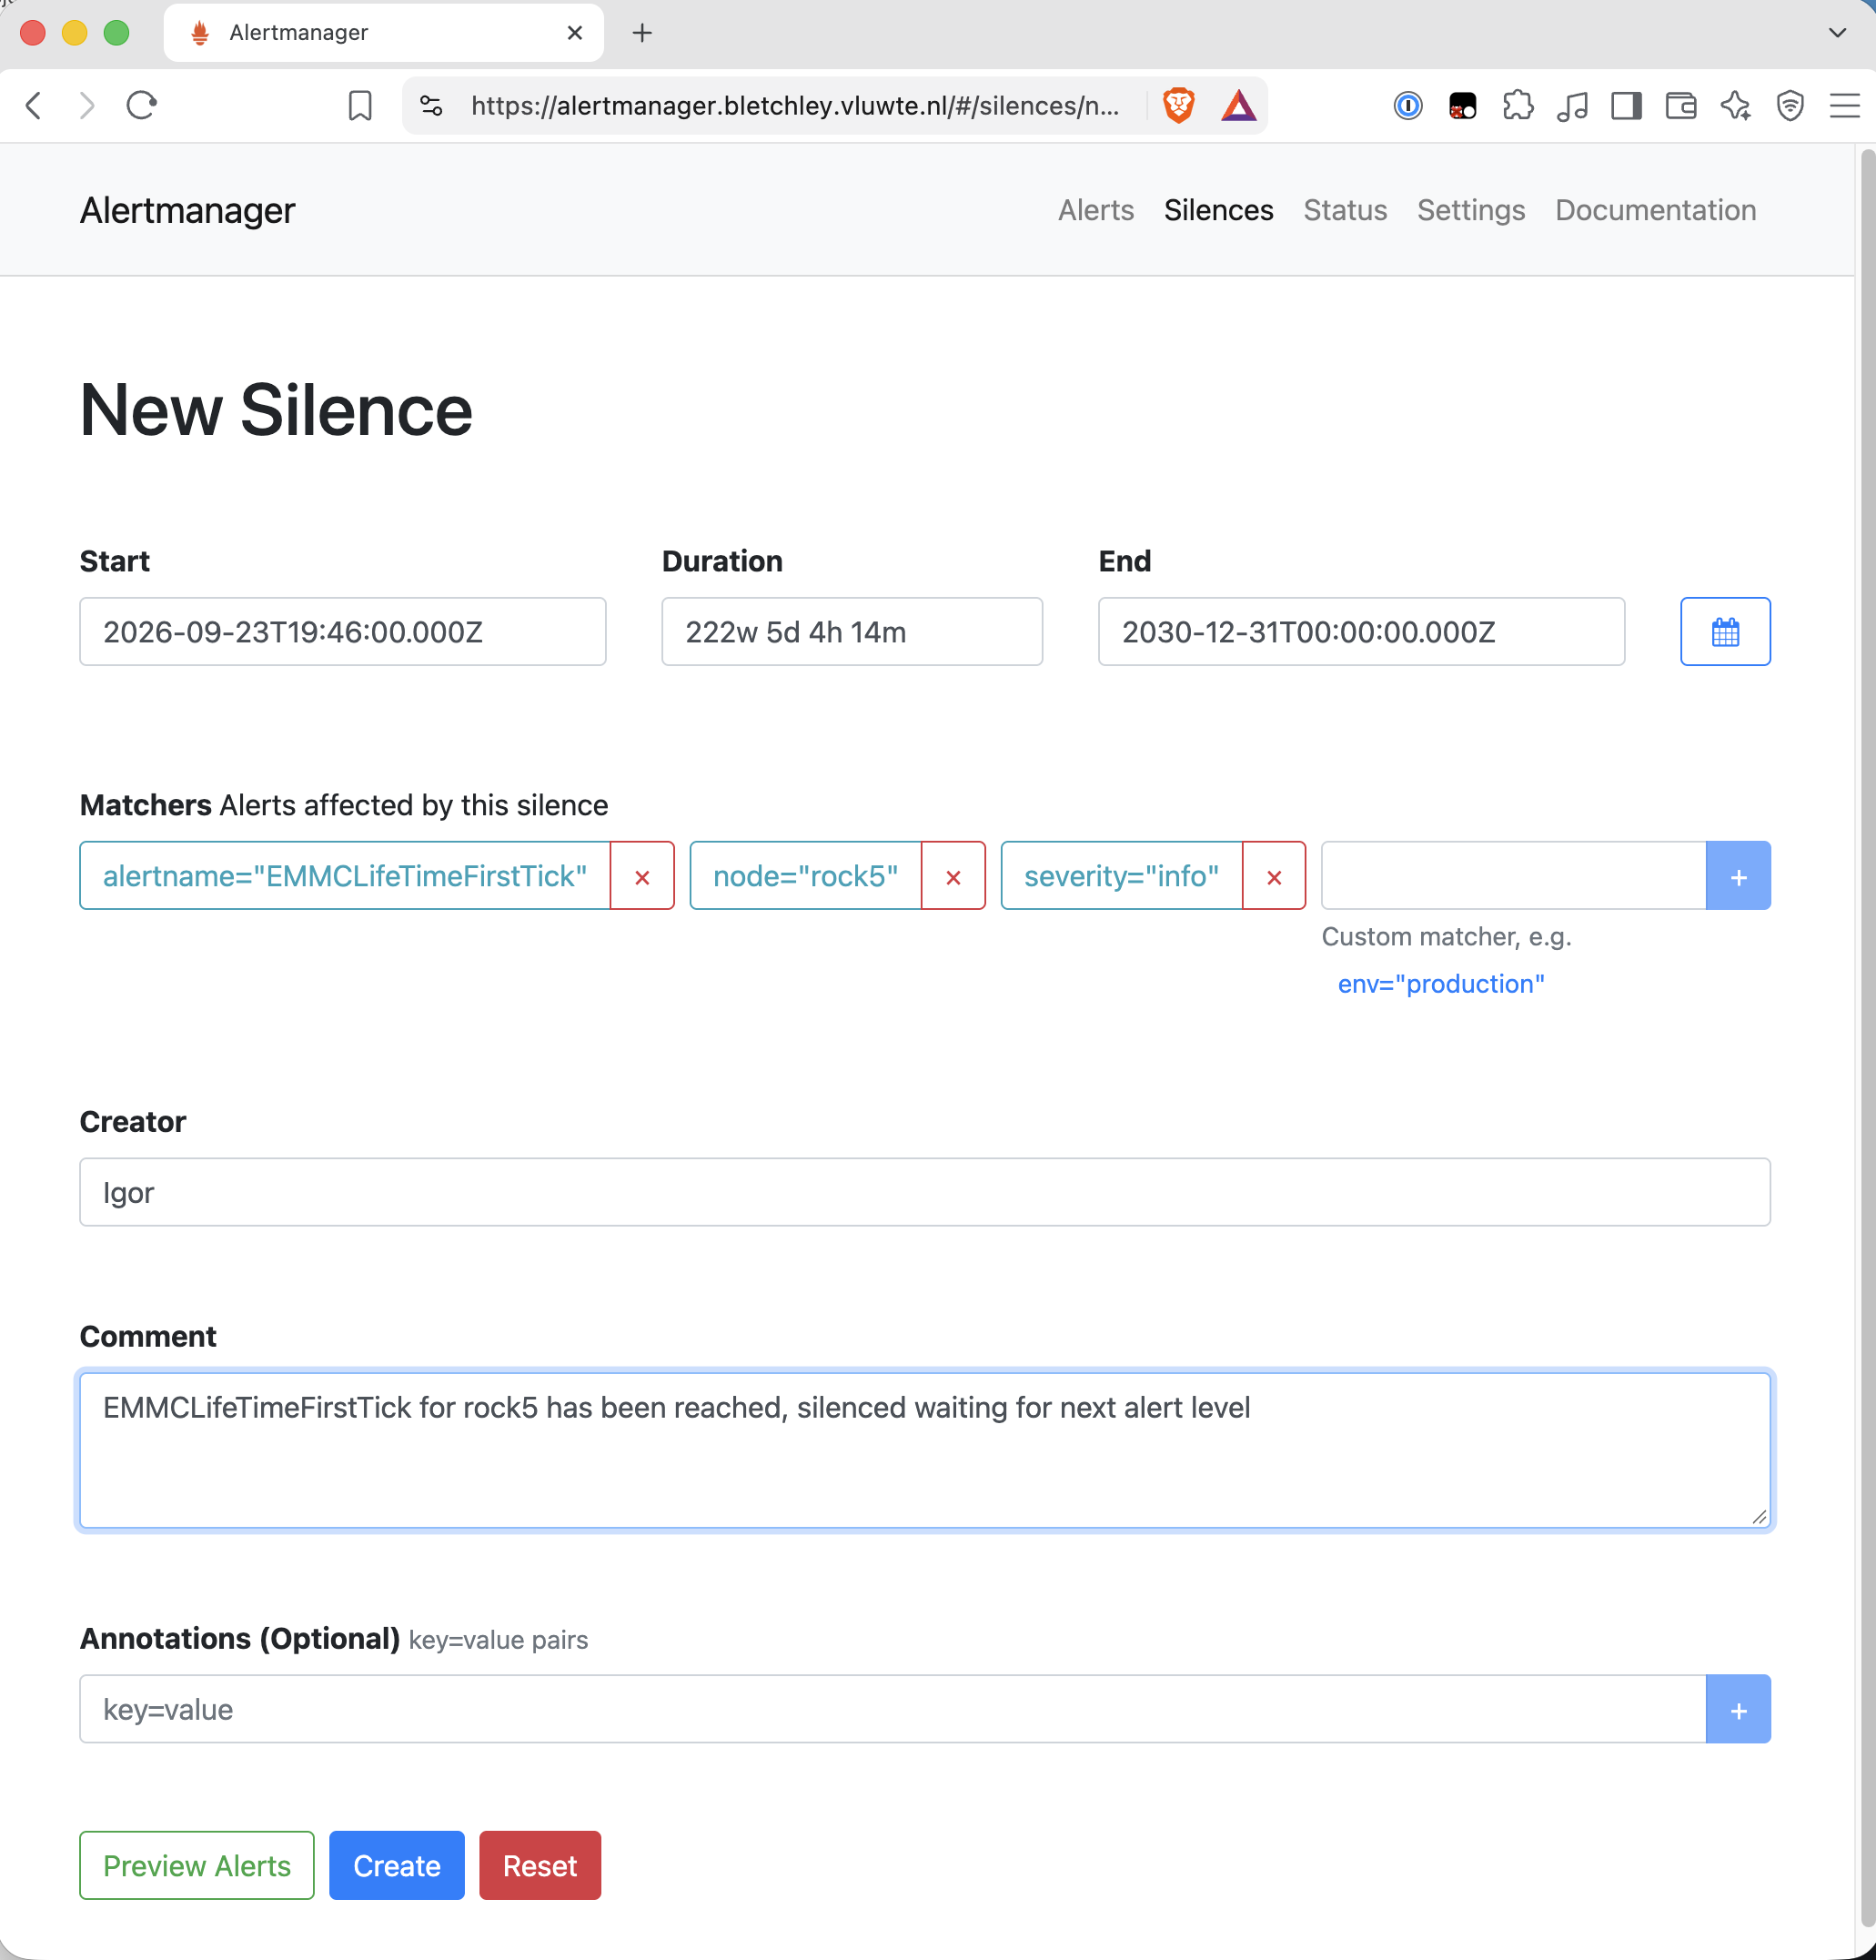
It matches on node, the label the exporter owns and that has now survived a power cycle and a full pod rotation. A silence keyed on pod would have lapsed quietly the next time Kubernetes replaced the pod. A silence is only as durable as the labels it matches on.
The severity="info" matcher is one more thing that has to stay true: change that rule's severity and the silence stops matching.
Step 4: the Grafana dashboard
Bletchley: Storage Wear is a new dashboard next to the S.M.A.R.T. dashboard from Cluster Observability Part 6, not a replacement for it. It was authored as JSON and is committed to the repo, which makes it the first dashboard here with a source of truth in git.
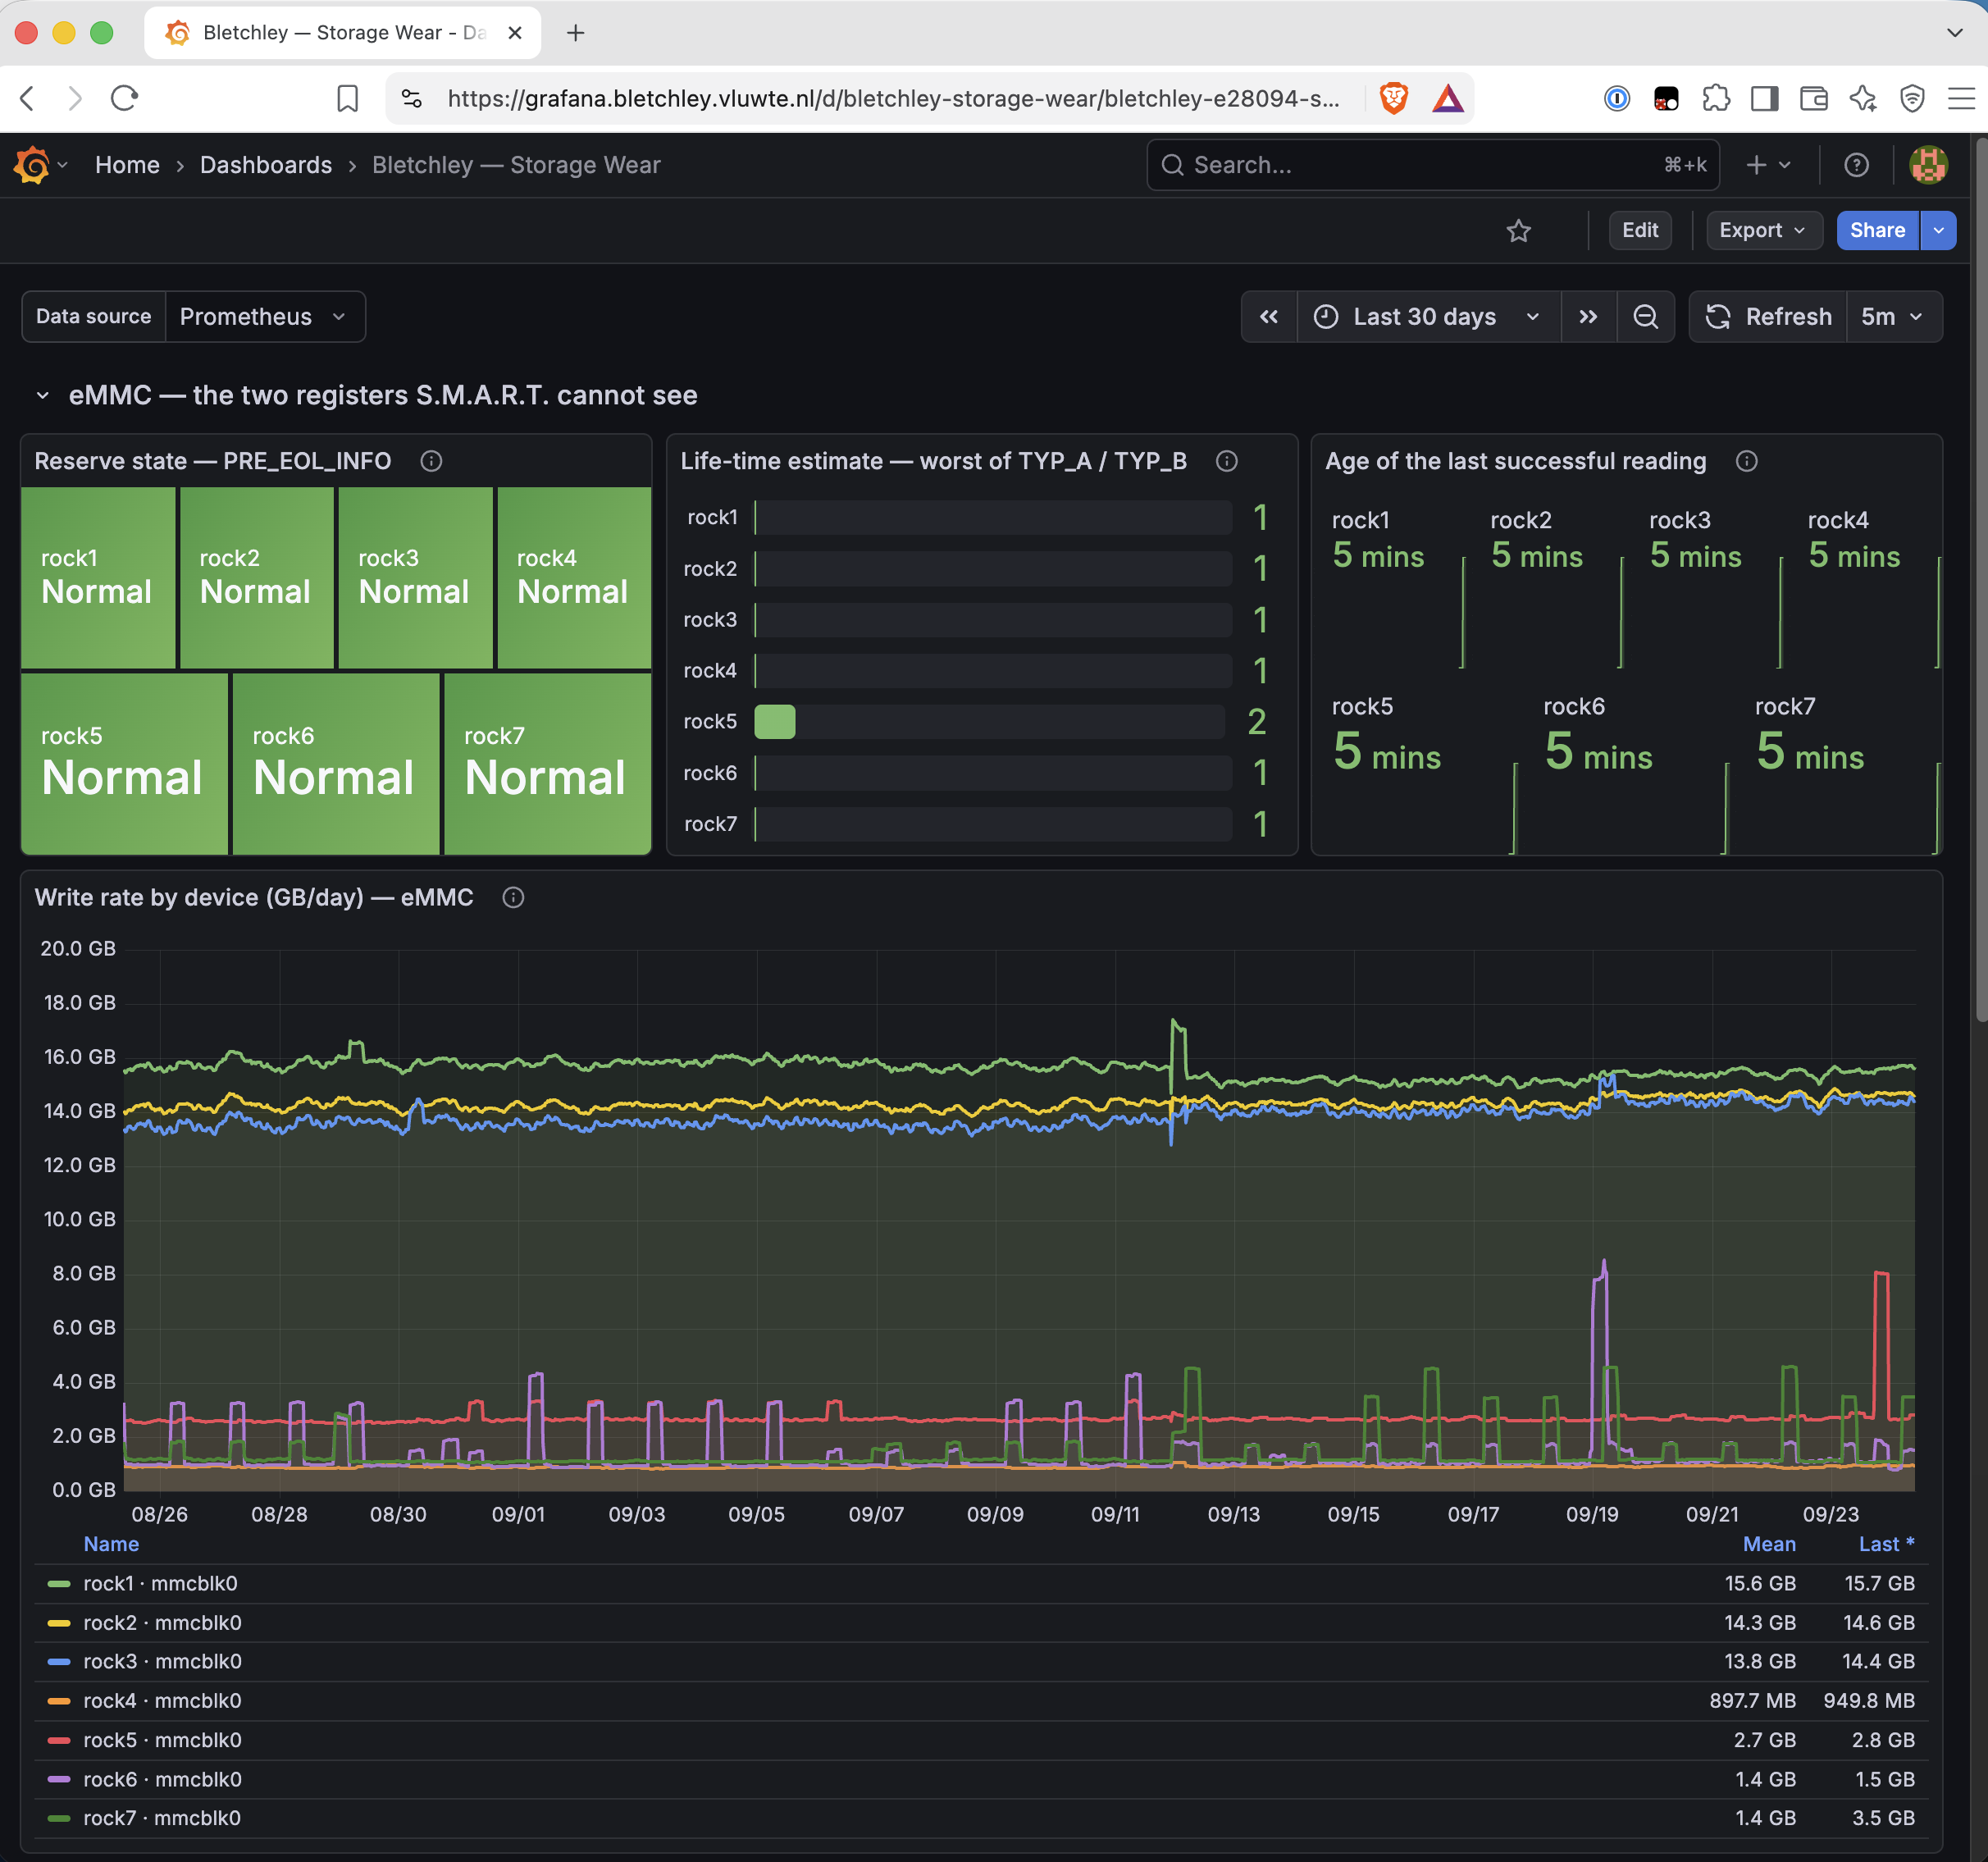
Three panels read the exporter, and they are the "display the estimates" half of the principle from the previous post:
- Reserve state is
max by (node) (emmc_pre_eol_info), mapped to Normal, Warning and Urgent. - Life-time estimate is the worst of TYP_A and TYP_B per node. Six ones and rock5's two, which match the manual reads exactly.
- Age of the last successful reading is
time()minus the liveness stamp. It sawtooths between zero and five minutes. If it ever sits above an hour, the exporter is up and no longer reading, andEMMCExporterStalefires.
Below them, write rate and duty cycle come from node_disk_written_bytes_total, the counter that has been collected all along. The legend is the previous post's table in another form: about 14 to 16 GB a day on the control plane, one to three on the workers.
Two spellings of one node
Mixing two data sources on one dashboard exposed a small labelling problem. node_exporter uses static targets, so its instance is rock4.vluwte.nl:9100. The eMMC job relabels instance to plain rock4. Same node, two spellings, and a panel mixing them reads like two machines. The node_exporter queries are wrapped in label_replace(..., "node", "$1", "instance", "([^.:]+).*") and every legend keys on node.
Why eMMC only
The plan was one dashboard for all three device classes. The NVMe and SATA panels would have been built on metric names I have not confirmed yet, so I built them, looked at a row of panels that might never show data, and removed it. A panel on an unconfirmed metric name is a promise the dashboard cannot keep. The combined dashboard comes when those names are known.
Not seven copies of one experiment
The inventory table, from emmc_device_info, turned up something I had not expected: the seven modules are not one batch. rock3, rock5 and rock7 report a manufacture date of 10/2022 and firmware 0x09…; rock4 reports 02/2024 and firmware 0x03…. All are BJTD4R.
rock4 is explained: the cluster started with three modules and a fourth was bought later. rock5 is not. It shares the batch and firmware of rock3 and rock7, has one of the lowest write rates in the cluster, and still sits a whole bucket ahead of both. Prior use of that module is still the best explanation, and still unconfirmed.
What's Working Now
- ✅
emmc-exporter0.1.1, arm64, on all seven nodes including the control plane, reading/sysevery five minutes - ✅ Zero read errors since 22 September, through a physical re-seat of rock6 and a full pod rotation
- ✅ Series identity is
nodeanddevice: nopod, noexported_node, no pod IPs - ✅ Eleven rules in the
cluster,hardwareandmonitoringgroups, each seen firing against the real targets, mail delivery confirmed - ✅ One documented silence, rock5's first tick, until the end of 2030
- ✅ An eMMC-only wear dashboard, committed to git as JSON
What the cluster can now catch that it could not on 21 September: a reserve counter moving, a life-time bucket ticking, an exporter that is up but no longer reading, a scrape job that vanished, a node with no eMMC found, coverage falling below the node count, read errors, and a change in the number of nodes or kube-state-metrics going quiet.
Lessons Learned
- A metric that never changes needs its own proof of life. A timestamp that advances only on a successful read is what makes a stuck exporter distinguishable from a healthy disk.
- One label, one owner. If the exporter publishes
node, the scrape job must not, or Prometheus renames it toexported_nodeand every rule quietly matches nothing. - "Nothing alerts on it" is not the test for a label. The test is whether it changes the identity of the series. The
podlabel put a node on the dashboard twice. kubectl delete pod -l …is a cheap reboot test. It replaces every pod name in seconds, which is enough to expose any label that carries pod identity.- Test a rule by moving its threshold, not by inventing a signal. Every rule got a one-line change against the real targets, reverted afterwards. A lowered threshold proves the rule and the delivery path just as well as a fake signal does, without a second workload to get wrong.
- Reloading rules restarts every
for:clock. A quiet page right after a reload is not yet evidence of a quiet cluster. - Prefer a silence with a comment over an exception in an expression. And match it on labels that survive a pod being replaced.
Conclusion
Reading the two registers took two file reads. Most of the work went into a different question: how do you trust a signal that is supposed to stay flat for years?
A flat line is ambiguous. It can mean a healthy eMMC. It can also mean an exporter that stopped reading, a scrape job that vanished, a label that quietly changed the identity of the series, or an alert that could never have fired. Each part of this build rules out one of those: a timestamp that only moves on success, six rules that watch the collector rather than the disk, a node label that nothing else is allowed to own, and a threshold test for every rule before it went live.
None of it makes the eMMC any healthier. What it does is make silence mean something.
What's Next
The collector is running, which means life_time now has a watcher for the day it first moves on the six nodes that still read 0x01.
The next question in this thread is the one the collector was really built for: roughly 13 GB a day of etcd writes onto a soldered part is currently a default, not a decision. Where do those writes come from, and how much of them can go away? Before that, one detour back to the NVMe side, and a drive whose wear rate went up on the day it very nearly stopped writing.
The NVMe and SATA half of the wear dashboard is parked until the S.M.A.R.T. metric names are confirmed.
That is the post. What follows is reference material: the manifests and rules as they are deployed.
Addendum: the manifests as deployed
The exporter's Go source, Dockerfile and Makefile are not reproduced here. If you would like them, leave a comment or mail me and I will share them.
DaemonSet and Service
apps/monitoring/emmc-monitoring/emmc-exporter.yaml:
# apps/monitoring/emmc-monitoring/emmc-exporter.yaml
# eMMC exporter — DaemonSet + headless Service
#
# The monitoring namespace already carries pod-security.kubernetes.io/enforce:
# privileged, which is what allows the hostPath mount. The pod itself is not
# privileged: non-root, no capabilities, read-only root, /sys read-only.
---
apiVersion: apps/v1
kind: DaemonSet
metadata:
  name: emmc-exporter
  namespace: monitoring
  labels:
    app.kubernetes.io/name: emmc-exporter
    app.kubernetes.io/instance: emmc-exporter
    app.kubernetes.io/component: metrics
spec:
  selector:
    matchLabels:
      # Immutable. Renaming this means deleting and recreating the DaemonSet.
      app.kubernetes.io/name: emmc-exporter
  updateStrategy:
    type: RollingUpdate
    rollingUpdate:
      maxUnavailable: 1
  template:
    metadata:
      labels:
        app.kubernetes.io/name: emmc-exporter
        app.kubernetes.io/instance: emmc-exporter
        app.kubernetes.io/component: metrics
    spec:
      automountServiceAccountToken: false
      # The three control-plane nodes take ~14.6 GB/day, so they are exactly
      # the ones that must not be missed.
      tolerations:
        - key: node-role.kubernetes.io/control-plane
          operator: Exists
          effect: NoSchedule
        - key: node-role.kubernetes.io/master
          operator: Exists
          effect: NoSchedule
      securityContext:
        runAsNonRoot: true
        runAsUser: 65534
        runAsGroup: 65534
        seccompProfile:
          type: RuntimeDefault
      containers:
        - name: exporter
          image: 10.0.0.80:5000/emmc-exporter:0.1.1
          imagePullPolicy: IfNotPresent
          args:
            - -sysfs-path=/host/sys
            # Read sysfs every 5m; Prometheus scrapes the cache every 2m.
            - -refresh-interval=5m
          env:
            # The only source of the node label. The exporter exits if this is
            # empty rather than falling back to the hostname, which inside a
            # pod is the pod name.
            - name: NODE_NAME
              valueFrom:
                fieldRef:
                  fieldPath: spec.nodeName
          ports:
            - name: metrics
              containerPort: 9836
              protocol: TCP
          securityContext:
            allowPrivilegeEscalation: false
            readOnlyRootFilesystem: true
            privileged: false
            capabilities:
              drop: [ALL]
          resources:
            requests:
              cpu: 5m
              memory: 16Mi
            limits:
              # No CPU limit: throttling a collector produces scrape timeouts
              # that look like a broken exporter.
              memory: 48Mi
          livenessProbe:
            httpGet:
              path: /healthz
              port: metrics
            initialDelaySeconds: 5
            periodSeconds: 30
            timeoutSeconds: 5
          readinessProbe:
            httpGet:
              path: /healthz
              port: metrics
            initialDelaySeconds: 2
            periodSeconds: 10
            timeoutSeconds: 5
          volumeMounts:
            - name: sys
              mountPath: /host/sys
              readOnly: true
      volumes:
        - name: sys
          hostPath:
            path: /sys
            type: Directory
---
# Headless: nothing load-balances a per-node exporter. It exists for
# port-forwarding and as a quick 7/7 endpoints check.
apiVersion: v1
kind: Service
metadata:
  name: emmc-exporter
  namespace: monitoring
  labels:
    app.kubernetes.io/name: emmc-exporter
    app.kubernetes.io/instance: emmc-exporter
    app.kubernetes.io/component: metrics
spec:
  clusterIP: None
  selector:
    app.kubernetes.io/name: emmc-exporter
  ports:
    - name: metrics
      port: 9836
      targetPort: metrics
      protocol: TCP
A few lines worth pointing at: the NODE_NAME environment variable from spec.nodeName, which the exporter refuses to start without; the control-plane toleration; and hostPath: /sys mounted read-only at /host/sys, which is the one thing here that restricted objects to.
Scrape job
From apps/monitoring/prometheus/prometheus-values.yaml:
serverFiles:
  prometheus.yml:
    scrape_configs:
      - job_name: emmc-exporter
        # 2 minutes, not 15 seconds. The registers move on a timescale of
        # years, but the interval is not about them: it is about Prometheus's
        # 5-minute lookback window. A scrape interval at or above 5m leaves
        # gaps where a query finds no sample and panels and rules go blank.
        # The cost of reading sysfs is controlled in the exporter instead
        # (-refresh-interval=5m); the scrape only reads a cache.
        scrape_interval: 2m
        scrape_timeout: 30s
        kubernetes_sd_configs:
          - role: pod
            namespaces:
              names: [monitoring]
        relabel_configs:
          # Keep only this exporter's pods, and only the metrics port. Without the
          # second rule every container port on the pod becomes a target.
          - source_labels: [__meta_kubernetes_pod_label_app_kubernetes_io_name]
            action: keep
            regex: emmc-exporter
          - source_labels: [__meta_kubernetes_pod_container_port_name]
            action: keep
            regex: metrics

          # Do not scrape pods that have finished or failed.
          - source_labels: [__meta_kubernetes_pod_phase]
            action: drop
            regex: (Succeeded|Failed)
          # THE LABEL THAT MATTERS.
          #
          # By default `instance` becomes <pod IP>:9836, which changes on every
          # reboot and produces a new time series each time — the whole subject of
          # "The Alert That Named a Pod". Set it to the node name so that even
          # up{} and scrape_duration_seconds are labelled by something stable.
          - source_labels: [__meta_kubernetes_pod_node_name]
            target_label: instance

          # ⚠️ Deliberately NOT setting a `node` or `pod` label here.
          #
          # The exporter already publishes node="<node>" on every metric, taken
          # from the downward API. If this job also set target_label: node,
          # Prometheus would find a collision on ingestion and — because
          # honor_labels is false by default — would rename the exporter's label
          # to exported_node, leaving every rule matching on a label that no
          # longer exists. Two authorities for one label is how that bug gets
          # written. The exporter is the authority; this job labels the target,
          # not the metric.
Note what is missing as much as what is there: instance is set to the node name, node is not set at all, and there is no pod relabel.
Alert rules
The eleven rules as they sit in prometheus-values.yaml, under serverFiles. Only the new rules are shown: cluster and hardware already existed and hold other rules that are left out here, while monitoring is new and complete as shown.
  alerting_rules.yml:
    groups:
      # Begin alerting rules group: cluster
      - name: cluster
        rules:
          # The one place the cluster size is written down. When this fires,
          # update the 7 here, and check the hand-maintained node-exporter
          # target list, which does not follow the cluster on its own.
          - alert: ClusterNodeCountChanged
            expr: (count(kube_node_info) or on() vector(0)) != 7
            for: 1h
            labels:
              severity: info
            annotations:
              summary: "Cluster now has {{ $value }} nodes, expected 7"
              description: "The node count differs from the recorded cluster size. If a node was added or removed on purpose, update this rule and the node-exporter scrape targets. A value of 0 means kube-state-metrics is not publishing, and EMMCCoverageIncomplete cannot fire until it is back."

      # Begin alerting rules group: hardware
      - name: hardware
        rules:
          # -- eMMC — Wear reporting ---------------------------------------
          # The one that matters. PRE_EOL_INFO is a reserved-block count, not a
          # vendor estimate: 0x02 means 80% of the spare blocks are gone.
          - alert: EMMCPreEOLWarning
            expr: max by (node, device) (emmc_pre_eol_info) > 1
            for: 30m
            labels:
              severity: critical
            annotations:
              summary: "eMMC reserve depleting on {{ $labels.node }} (PRE_EOL_INFO = {{ $value }})"
              description: >-
                {{ $labels.device }} on {{ $labels.node }} reports PRE_EOL_INFO
                {{ $value }} (2 = warning, 80% of reserved blocks consumed;
                3 = urgent). The eMMC is soldered to the RK1 and cannot be
                replaced without reflashing the node, so treat this as lead time
                to plan, not as an outage. Record the date — it is the first
                honest wear signal this device has ever given.

          # The single datum a 10%-wide bucket really carries is the date it
          # first moves off 0x01. This alert exists to capture that date, so it
          # is expected to latch and stay firing: write the date down, then
          # silence it. rock5 already sits at 0x02, which makes it the live test
          # for this rule on day one.
          - alert: EMMCLifeTimeFirstTick
            expr: max by (node, device) (emmc_life_time_est) > 1
            for: 1h
            labels:
              severity: info
            annotations:
              summary: "eMMC life-time estimate on {{ $labels.node }} has moved off its first bucket (now {{ $value }})"
              description: >-
                DEVICE_LIFE_TIME_EST on {{ $labels.device }} ({{ $labels.node }})
                reads bucket {{ $value }} — the buckets are 10% of rated life
                wide, and 11 means exceeded. A vendor estimate, not a
                measurement: the datum here is the date, not the number. Record
                it in bletchley-cluster-state.md and silence this alert;
                EMMCLifeTimeHigh covers everything after it.

          # `unless` excludes bucket 11 so this rule and EMMCLifeTimeExceeded
          # never fire together for the same device.
          - alert: EMMCLifeTimeHigh
            expr: |-
              max by (node, device) (emmc_life_time_est) >= 5
                unless
              max by (node, device) (emmc_life_time_est) >= 11
            for: 1h
            labels:
              severity: warning
            annotations:
              summary: "eMMC on {{ $labels.node }} is past 40% of its rated write endurance (bucket {{ $value }} of 10)"
              description: >-
                DEVICE_LIFE_TIME_EST on {{ $labels.device }} ({{ $labels.node }})
                reads bucket {{ $value }} of 10: at least 40% of the eMMC's rated
                write endurance is consumed, and every further bucket is another
                10%. The part is soldered to the RK1, so replacing it means
                reflashing the node — this is a planning signal with months of
                lead time, not an outage. Check the node's write rate on the
                Bletchley — Storage Wear dashboard and decide whether its
                workload should move before the next bucket.

          - alert: EMMCLifeTimeExceeded
            expr: max by (node, device) (emmc_life_time_est) >= 11
            for: 1h
            labels:
              severity: critical
            annotations:
              summary: "eMMC on {{ $labels.node }} reports rated life EXCEEDED (0x0B)"
              description: >-
                {{ $labels.device }} on {{ $labels.node }} reports
                DEVICE_LIFE_TIME_EST 0x0B — beyond its rated endurance. Plan the
                node's replacement or reflash; the part is soldered.

      # Begin alerting rules group: monitoring
      - name: monitoring
        rules:
          # -- eMMC exporter ---------------------------------------------------
          # A healthy eMMC and a dead collector look identical: both are a flat
          # line. The exporter refreshes from sysfs on a background loop and
          # stamps only SUCCESSFUL reads, so this fires when the readings stop
          # being refreshed even though the process is still serving. Stamp 0
          # means "never read once since start": the condition is true straight
          # away, and the rule fires once the 15m `for:` has passed.
          - alert: EMMCExporterStale
            expr: time() - max by (node) (emmc_reading_timestamp_seconds) > 3600
            for: 15m
            labels:
              severity: warning
            annotations:
              summary: "eMMC readings on {{ $labels.node }} are {{ $value | humanizeDuration }} old"
              description: >-
                emmc_reading_timestamp_seconds has not advanced on
                {{ $labels.node }}. The exporter is up — it is answering scrapes —
                but it is no longer reading sysfs successfully. Check
                emmc_read_errors_total and the pod's logs. Refresh interval is
                5m, so an hour is twelve missed reads.
          - alert: EMMCExporterDown
            expr: up{job="emmc-exporter"} == 0
            for: 30m
            labels:
              severity: warning
            annotations:
              summary: "eMMC exporter is not answering on {{ $labels.instance }}"

          # The failure nothing else catches: the whole job disappearing from
          # the config. `up == 0` cannot fire for a target that no longer exists.
          - alert: EMMCExporterMissing
            expr: absent(up{job="emmc-exporter"})
            for: 1h
            labels:
              severity: warning
            annotations:
              summary: "The emmc-exporter scrape job has no targets at all"
              description: >-
                No target in the emmc-exporter job. Either the DaemonSet is gone,
                the scrape job was dropped from prometheus-values.yaml, or the
                relabel keep-rule no longer matches the pod labels.

          # Answers the standing question "do rock5-7 expose these registers?"
          # as an alert rather than a quarterly memory test.
          - alert: EMMCNoDeviceFound
            expr: max by (node) (emmc_devices_discovered) == 0
            for: 1h
            labels:
              severity: warning
            annotations:
              summary: "eMMC exporter on {{ $labels.node }} found no device with health registers"
              description: >-
                The exporter is running on {{ $labels.node }} but discovery
                returned nothing — no mmc card of type MMC exposing life_time or
                pre_eol_info. Either the hostPath mount is wrong or this node's
                kernel is not surfacing EXT_CSD.

          # The expected count comes from the cluster itself, not from a constant
          # in this file: kube-state-metrics publishes one kube_node_info series
          # per node, so adding or removing a node needs no edit here. The cost is
          # a dependency — if kube-state-metrics stops publishing, the right-hand
          # side is empty, the comparison yields nothing and this rule goes quiet
          # rather than firing. ClusterNodeCountChanged catches that: it fires
          # with a value of 0 when kube_node_info disappears.
          - alert: EMMCCoverageIncomplete
            expr: count(count by (node) (emmc_devices_discovered)) < count(kube_node_info)
            for: 2h
            labels:
              severity: warning
            annotations:
              summary: "Only {{ $value }} nodes are reporting eMMC health, fewer than the cluster has"
              description: >-
                Fewer nodes are reporting eMMC health than kube_node_info counts.
                Check the DaemonSet is scheduled on the control plane
                (tolerations) and on both TuringPi boards. 2h of `for:` so a node
                reboot — roughly 7 minutes, measured on rock6 — cannot trip it.

          - alert: EMMCReadErrors
            expr: max by (node, device, attribute) (increase(emmc_read_errors_total[1h])) > 0
            for: 30m
            labels:
              severity: info
            annotations:
              summary: "eMMC exporter on {{ $labels.node }} failed to read {{ $labels.attribute }}"
              description: >-
                {{ $value }} failures in the last hour reading
                {{ $labels.attribute }} on {{ $labels.device }}. attribute
                "discovery" means no card was found at all; "no_readings" means a
                card was found but reported 0x00 for every register.
← Previous: The Disk With No S.M.A.R.T.
Questions or suggestions? Leave a comment below or reach out at igor@vluwte.nl.