Cluster Observability Part 6: Hardware Health Dashboards and Alerts
Grafana dashboards and 19 Prometheus alert rules for ZFS, SMART, disk temperature, fan speed, and Garage health — with manufacturer-sourced thresholds.
Introduction
Part 5 got the data into Prometheus — ZFS pool state, SMART metrics from every drive, thermal readings from the RK3588 SoCs, and Garage disk stats. But raw metrics in a time-series database are not actionable on their own. Without dashboards, hardware health requires active querying to spot a problem. Without alerting rules, a degraded ZFS mirror or a drive running hot produces no notification at all.
This post closes that gap. Two dashboards — one for SMART health, one for ZFS — and 19 alert rules covering pool degradation, disk failures, NVMe wear and spare capacity, temperatures with manufacturer-sourced thresholds, fan failures, and Garage cluster health. Along the way there are a few surprises: the standard community SMART dashboard doesn't work at all with the matusnovak exporter, NVMe and SATA drives expose temperature under completely different metric names, and the ZFS dashboard loses two panels to an OpenZFS 2.1 kernel change.
There is one known limitation at the end — the SMART metrics show pod IPs instead of node hostnames in alerts. It's documented, understood, and deferred to a future cleanup post rather than solved here.
This post is part of the Observability sub-series.
- Part 1: Prometheus and Node Exporter
- Part 2: Grafana Dashboards
- Part 3: Dashboards for Storage and Kubernetes
- Part 4: Alerting with Prometheus and Alertmanager
- Part 5: Hardware Health Collectors
- Part 6: Hardware Health Dashboards and Alerts
🏠 This is part of the Homelab Journey series - building a production Kubernetes cluster from scratch.
- Hardware Health Collectors
- Cluster Observability Part 6: Hardware Health Dashboards and Alerts (you are here)
This post assumes the hardware health collectors from Part 5 are running and scraping cleanly. It also assumes Alertmanager is configured and delivering email, which was set up in Part 4.
The SMART Dashboard
The natural starting point for a community dashboard is the Grafana library. For the official smartctl_exporter, dashboard ID 20204 is the standard choice. But the Bletchley cluster runs matusnovak/prometheus-smartctl — the image that actually builds for ARM64 — and that exporter uses smartprom_ as its metric prefix rather than smartctl_. Every panel in dashboard 20204 queries smartctl_* metrics. Importing it produces a dashboard full of empty panels.
The matusnovak repo itself ships a Grafana dashboard at grafana/grafana_dashboard.json. That's the right starting point. It's built against smartprom_ metrics and imports cleanly — Grafana prompts to map the DS_PROMETHEUS input to the existing Prometheus datasource and the panels load immediately.
The upstream dashboard has four panels. By the time it was finished, it had six. Here's what changed and why.
Filtering out the virtual devices
The first thing visible in the SMART Health panel is noise:
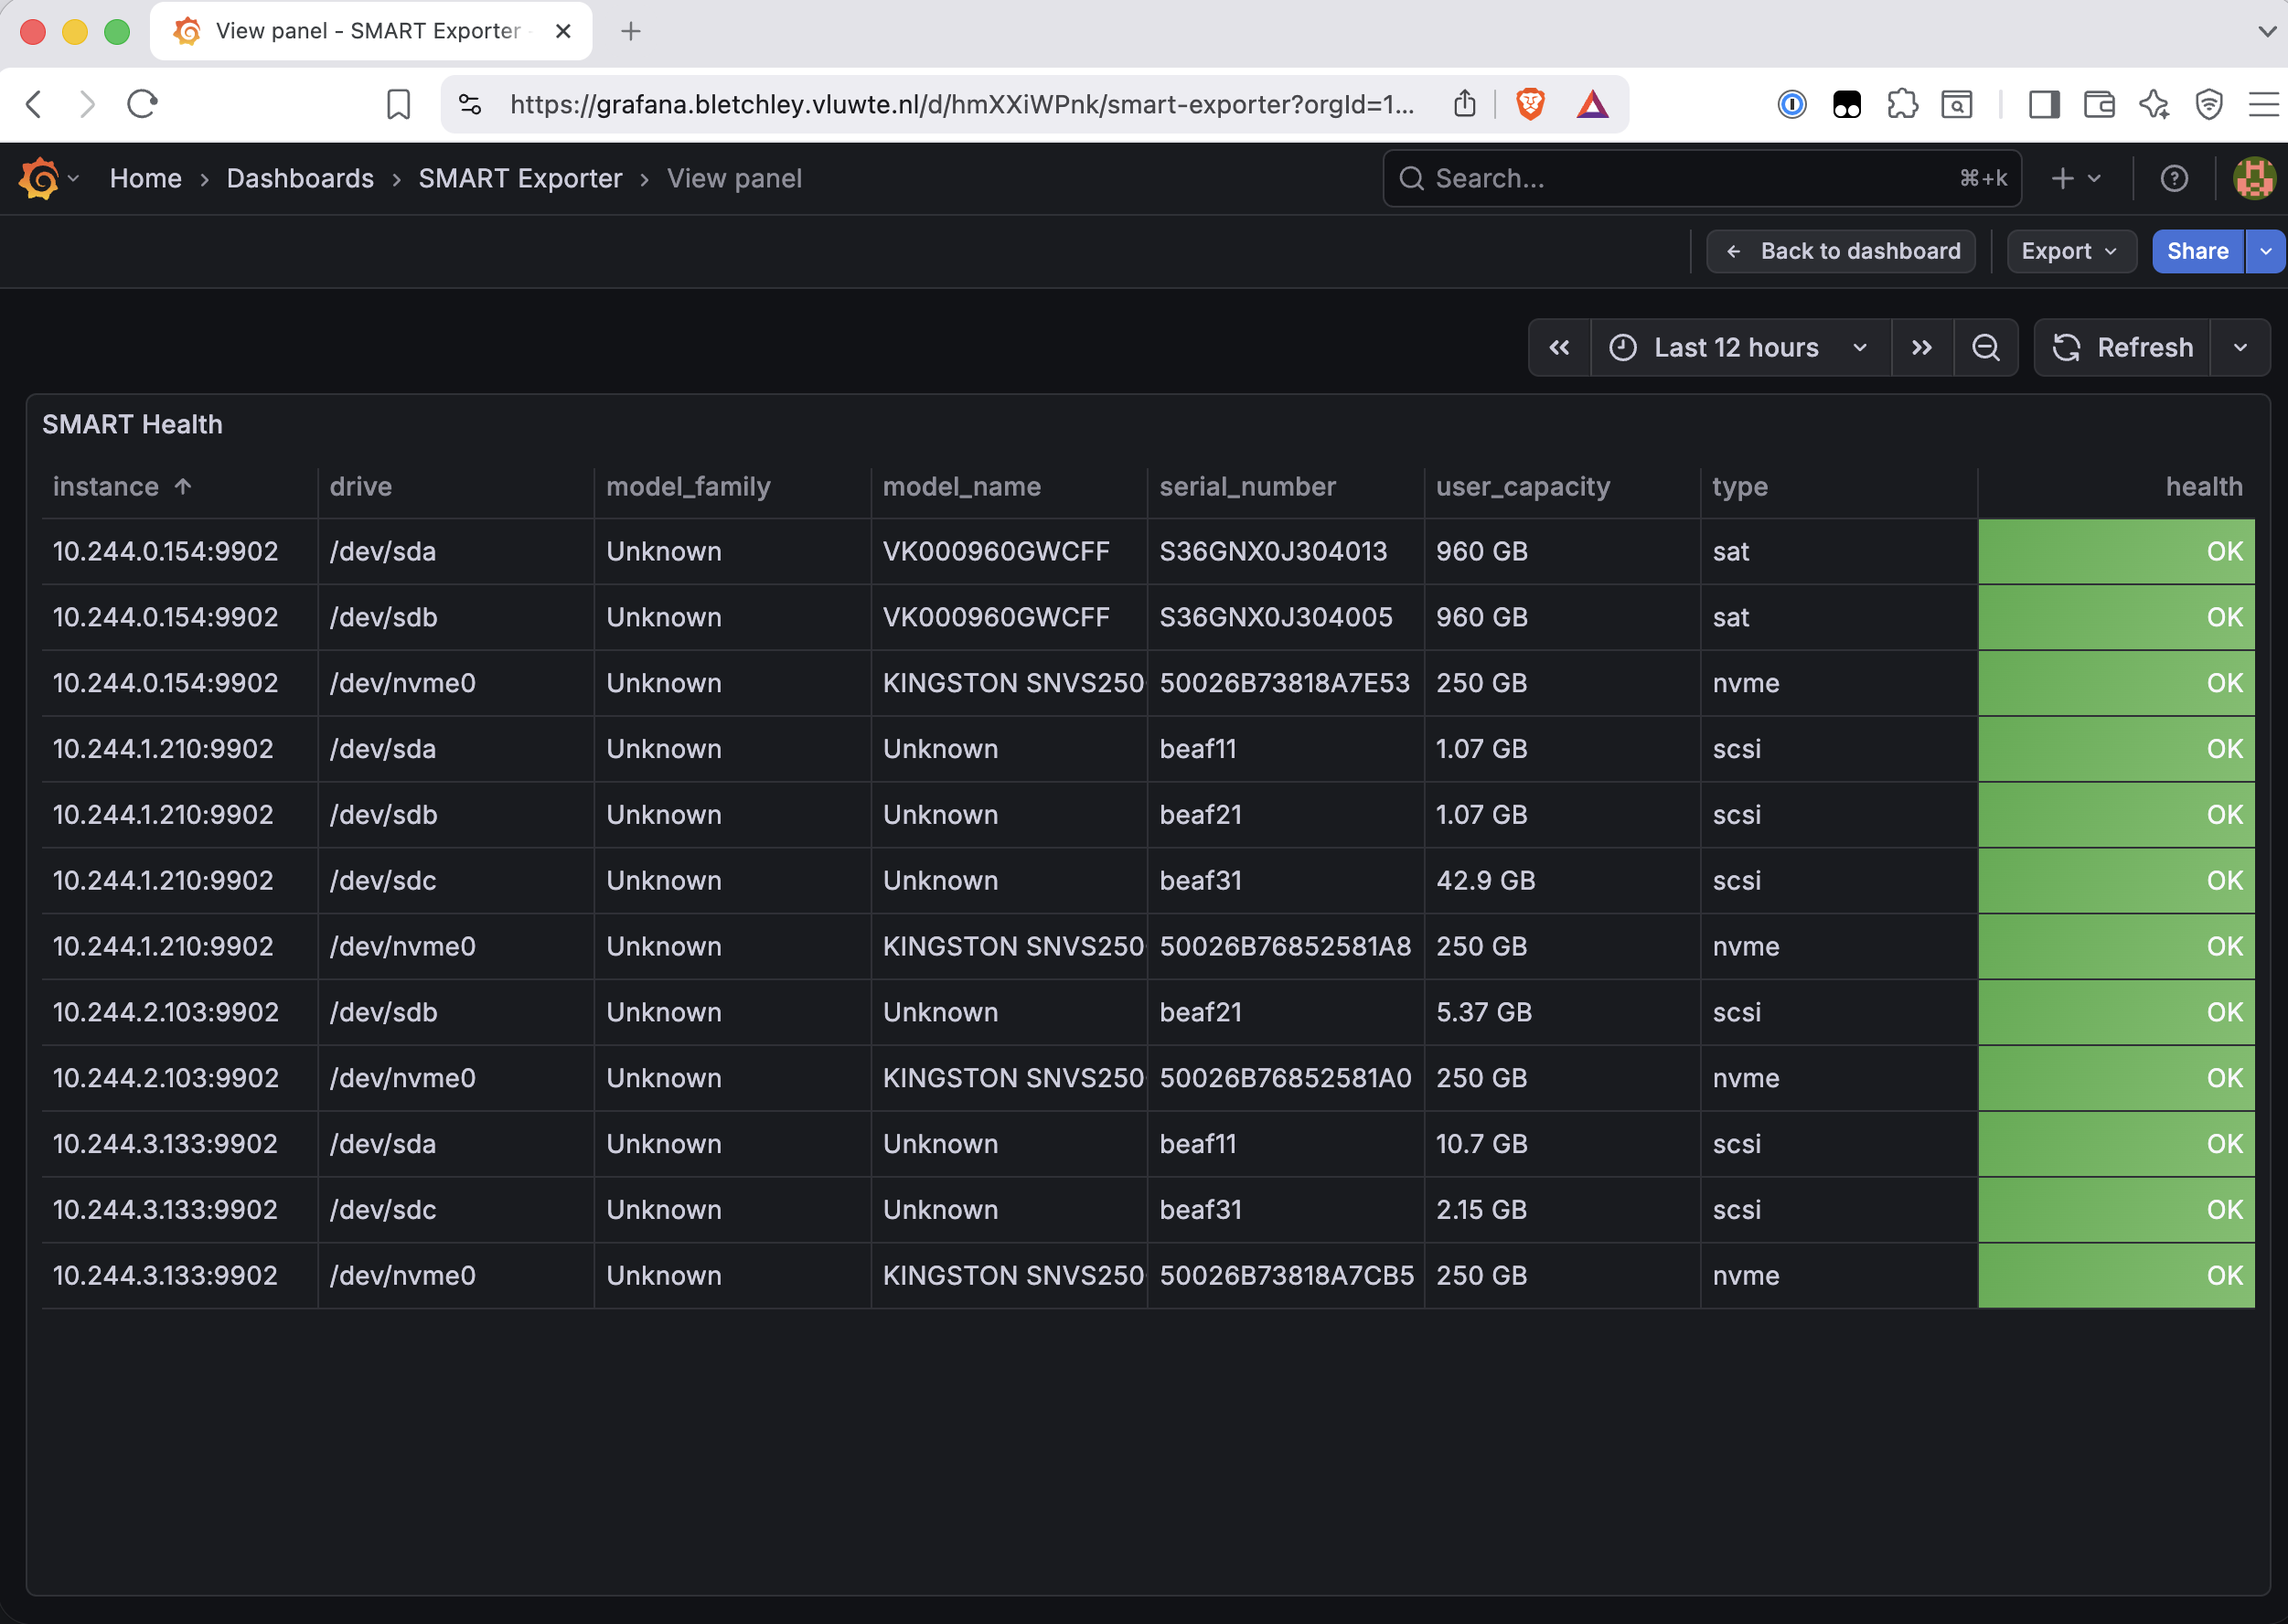
The type column tells the story. Real drives have type="sat" (SATA) or type="nvme". The virtual devices have type="scsi" and serial numbers that are clearly synthetic. Adding type!="scsi" to the SMART Health panel query removes them:
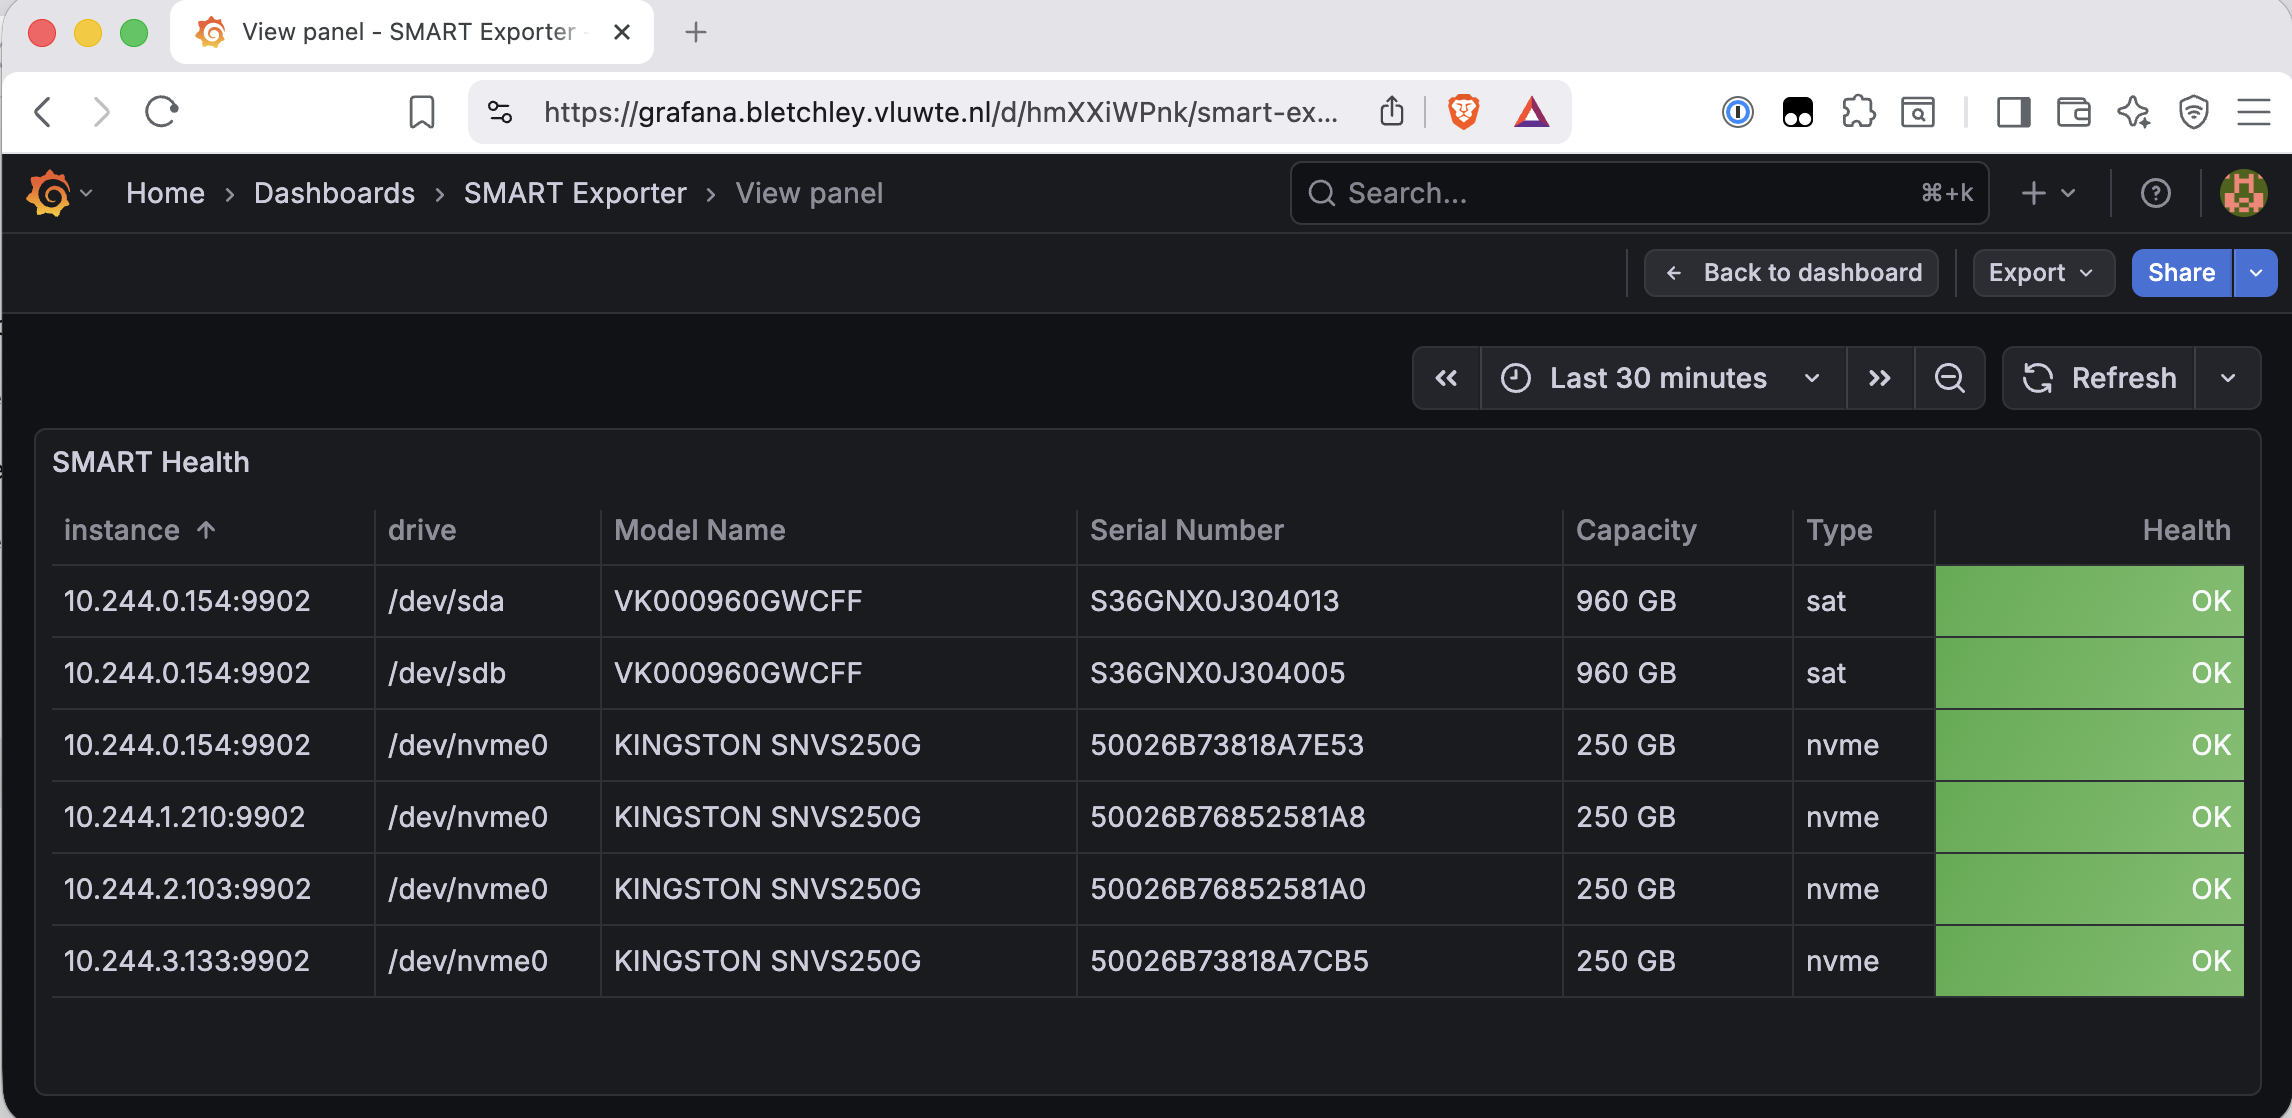
The same type!="scsi" filter appears in every alert rule that touches smartprom_ metrics. The dashboard filter and the alert rules are consistent.
NVMe and SATA use different temperature metrics
The Temperature panel in the upstream dashboard queries smartprom_temperature_celsius_raw. After loading the dashboard, only two lines appeared — rock3's two SATA drives at around 21°C. The four NVMe drives were absent.
The reason: SATA and NVMe drives expose temperature through different SMART attributes, and the matusnovak exporter maps them to different metric names. On Bletchley, the SATA drives report under smartprom_temperature_celsius_raw and the NVMe drives report under smartprom_temperature. The upstream dashboard was built against SATA drives and only queries smartprom_temperature_celsius_raw — so the NVMe drives simply don't appear. Check which metrics your own drives produce in the Prometheus expression browser before assuming the same split applies. Adding a second query to the Temperature panel for the NVMe metric fixes it:
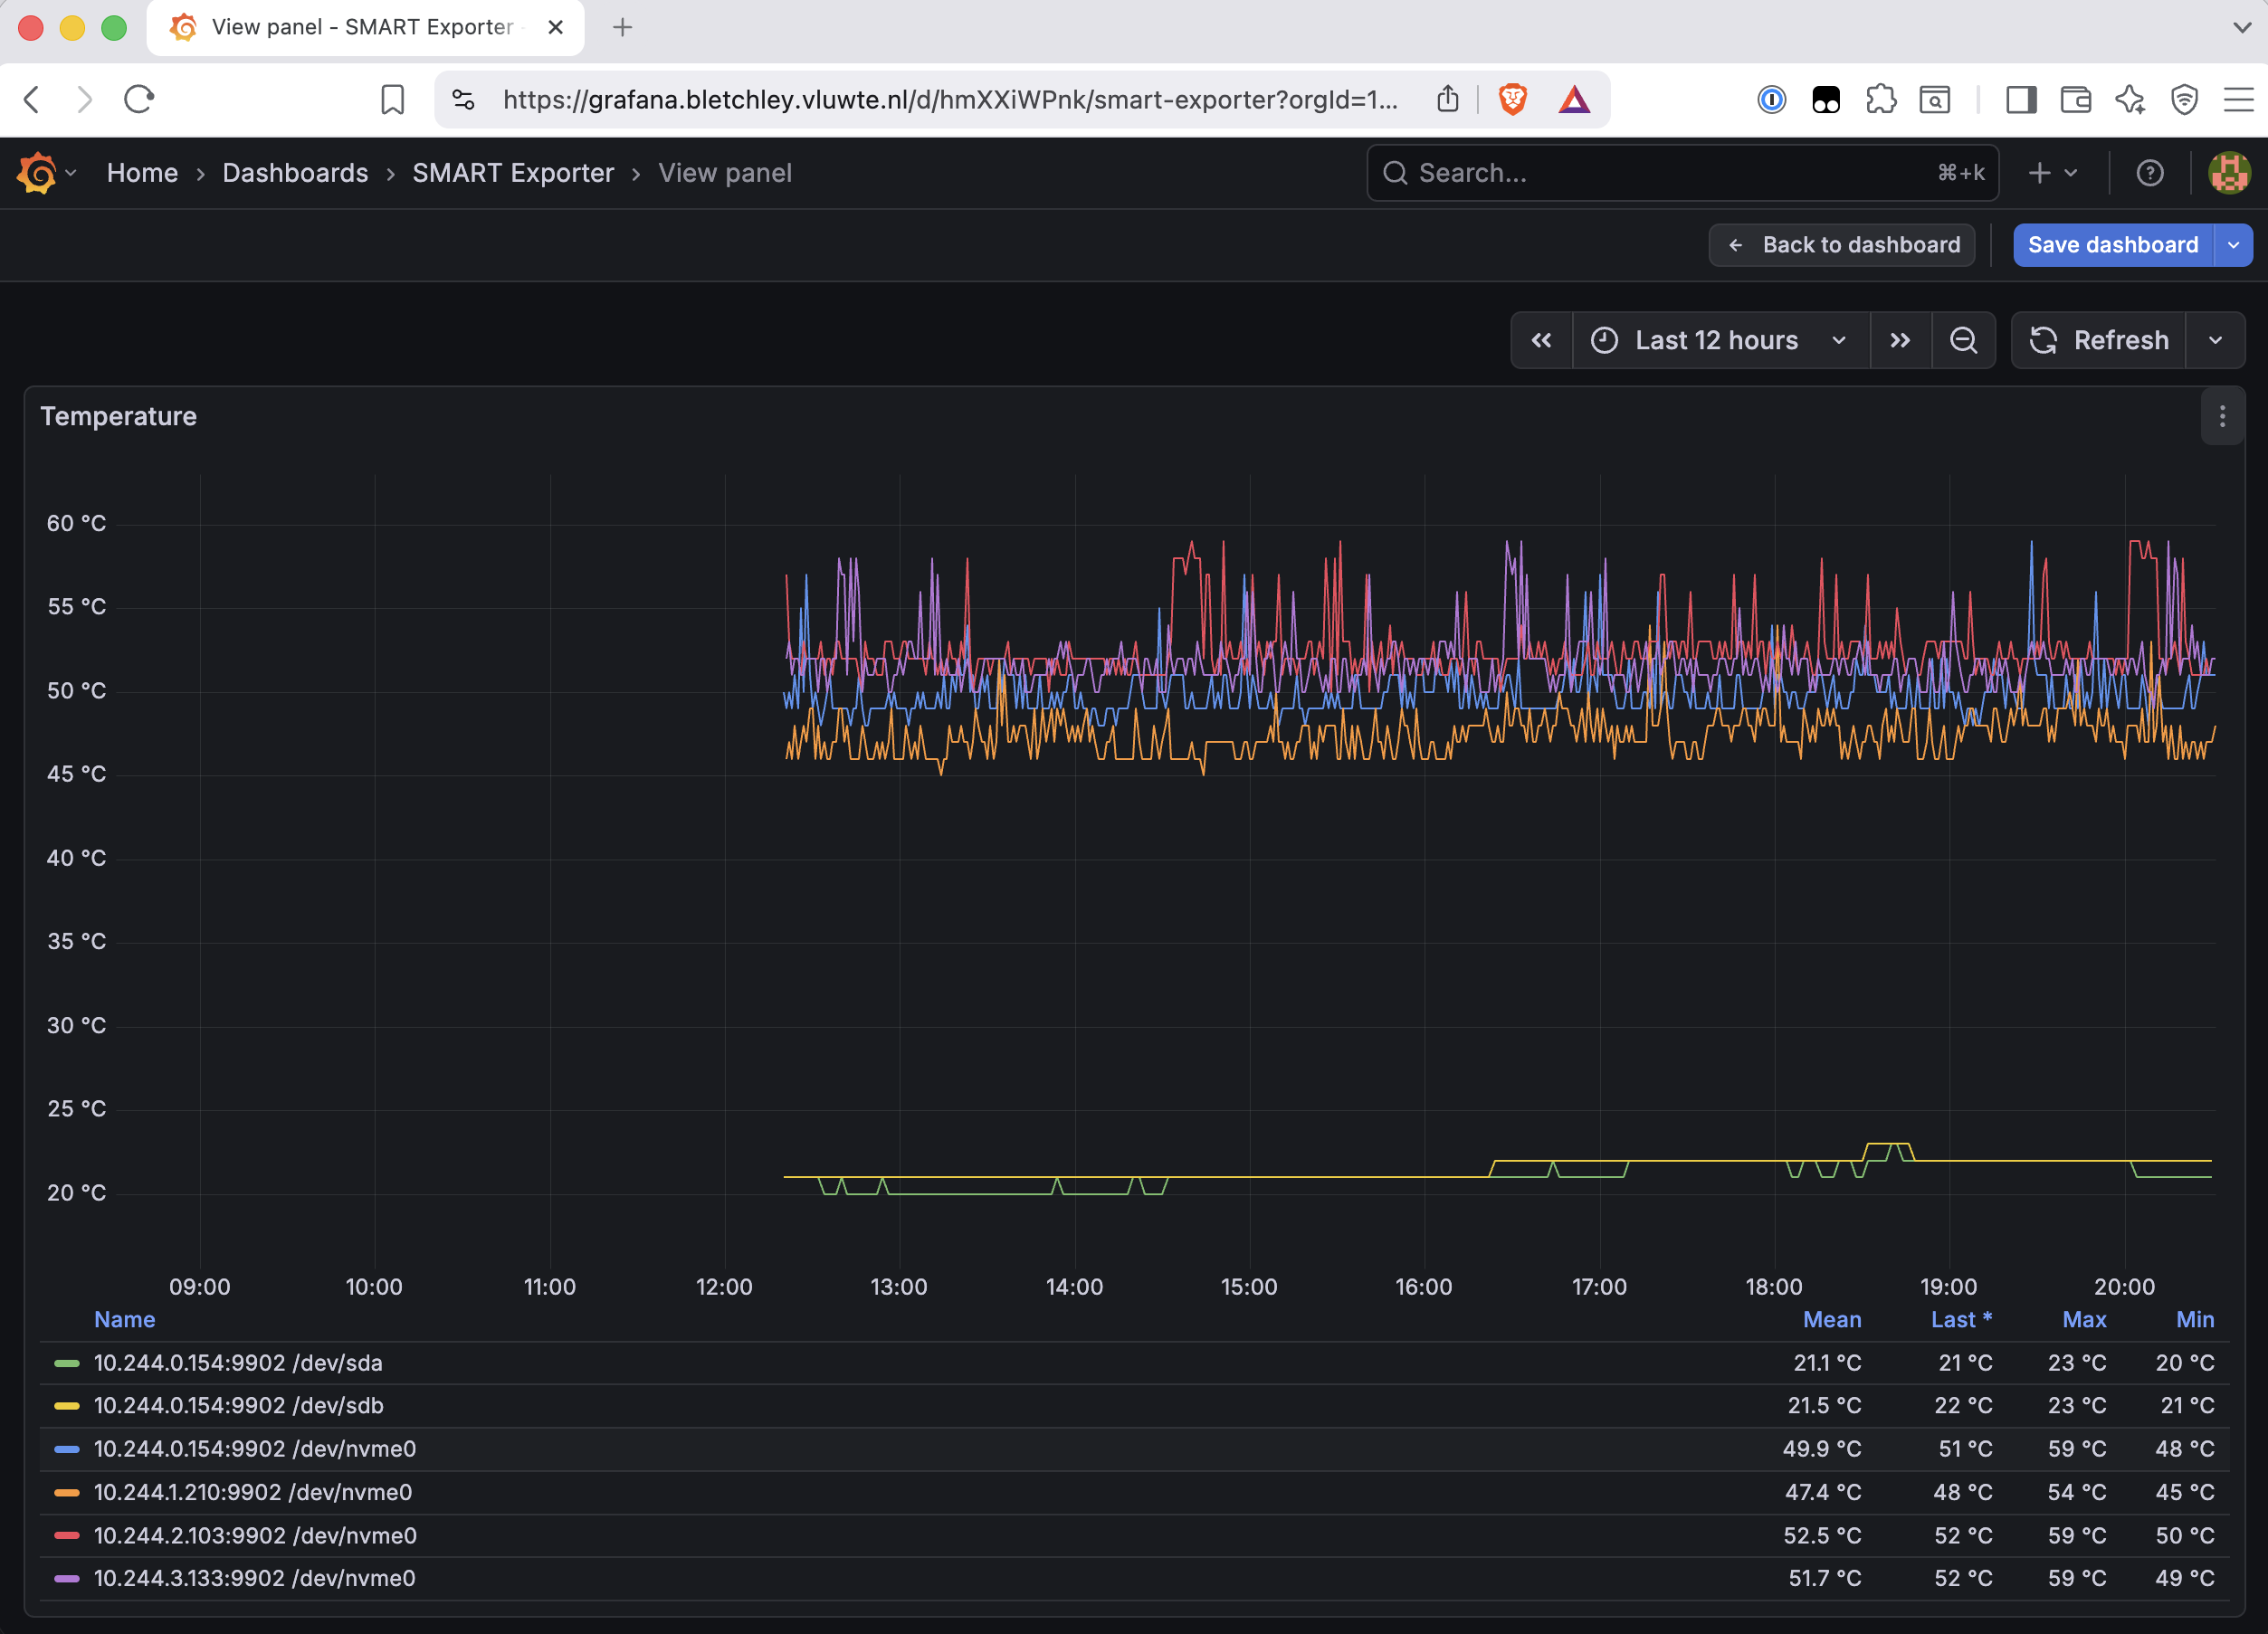
The 30°C gap between SATA and NVMe idle temperatures is worth keeping in mind when setting alert thresholds.
Separating NVMe and SATA panels
The Error Metrics and Info Metrics panels in the upstream dashboard only show data for SATA drives. This is correct behaviour — reallocated sectors, pending sectors, and offline uncorrectable counts are SATA SMART attributes. NVMe drives use a different health model entirely, with metrics like available spare capacity and media error counts.
The solution is to split each panel by device type. The upstream Error Metrics panel becomes Error Metrics SATA, and a new Error Metrics NVMe panel is added alongside it with the NVMe-specific metrics. Same for Info Metrics. The final dashboard has six panels:
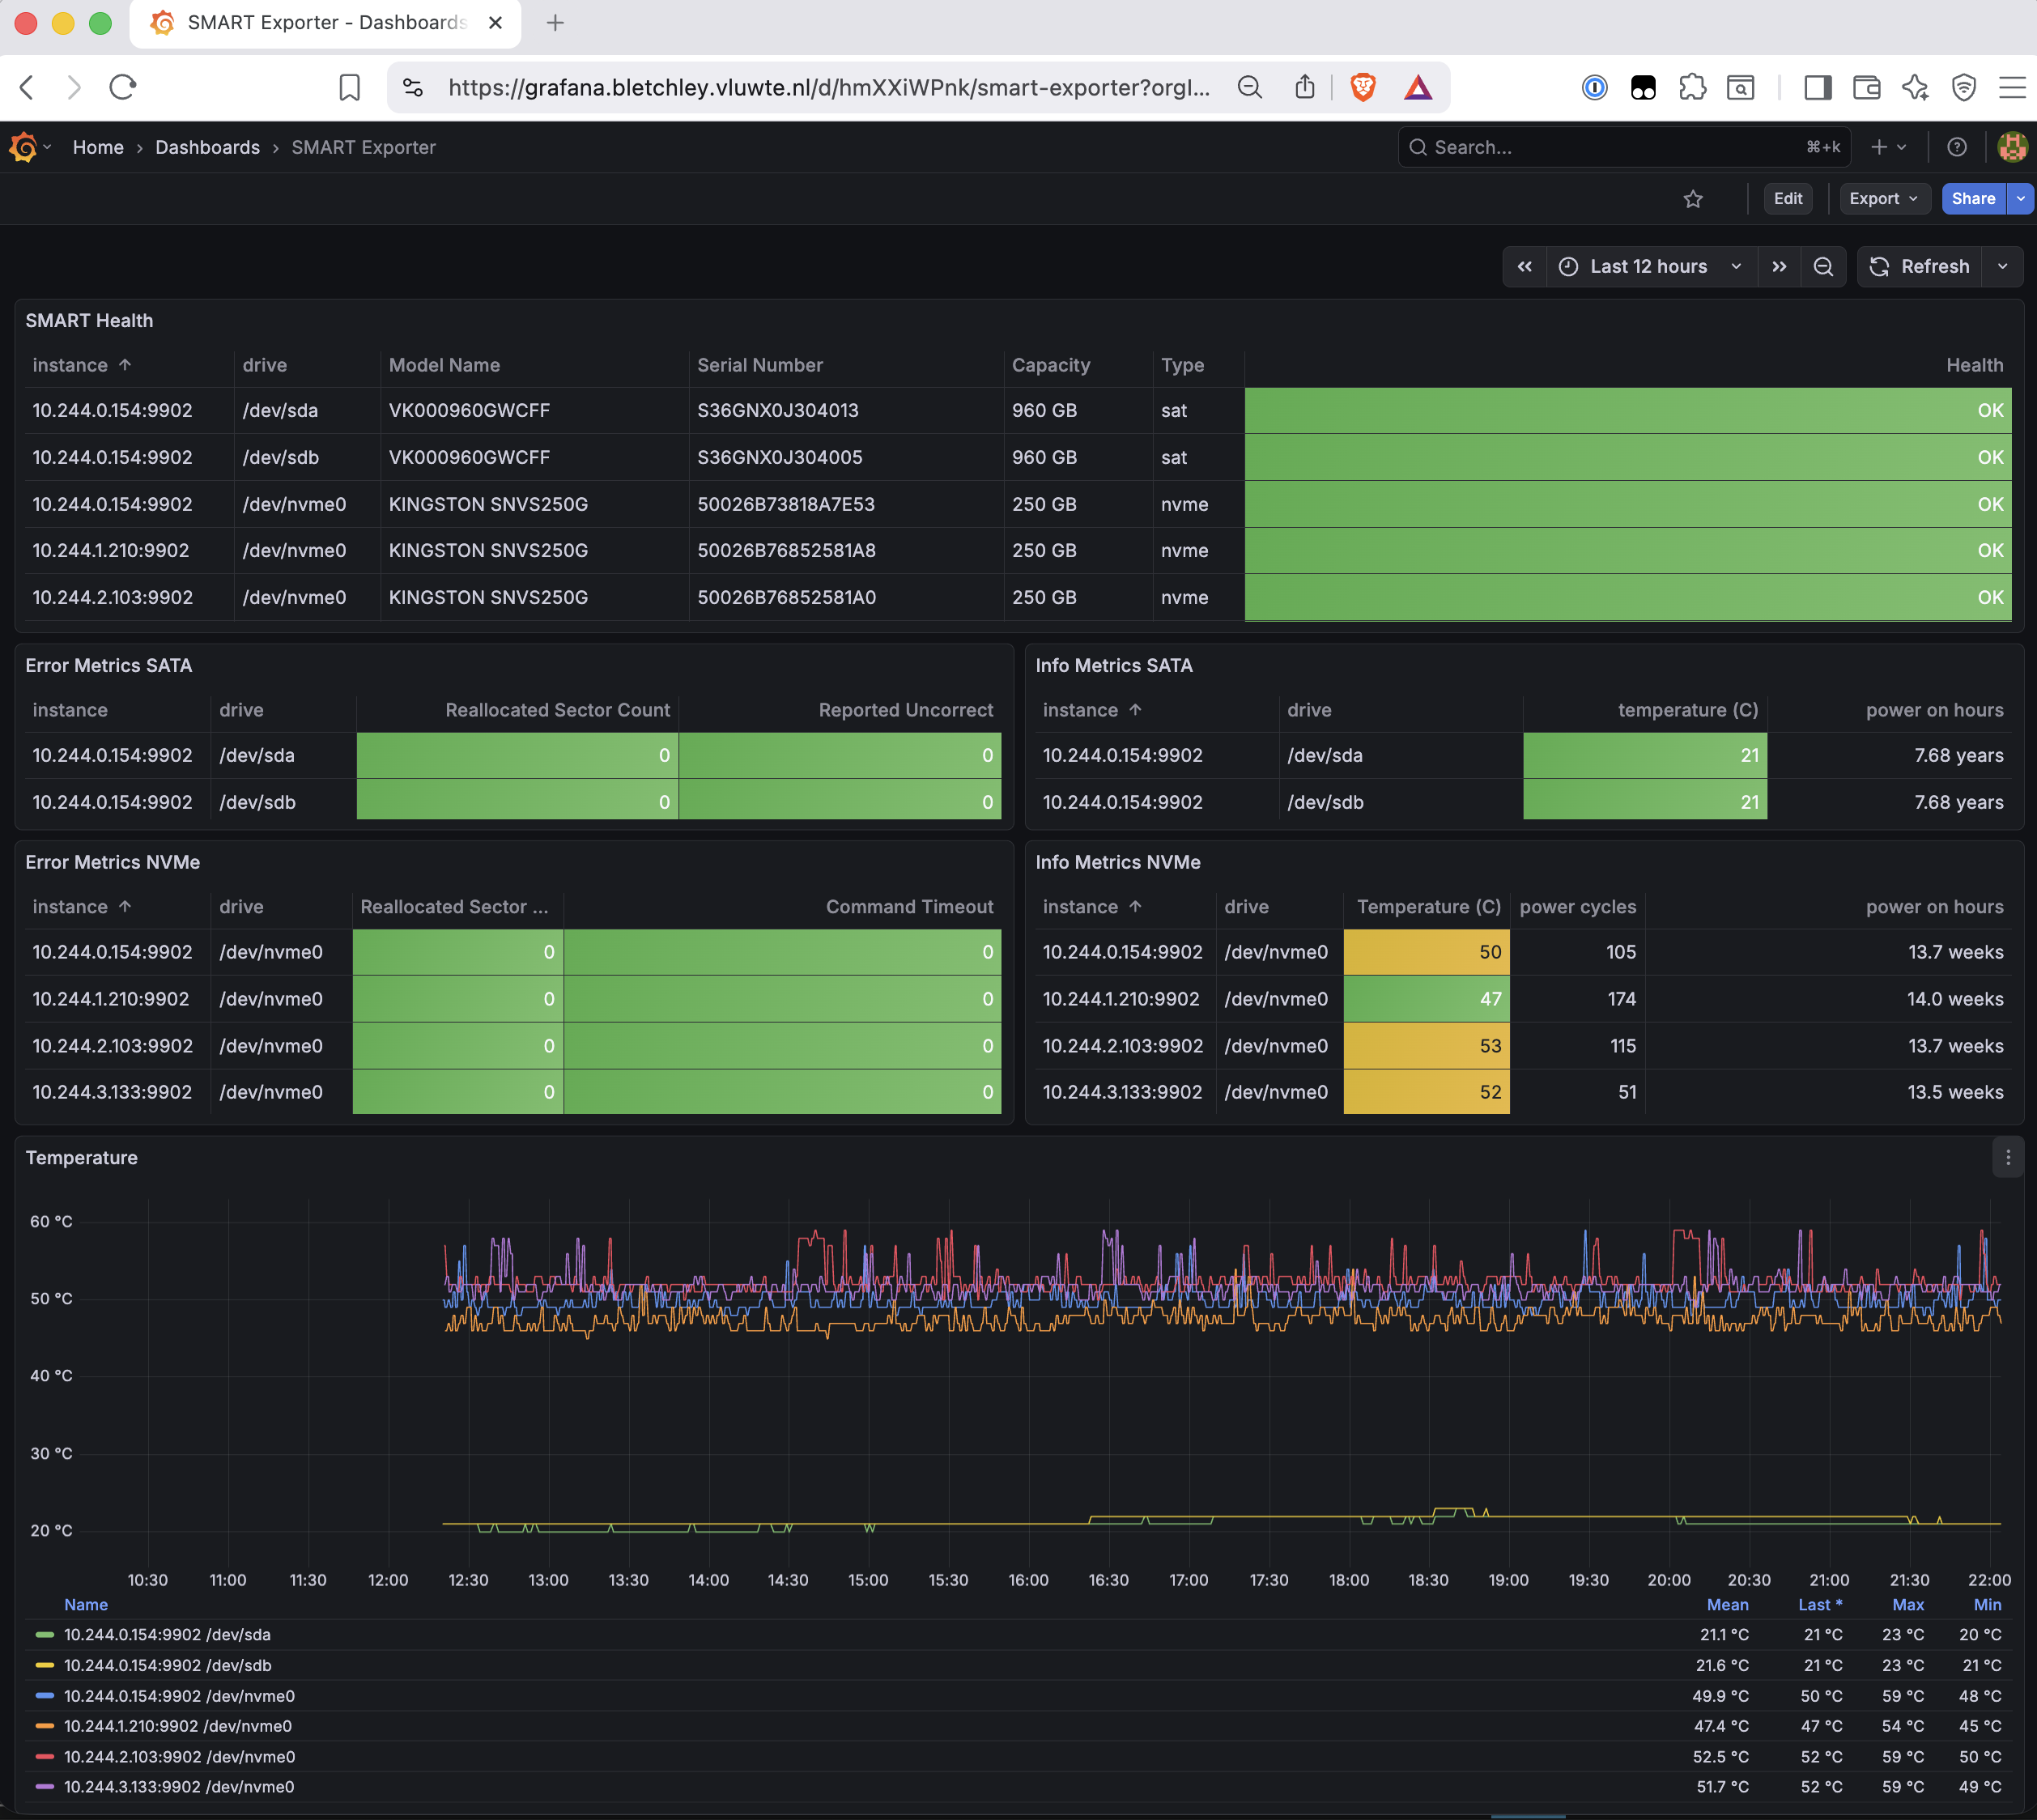
One detail in the Info Metrics SATA panel: 7.68 years. These VK000960GWCFF drives have been running continuously for nearly eight years. That context makes the SMART monitoring feel less precautionary and more like active management of hardware that has genuine history behind it.
One fix required for the error panels: the upstream dashboard had the "No value" field set to "Ignored", which caused columns where all values are zero to disappear entirely. Changing it to "As zeros" makes the zeros explicit — confirming that the metrics are being collected and reporting clean, not that the column is missing.
The extended dashboard JSON is stored in apps/monitoring/grafana/grafana_dashboard_smartctl.json. It is not auto-provisioned — Grafana loads it from its Longhorn-backed persistent volume, backed up like all other Grafana state. The file in git is a recovery reference if Grafana ever needs to be rebuilt from scratch.
The ZFS Dashboard
ZFS dashboard ID 7845 imports from the Grafana library. It has a node template variable that scopes the panels to a specific instance — set to rock3.vluwte.nl since ZFS metrics only exist there.
Most of the dashboard works well. The ARC section shows exactly what matters:
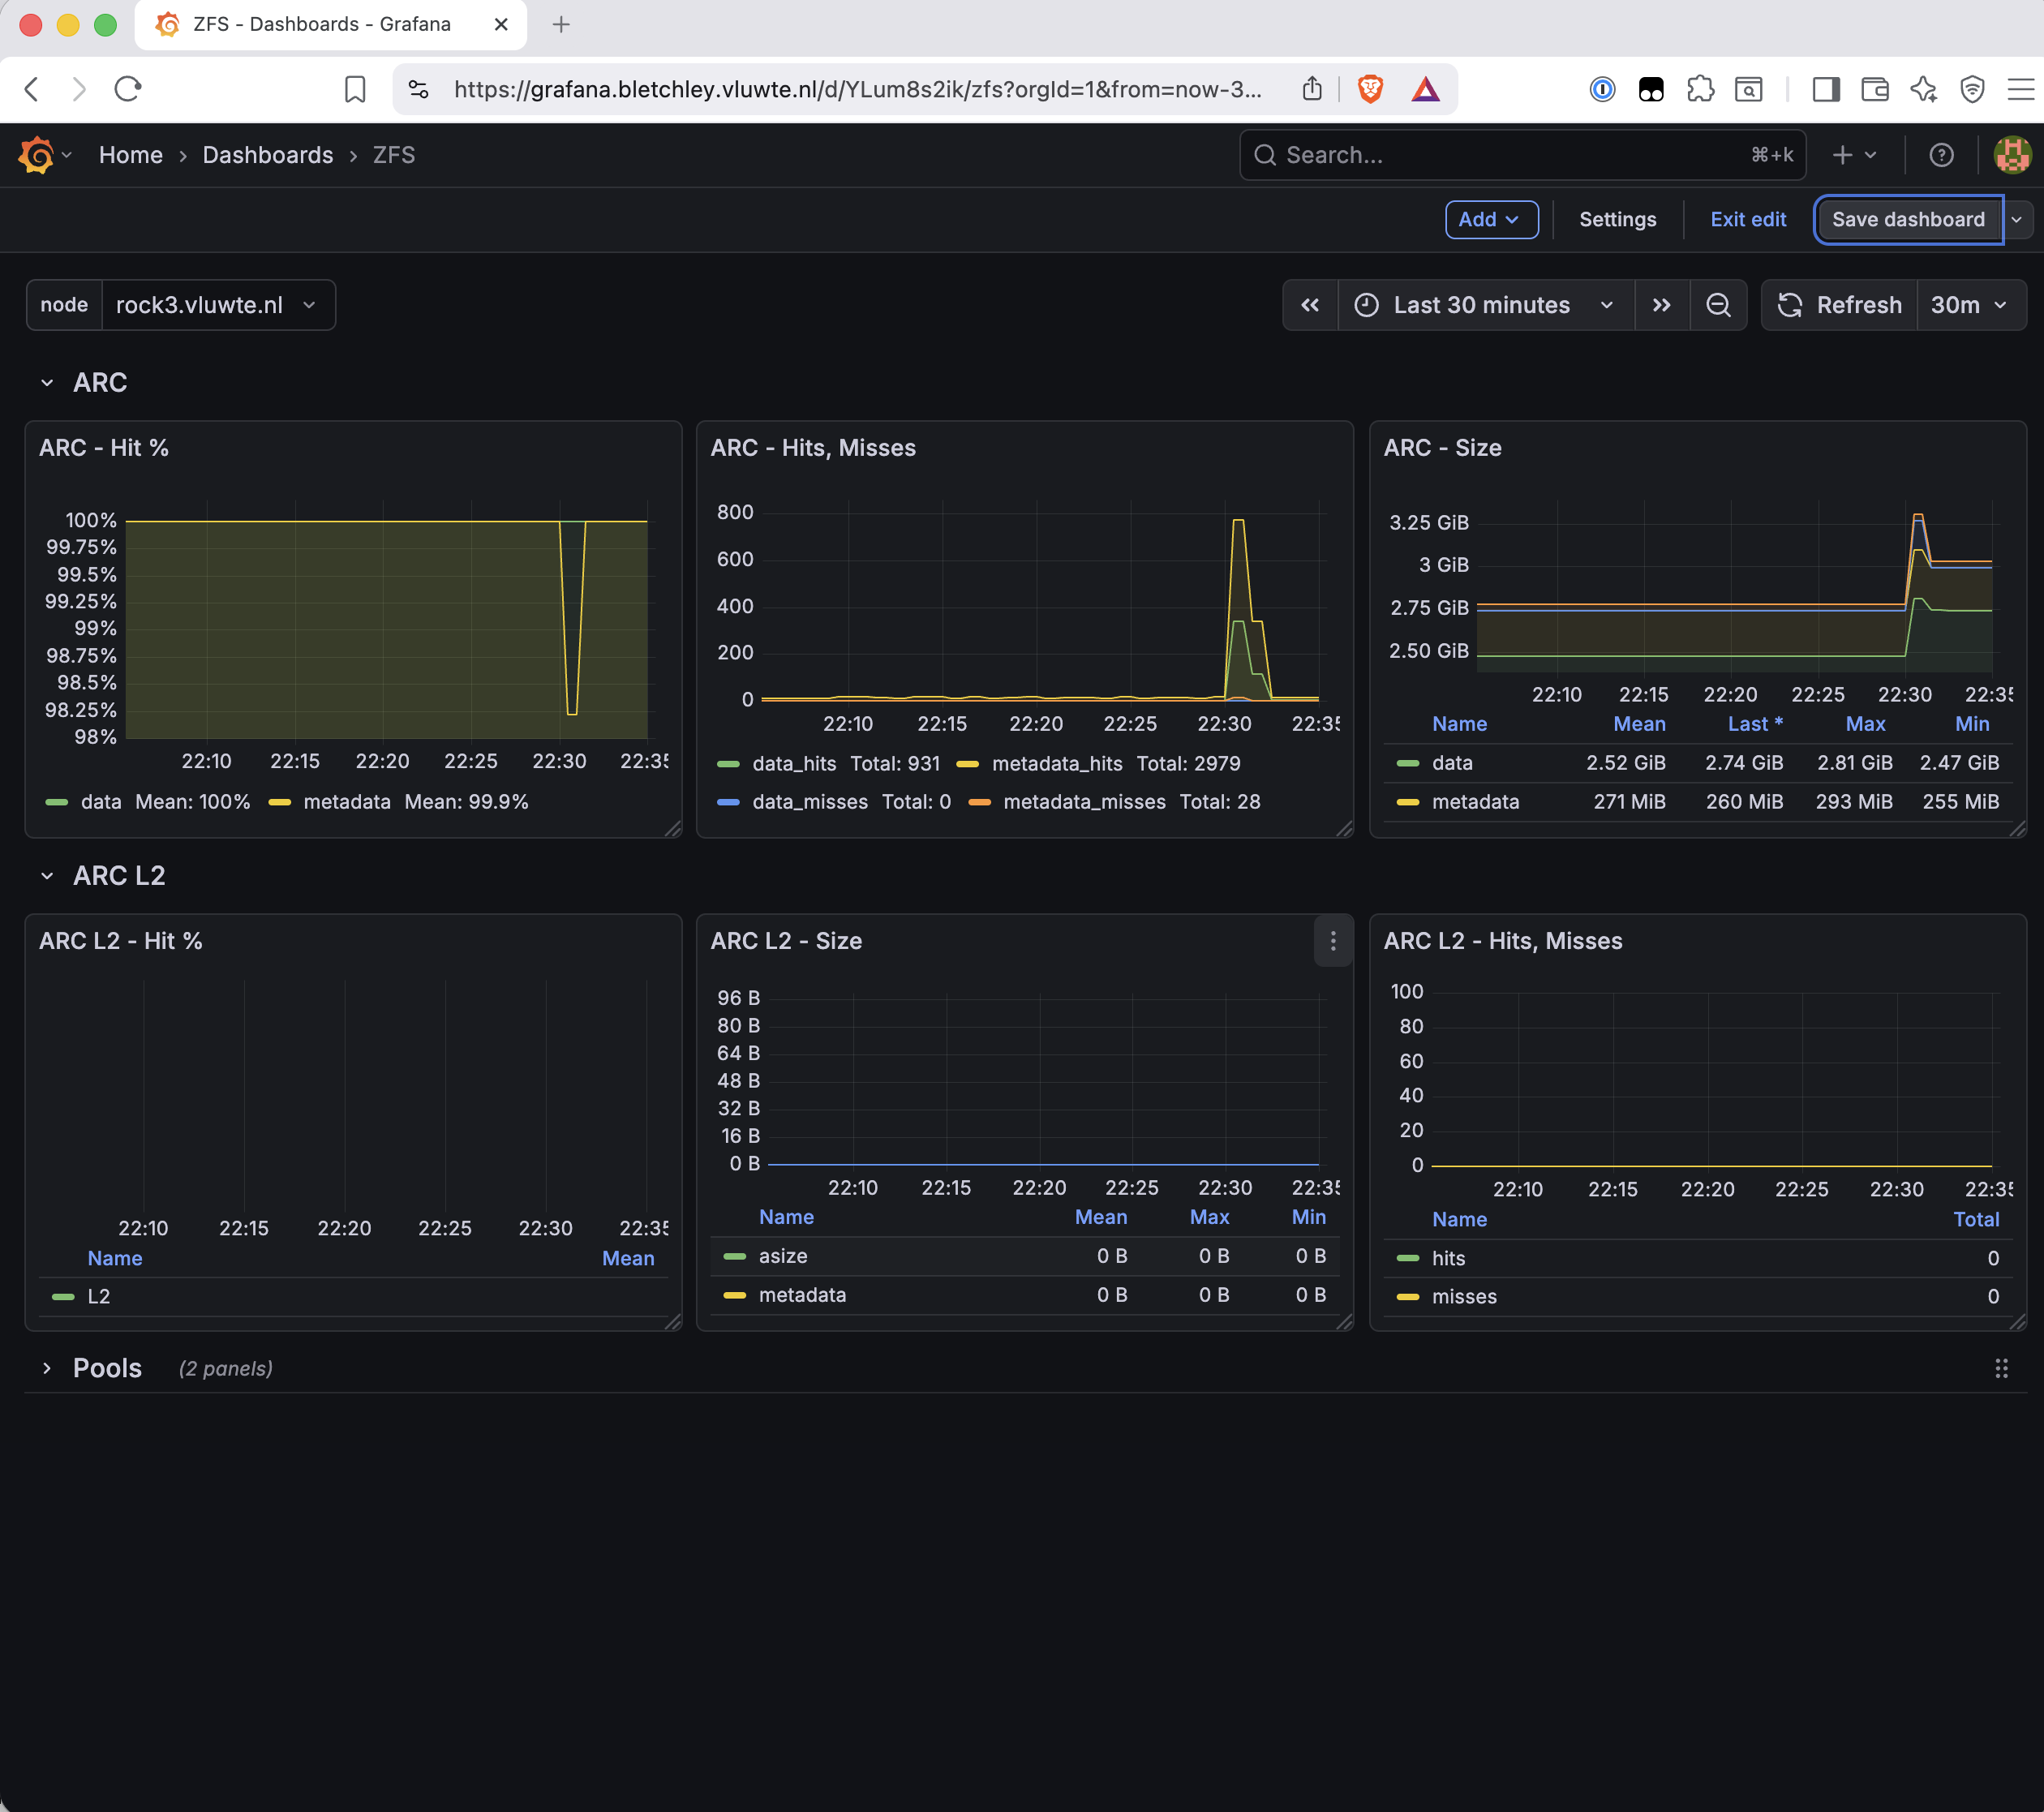
The ARC L2 panels showing zeros is expected. L2ARC is a secondary cache on a separate fast device — rock3 doesn't have one, so the panels are accurately empty rather than broken.
The Pools section is a different story. Two panels — ZPOOL - Time and ZPOOL - Ops — show "No data":
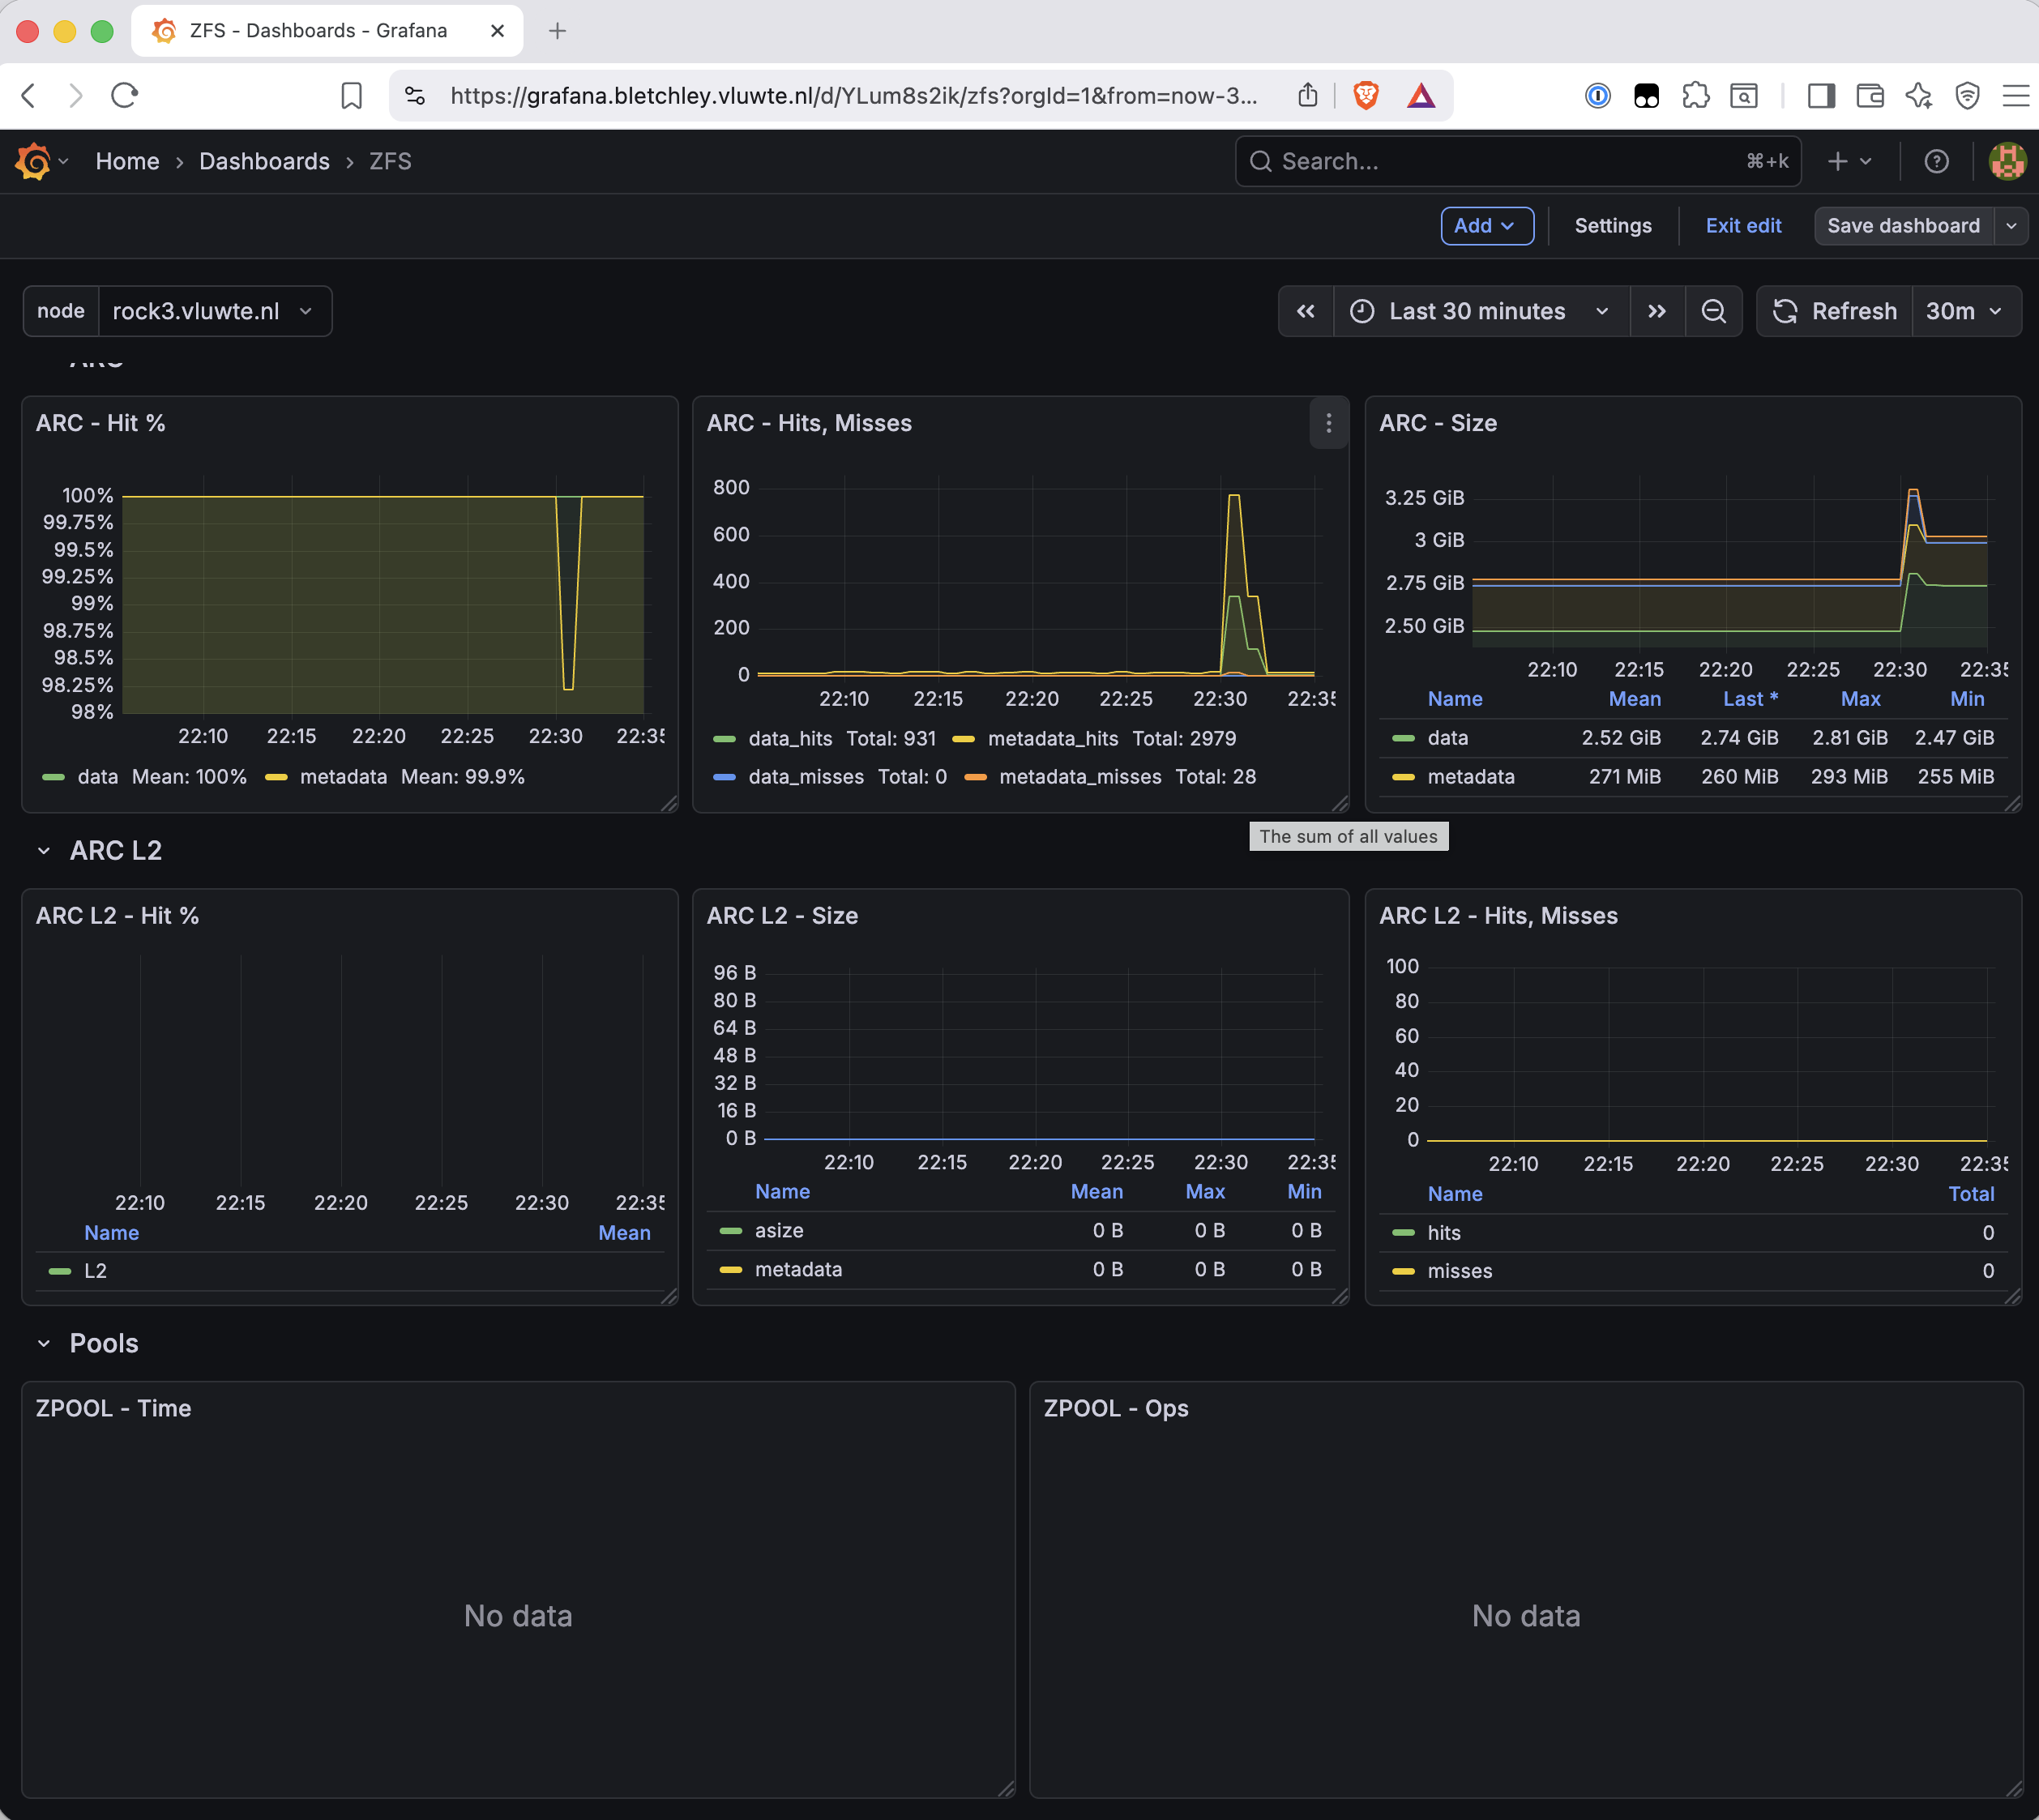
These panels use node_zfs_zpool_rtime and node_zfs_zpool_reads. OpenZFS 2.1 changed how pool I/O statistics are exposed — those kstat paths are no longer available at /proc/spl/kstat/zfs/. Node Exporter v1.10.2 — well above the 1.4.0 version that added patches for this — is not the issue. The iostats kstat file exists, but the specific pool-level I/O paths these panels need are not there on this kernel version.
Rather than deleting the panels, the Pools section is moved to the bottom and collapsed. The panels still exist and are visible as "2 panels" in the collapsed header — documented rather than hidden. If a future Node Exporter update or OpenZFS version restores the metrics, the panels will start working again automatically.
Alert Rules
The alert rules live in prometheus-values.yaml under serverFiles."alerting_rules.yml" alongside the existing rules from Part 4. All 19 hardware rules are in a single hardware group — using multiple groups would work, but one group with inline comments is simpler to read and there are no evaluation interval requirements that would justify splitting.
Before applying with helm upgrade, the rules are validated:
yq '.serverFiles."alerting_rules.yml"' \
  ~/talos-cluster/bletchley/apps/monitoring/prometheus/prometheus-values.yaml \
  > /tmp/hardware-rules.yaml

promtool check rules /tmp/hardware-rules.yaml
# Checking /tmp/hardware-rules.yaml
#   SUCCESS: 37 rules found
The yq command extracts the alerting rules section — which already has the groups: wrapper — into a standalone file that promtool can validate. This catches PromQL syntax errors before they reach the cluster.
ZFS Pool State
- name: hardware
  rules:

    # ── ZFS Pool State ────────────────────────────────────────────────
    # node_zfs_zpool_state emits one series per state value per pool.
    # A state is active when its value == 1.
    # Degraded = one or more devices unavailable; the pool is still
    # serving data but redundancy is reduced.
    # On a two-disk mirror, degraded means one more failure loses data.
    # Faulted/suspended/unavail = pool not serving data.
    # Offline/removed = may be intentional but worth alerting on.

    - alert: ZFSPoolDegraded
      expr: node_zfs_zpool_state{job="node-exporter", state="degraded"} == 1
      for: 5m
      labels:
        severity: critical
      annotations:
        summary: "ZFS pool degraded on {{ $labels.instance }}"
        description: "Pool {{ $labels.zpool }} is degraded — one disk has failed. Redundancy is gone. Replace the failed disk immediately."
The original plan had a single ZFSPoolNotOnline rule. That was wrong — a degraded mirror is still online (the pool keeps serving data) but redundancy is gone, and that's the most important state to know about immediately. The correct approach is one rule per state: six rules covering degraded, faulted, suspended, unavail, offline, and removed. The first four are critical; the last two are warning since they may be intentional.
The metric name is node_zfs_zpool_state (not node_zfs_pool_state, which appears in some documentation and older examples). Always verify against your own /metrics output. The pool label is zpool, not pool. The job="node-exporter" filter scopes naturally to rock3, since only rock3 has ZFS metrics, and gives clean hostname instance labels rather than the pod-IP-style labels that the kubernetes-service-endpoints job produces.
SMART and NVMe
    # ── SMART — All Drives ────────────────────────────────────────────
    # smartprom_ metrics come from the matusnovak/prometheus-smartctl
    # DaemonSet (port 9902). Instance labels are pod IPs, not hostnames.
    # Virtual SCSI devices (TuringPi BMC / Longhorn) appear with
    # type="scsi" and must be excluded from all rules.

    - alert: DiskSMARTFailing
      expr: smartprom_smart_passed{type!="scsi"} == 0
      for: 5m
      labels:
        severity: critical
      annotations:
        summary: "SMART failure on {{ $labels.instance }} drive {{ $labels.drive }}"
        description: "SMART overall health check returned failing status."

    # ── SMART — NVMe Specific ─────────────────────────────────────────
    # NVMe drives use different SMART attributes from SATA.
    # percentage_used and available_spare are NVMe-only metrics.
    # available_spare_threshold is manufacturer-set (Kingston: 10%).
    # Baseline: wear 20–31%, spare 100% on all four nodes.

    - alert: NVMeWearHigh
      expr: smartprom_percentage_used{type="nvme"} > 80
      for: 1h
      labels:
        severity: warning
      annotations:
        summary: "NVMe wear indicator high on {{ $labels.instance }}"
        description: "Drive {{ $labels.drive }} is at {{ $value }}% used life."

    - alert: NVMeSpareCapacityLow
      expr: smartprom_available_spare{type="nvme"} <= smartprom_available_spare_threshold{type="nvme"}
      for: 1h
      labels:
        severity: critical
      annotations:
        summary: "NVMe spare capacity critical on {{ $labels.instance }}"
        description: "Drive {{ $labels.drive }} available spare {{ $value }}% at or below manufacturer threshold."
One caveat on DiskSMARTFailing: overall SMART status is a coarse signal. Many drives continue to report PASSED right up until they fail. The rule catches hard failures, but the attribute-level panels in the dashboard — reallocated sectors for SATA, media errors for NVMe — are worth watching alongside it. Those metrics can show deterioration long before the overall status changes.
NVMeSpareCapacityLow uses the manufacturer's own threshold directly rather than a hardcoded number. Kingston sets the danger threshold at 10% — when available spare drops to or below that, the drive itself considers the situation critical. Using smartprom_available_spare_threshold in the expression means the alert fires at exactly the threshold the manufacturer chose, regardless of what that number is for a given drive. Know that this expression relies on both metrics having identical label sets; if your exporter adds extra labels, you may need an on(...) clause to align the series.
Disk Temperature
Temperature alerting is where the two-metric-name problem shows up again:
    # ── SMART — Disk Temperature ───────────────────────────────────────
    # SATA and NVMe use different metric names for temperature:
    #   SATA: smartprom_temperature_celsius_raw (type="sat") — idle ~21°C
    #   NVMe: smartprom_temperature (type="nvme") — idle ~49°C
    # Warning threshold (65°C) is a conservative shared value for both.
    # Critical thresholds are manufacturer-sourced from
    # node_hwmon_temp_crit_celsius: SATA=70°C, NVMe=89°C.
    # DiskTemperatureAlarm fires immediately (for: 0m) when the NVMe
    # drive's own hardware alarm flag is set — the most authoritative
    # signal, no threshold calculation needed.

    - alert: DiskTemperatureHigh
      expr: >
        smartprom_temperature_celsius_raw{type="sat"} > 65
        or
        smartprom_temperature{type="nvme"} > 65
      for: 10m
      labels:
        severity: warning
      annotations:
        summary: "Disk temperature high on {{ $labels.instance }}"
        description: "Drive {{ $labels.drive }} at {{ $value }}°C — threshold is 65°C."

    - alert: DiskTemperatureCritical
      expr: >
        smartprom_temperature_celsius_raw{type="sat"} > 70
        or
        smartprom_temperature{type="nvme"} > 89
      for: 5m
      labels:
        severity: critical
      annotations:
        summary: "Disk temperature critical on {{ $labels.instance }}"
        description: "Drive {{ $labels.drive }} at {{ $value }}°C — at or above manufacturer critical threshold (SATA: 70°C, NVMe: 89°C)."

    - alert: DiskTemperatureAlarm
      expr: node_hwmon_temp_alarm{job="node-exporter", chip="nvme_nvme0"} == 1
      for: 0m
      labels:
        severity: critical
      annotations:
        summary: "NVMe temperature alarm on {{ $labels.instance }}"
        description: "NVMe drive hardware temperature alarm triggered — drive has exceeded its own critical threshold of 89.85°C."
The critical thresholds — SATA at 70°C, NVMe at 89°C — come from node_hwmon_temp_crit_celsius, read from the kernel's hwmon interface. These values are typically derived from device firmware, but may vary depending on drivers and hardware support. The SATA drives on rock3 idle at 21°C; NVMe drives idle around 49°C. Both are well below their warning thresholds at baseline.
DiskTemperatureAlarm has for: 0m — no delay. When the drive's own hardware alarm flag fires, the alert fires on the first evaluation where the condition is true, with no additional waiting period. This is different from the threshold-based rules: there is no value in waiting when the hardware itself is telling you there is a problem.
Node Temperature and Fan
    # ── Node Temperature (SoC) ────────────────────────────────────────
    # RK3588 exposes 7 thermal zones (zone0–zone6): package, big cores
    # (0 and 2), little cores, center, GPU, NPU. temp0 and temp1 report
    # identical values per zone — chip=~"thermal_thermal_zone.*" covers
    # all zones while excluding nvme_nvme0 and target* SATA drivetemp
    # sensors, both of which are covered by smartprom rules above.
    # max by (instance) fires one alert per node on the hottest zone.
    # Idle baseline: 46–48°C. No hwmon critical threshold available for
    # RK3588 thermal zones — 75°C warning and 90°C critical are
    # conservative values based on RK3588 datasheet behaviour.

    - alert: NodeTemperatureHigh
      expr: >
        max by (instance) (
          node_hwmon_temp_celsius{
            job="node-exporter",
            chip=~"thermal_thermal_zone.*"
          }
        ) > 75
      for: 10m
      labels:
        severity: warning
      annotations:
        summary: "Node SoC temperature high on {{ $labels.instance }}"
        description: "Hottest thermal zone at {{ $value }}°C — idle baseline is 46–48°C."

    - alert: NodeTemperatureCritical
      expr: >
        max by (instance) (
          node_hwmon_temp_celsius{
            job="node-exporter",
            chip=~"thermal_thermal_zone.*"
          }
        ) > 90
      for: 5m
      labels:
        severity: critical
      annotations:
        summary: "Node SoC temperature critical on {{ $labels.instance }}"
        description: "Hottest thermal zone at {{ $value }}°C — thermal throttling or shutdown risk."

    # ── Fan Speed ─────────────────────────────────────────────────────
    # All four nodes have a PWM fan (chip="platform_pwm_fan", sensor="fan1").
    # Idle RPM varies significantly by workload: rock3 ~2580 RPM,
    # rock1/2/4 ~263–321 RPM. Alert only on 0 RPM (fan stopped) to
    # avoid false fires from the wide normal idle range.

    - alert: NodeFanStopped
      expr: >
        node_hwmon_fan_rpm{
          job="node-exporter",
          chip="platform_pwm_fan"
        } == 0
      for: 5m
      labels:
        severity: critical
      annotations:
        summary: "Fan stopped on {{ $labels.instance }}"
        description: "Fan {{ $labels.sensor }} reading 0 RPM — possible fan failure."
The RK3588 exposes seven thermal zones through node_hwmon_temp_celsius — package, big cores, little cores, center, GPU, and NPU. Each zone also has temp0 and temp1 sensors that report identical values. Rather than writing seven separate rules that would all fire for the same physical event, max by (instance) reduces this to one alert per node showing the hottest zone.
The chip=~"thermal_thermal_zone.*" regex excludes nvme_nvme0 (covered by smartprom_temperature) and target* (SATA drivetemp, covered by smartprom_temperature_celsius_raw). No double-alerting.
Fan speed is simpler. Idle RPM varies enormously — rock3 runs at ~2580 RPM under its heavier workload while rock1/2/4 idle at 263–321 RPM. Any threshold between those values would produce constant false fires. The only unambiguously wrong value is zero. NodeFanStopped alerts only when a fan has stopped completely.
Garage
    # ── Garage ────────────────────────────────────────────────────────
    # Garage metrics use bare names (no garage_ prefix) for cluster
    # health and resync metrics. Disk space metrics use garage_ prefix.
    # Both volume="data" and volume="metadata" report identical disk
    # numbers — scope to volume="data" to avoid double-firing.
    # Current usage ~4.4% (22 GB of 500 GB ZFS quota on rock3).

    - alert: GarageClusterUnhealthy
      expr: cluster_healthy{job="garage"} == 0
      for: 5m
      labels:
        severity: critical
      annotations:
        summary: "Garage cluster unhealthy"
        description: "One or more Garage nodes are disconnected."

    - alert: GarageClusterUnavailable
      expr: cluster_available{job="garage"} == 0
      for: 1m
      labels:
        severity: critical
      annotations:
        summary: "Garage cluster unavailable"
        description: "Garage cannot serve requests — cluster quorum lost."

    - alert: GarageBlockResyncErrors
      expr: block_resync_errored_blocks{job="garage"} > 0
      for: 15m
      labels:
        severity: warning
      annotations:
        summary: "Garage block resync errors"
        description: "{{ $value }} blocks failed to resync — data integrity risk."

    - alert: GarageStorageNearFull
      expr: garage_local_disk_avail{volume="data"} / garage_local_disk_total{volume="data"} < 0.15
      for: 1h
      labels:
        severity: warning
      annotations:
        summary: "Garage disk space low"
        description: "Less than 15% free on Garage data volume. Current baseline ~95.6% free (478 GB of 500 GB)."
Two things worth noting here. First, the metric names: cluster_healthy, cluster_available, and block_resync_errored_blocks have no garage_ prefix, despite being Garage metrics. The disk space metrics — garage_local_disk_avail and garage_local_disk_total — do. This reflects a mix of cluster-level and node-level metrics rather than a strict naming convention.
Second, the volume="data" filter on the disk rules. Garage exposes both volume="data" and volume="metadata" label values, both reporting identical numbers from the same underlying ZFS dataset. Without the filter, an alert would fire twice for the same condition.
Testing the Alert Pipeline
Most of these rules cannot be tested by triggering the real condition — pulling a disk to simulate ZFS degradation is not something to do casually, and inducing a SMART failure is not possible at all. What can be tested is the alert pipeline: that Prometheus evaluates the rule, Alertmanager receives the alert, and the email arrives with correctly resolved labels.
For the rules with numeric thresholds, the test is straightforward: set the threshold to a value that the current baseline readings exceed, apply with helm upgrade, wait for the for durations to elapse, and confirm the emails arrive.
All six testable rules are triggered simultaneously. Triggering them together speeds up validation and works well here since the rules are independent.
# Test thresholds — replace production values, apply, wait, restore

DiskTemperatureHigh:   > 15°C  (SATA at 21°C, NVMe at 49°C both fire)
DiskTemperatureCritical: > 16°C (1°C gap confirms both alert names are distinct)
NodeTemperatureHigh:   > 40°C  (SoC at 46–48°C fires on all four nodes)
NodeTemperatureCritical: > 41°C
NodeFanStopped:        < 5000 RPM (all fans below rock3's ~2580 RPM)
GarageStorageNearFull: < 0.99 free ratio (4.4% used triggers immediately)
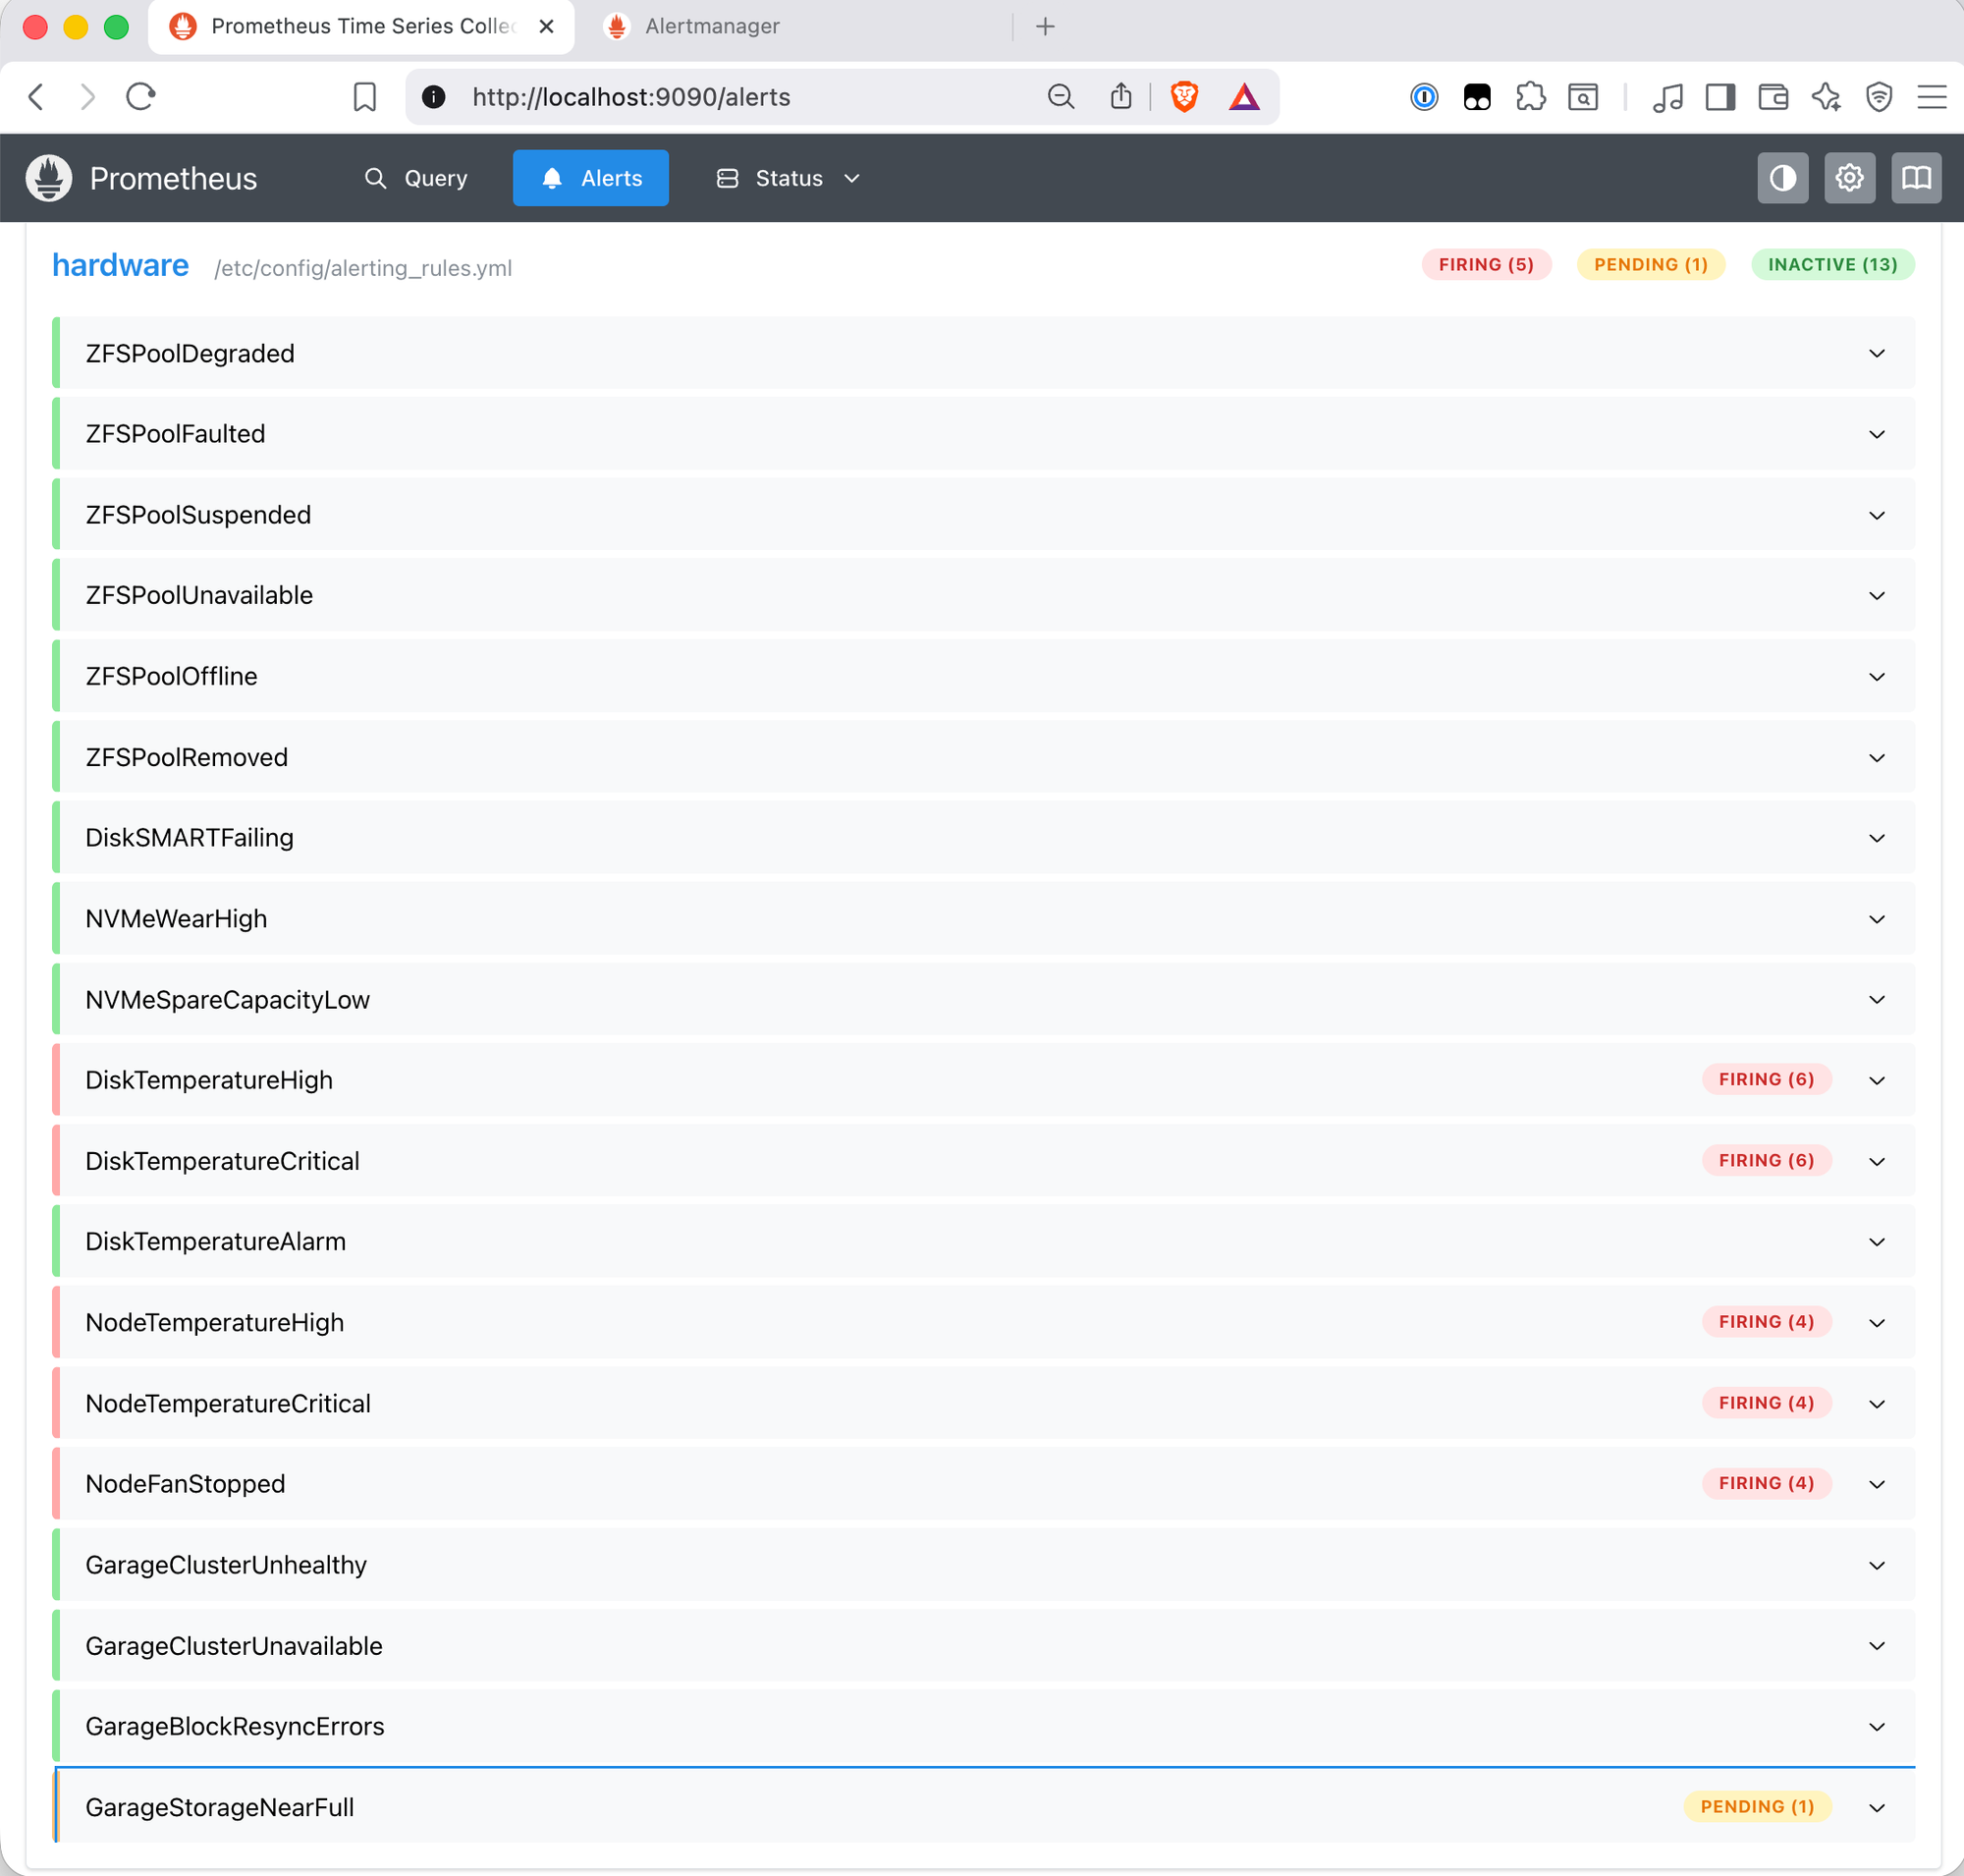
After the upgrade, all six rules enter pending state:
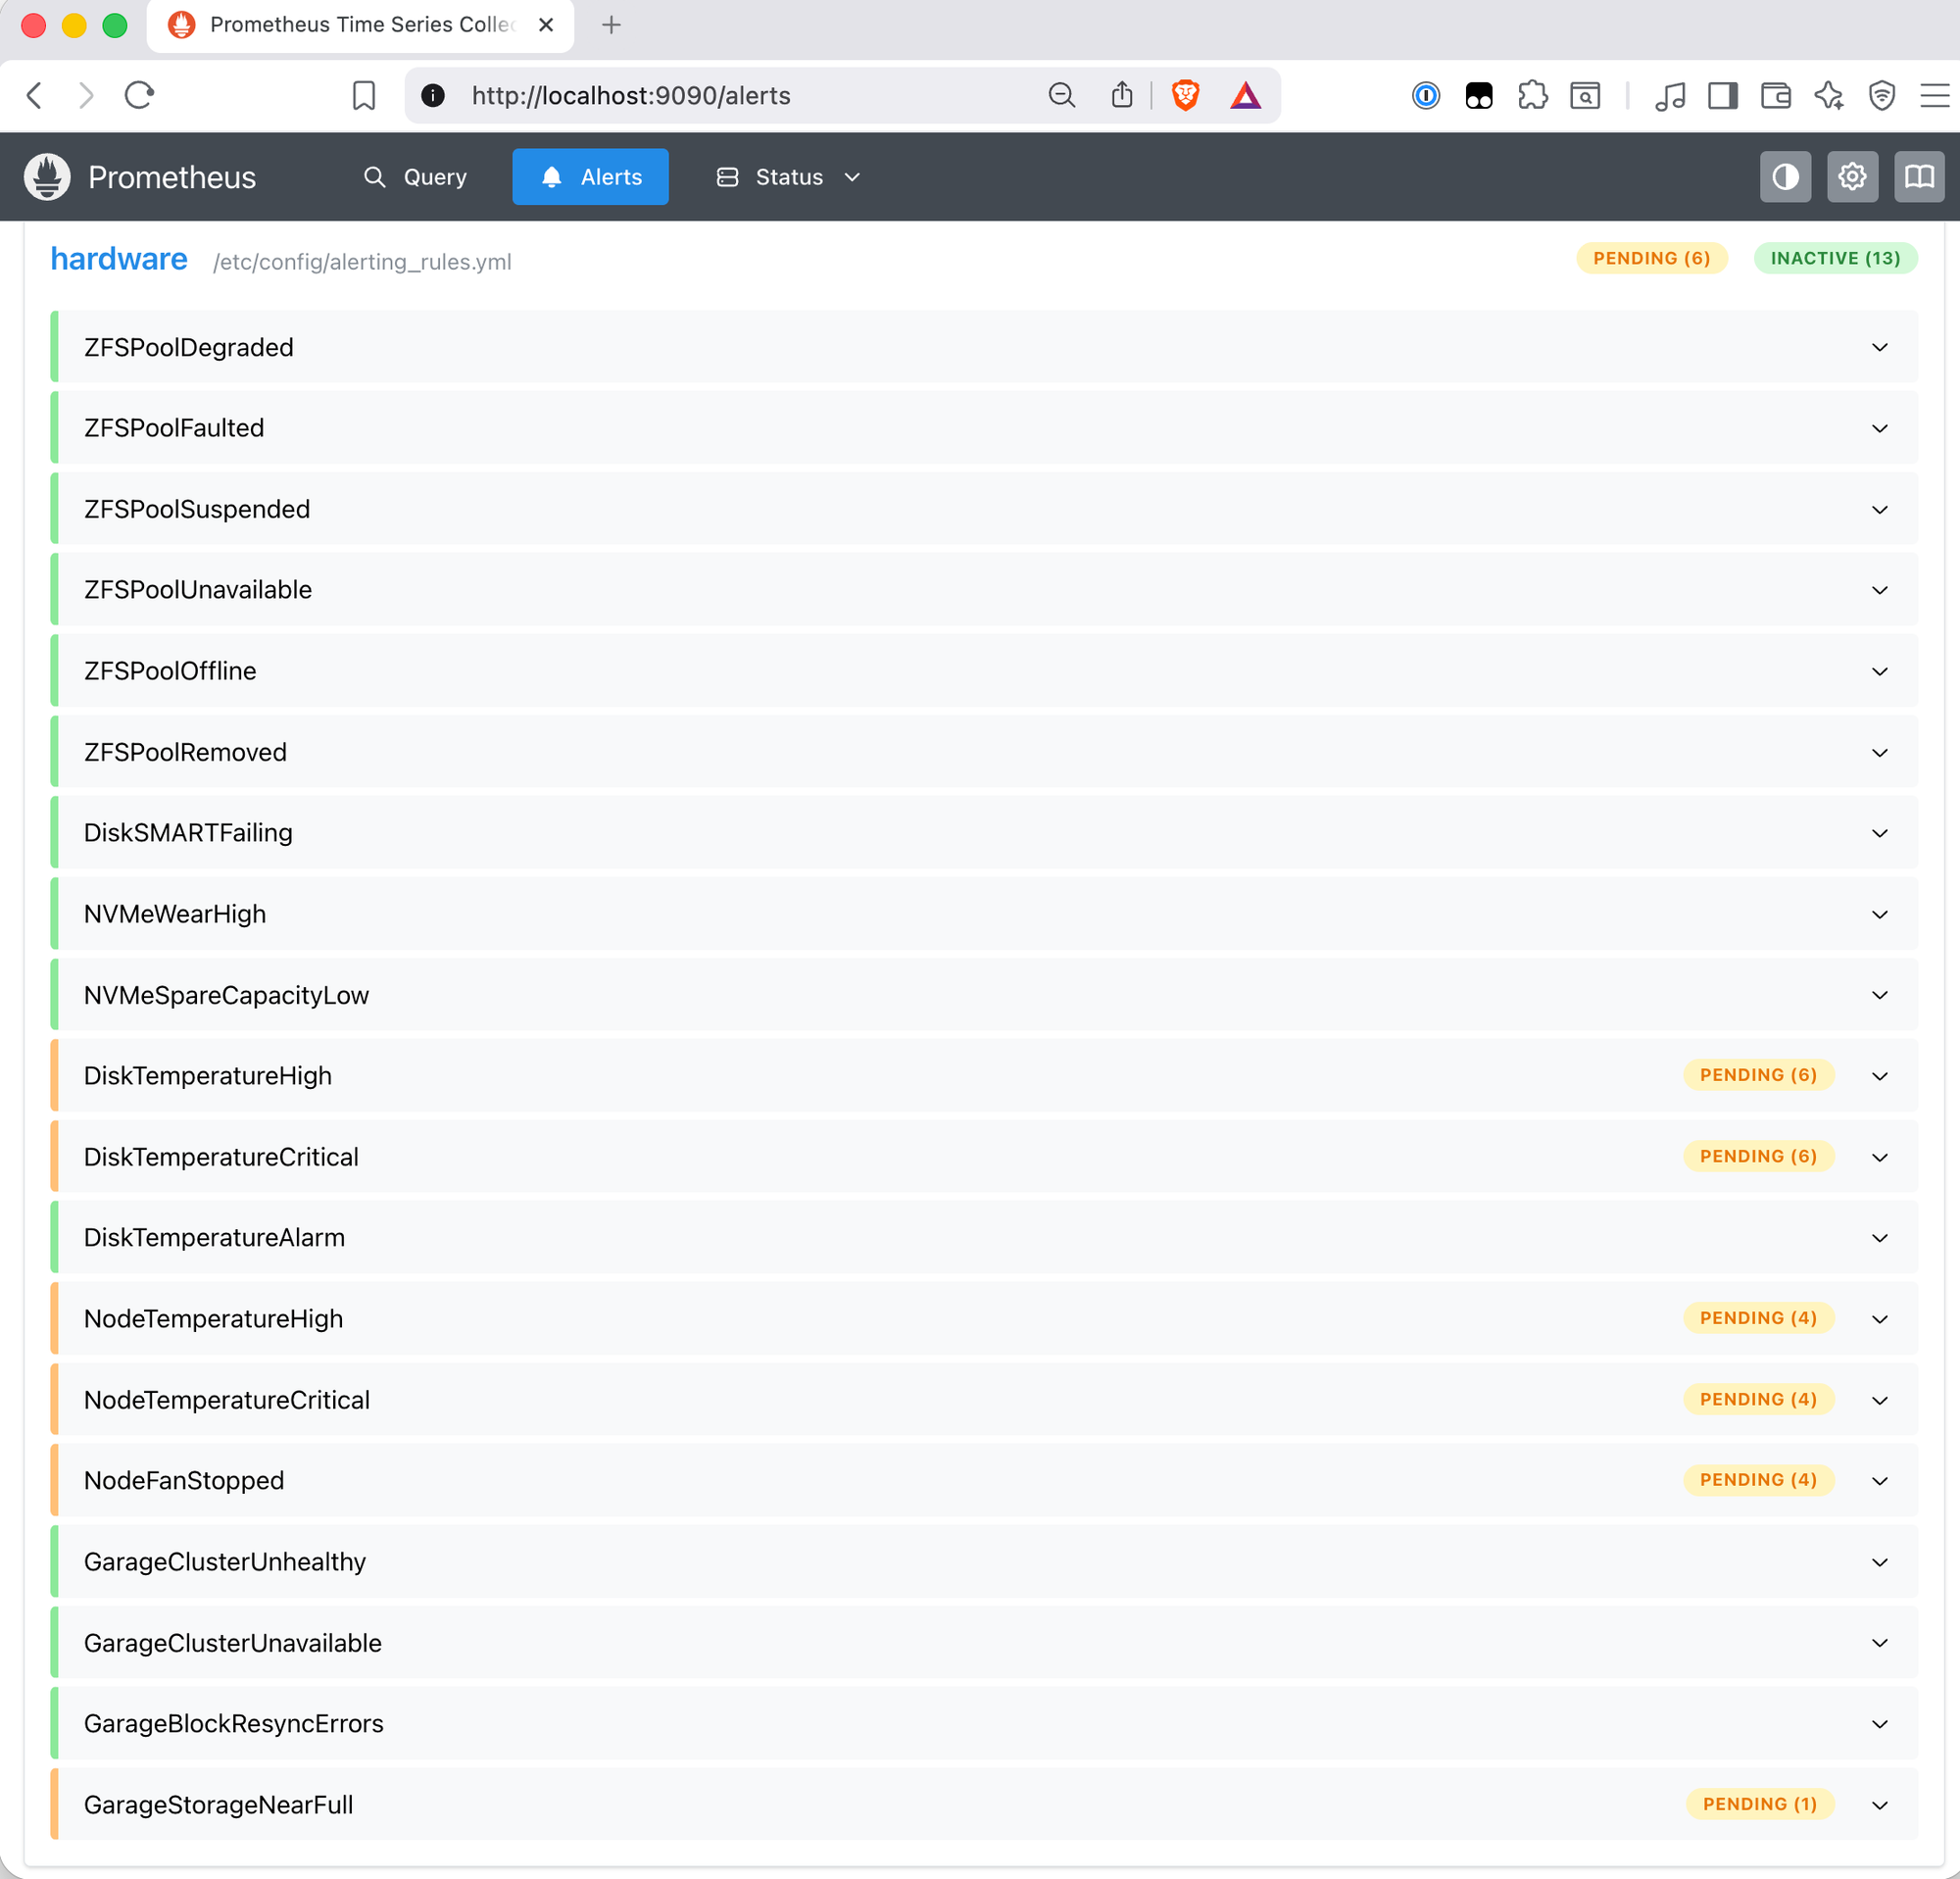
The for durations are the interesting part. At around five minutes, the rules with for: 5m fire first:
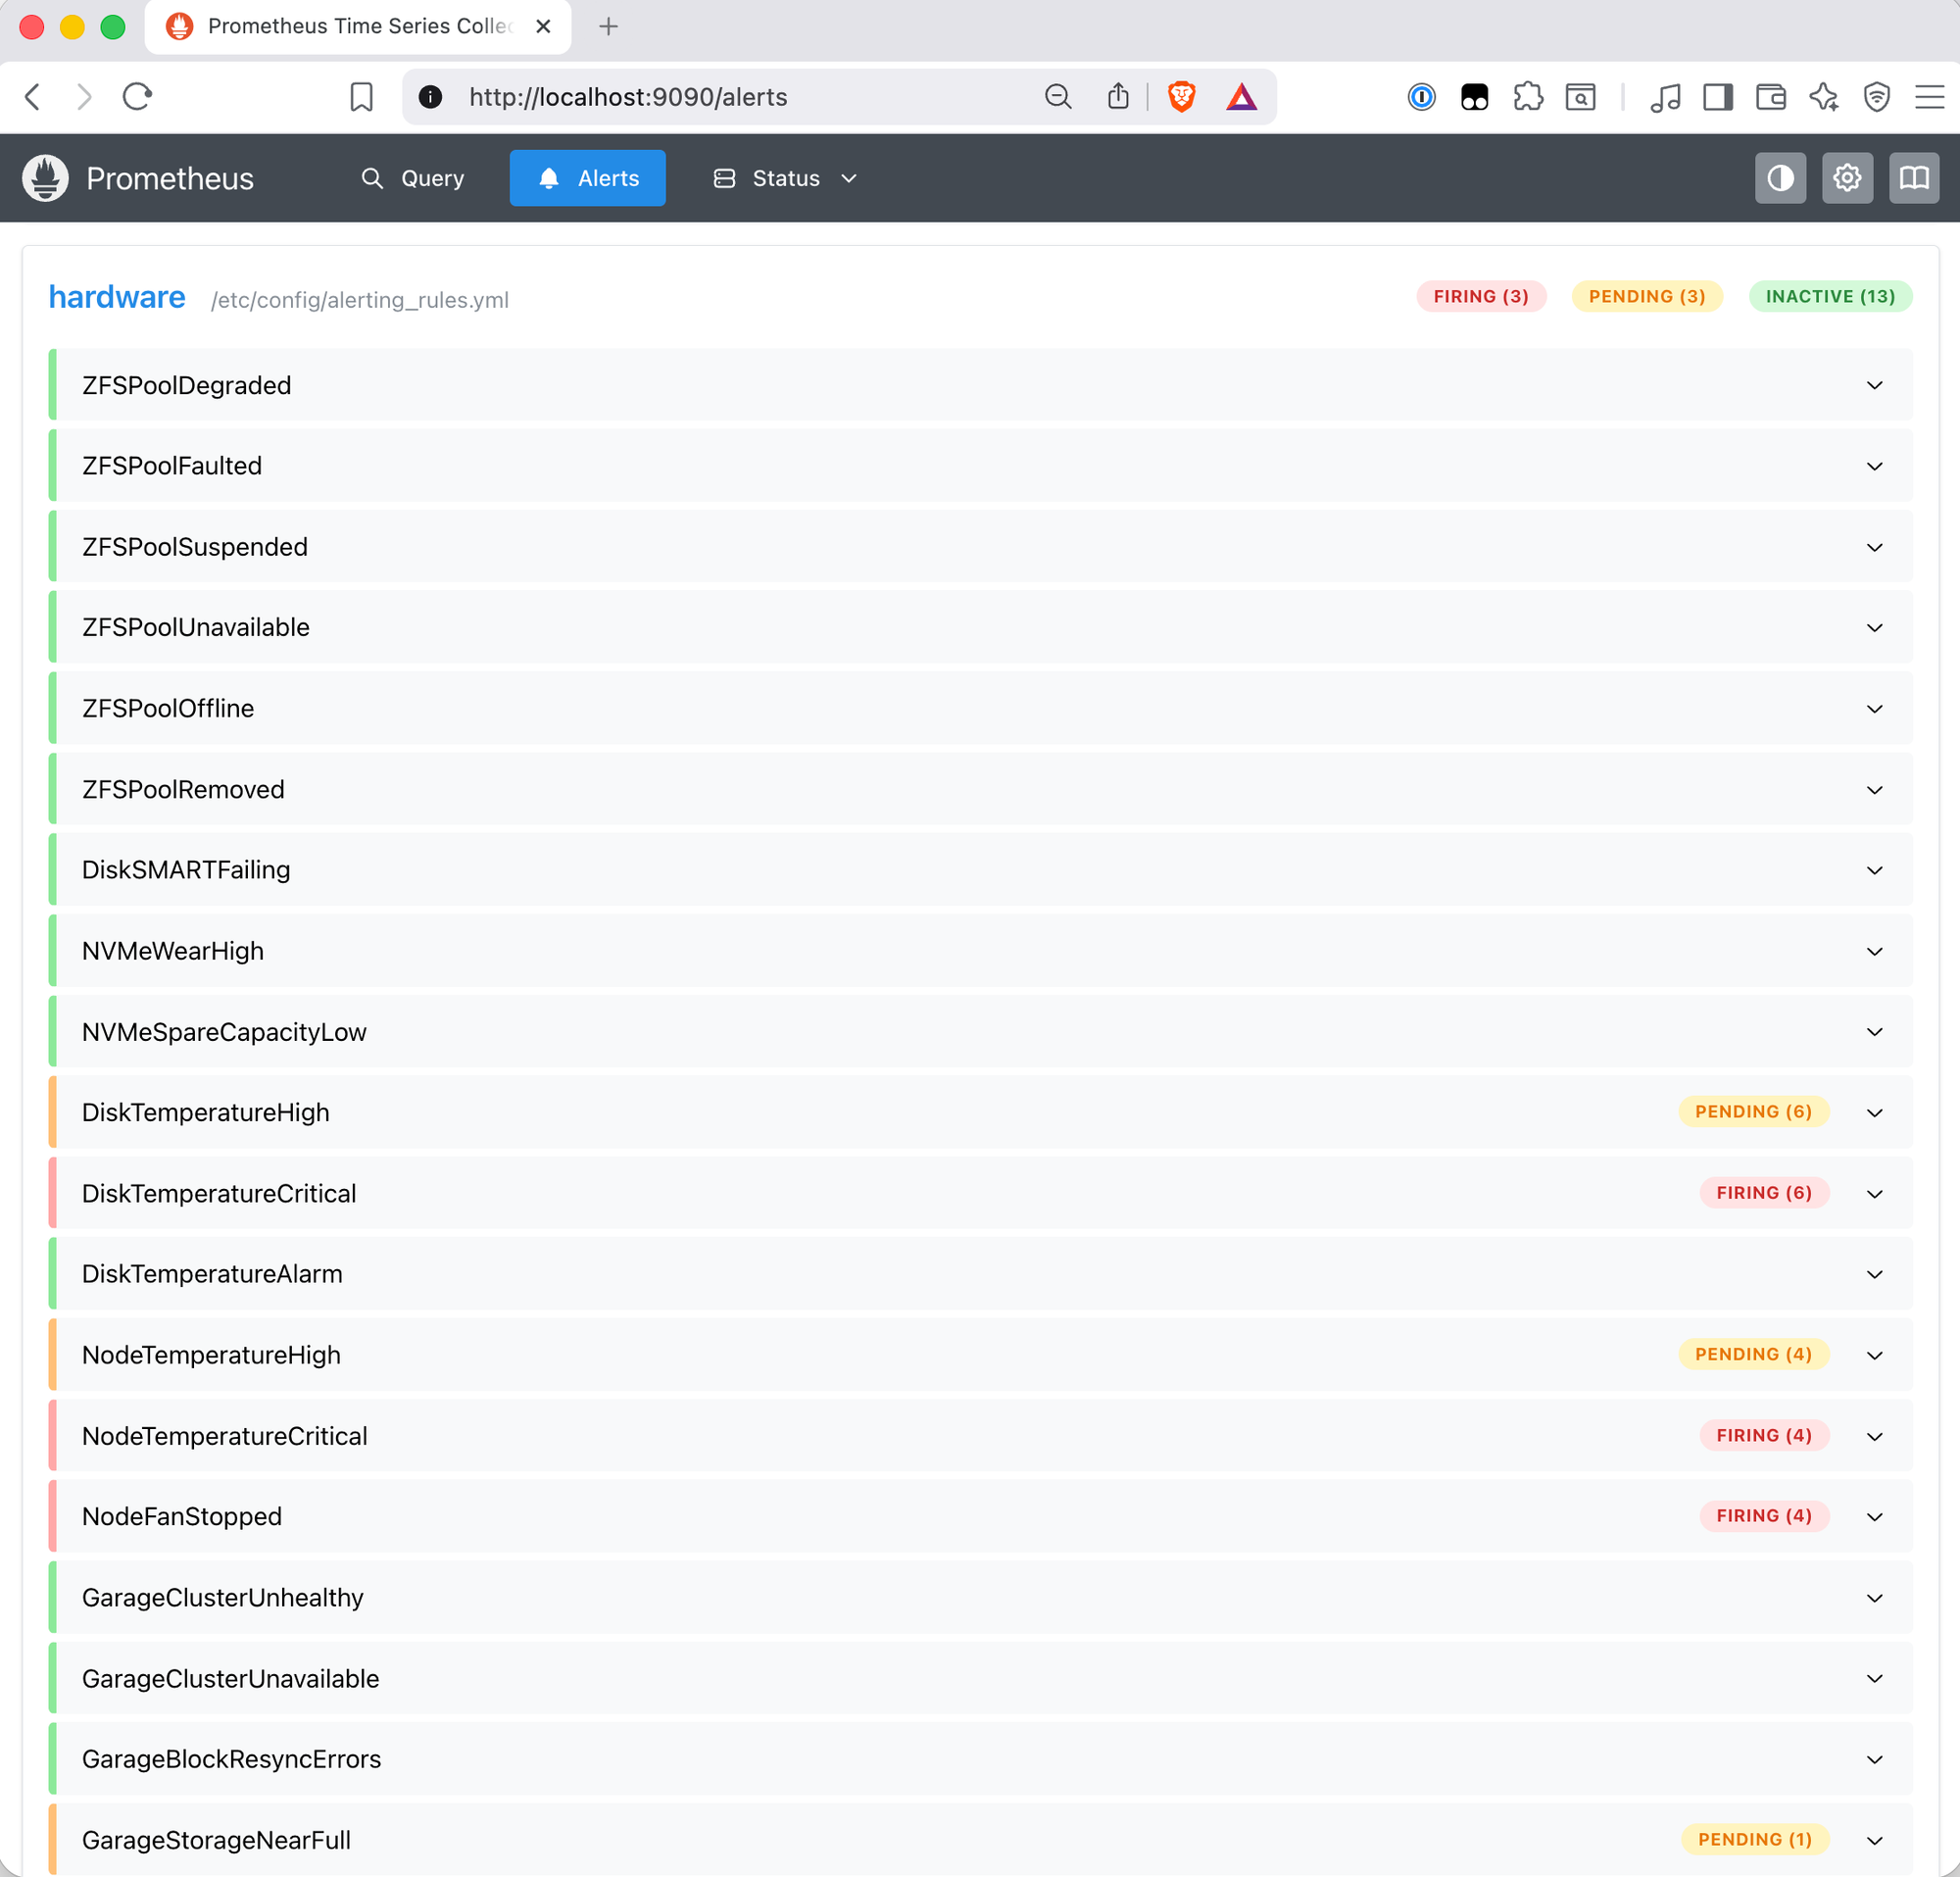
Ten minutes in, the longer-duration rules fire too:
The emails arrive in two distinct batches, which is a concrete demonstration of how for durations work in practice:
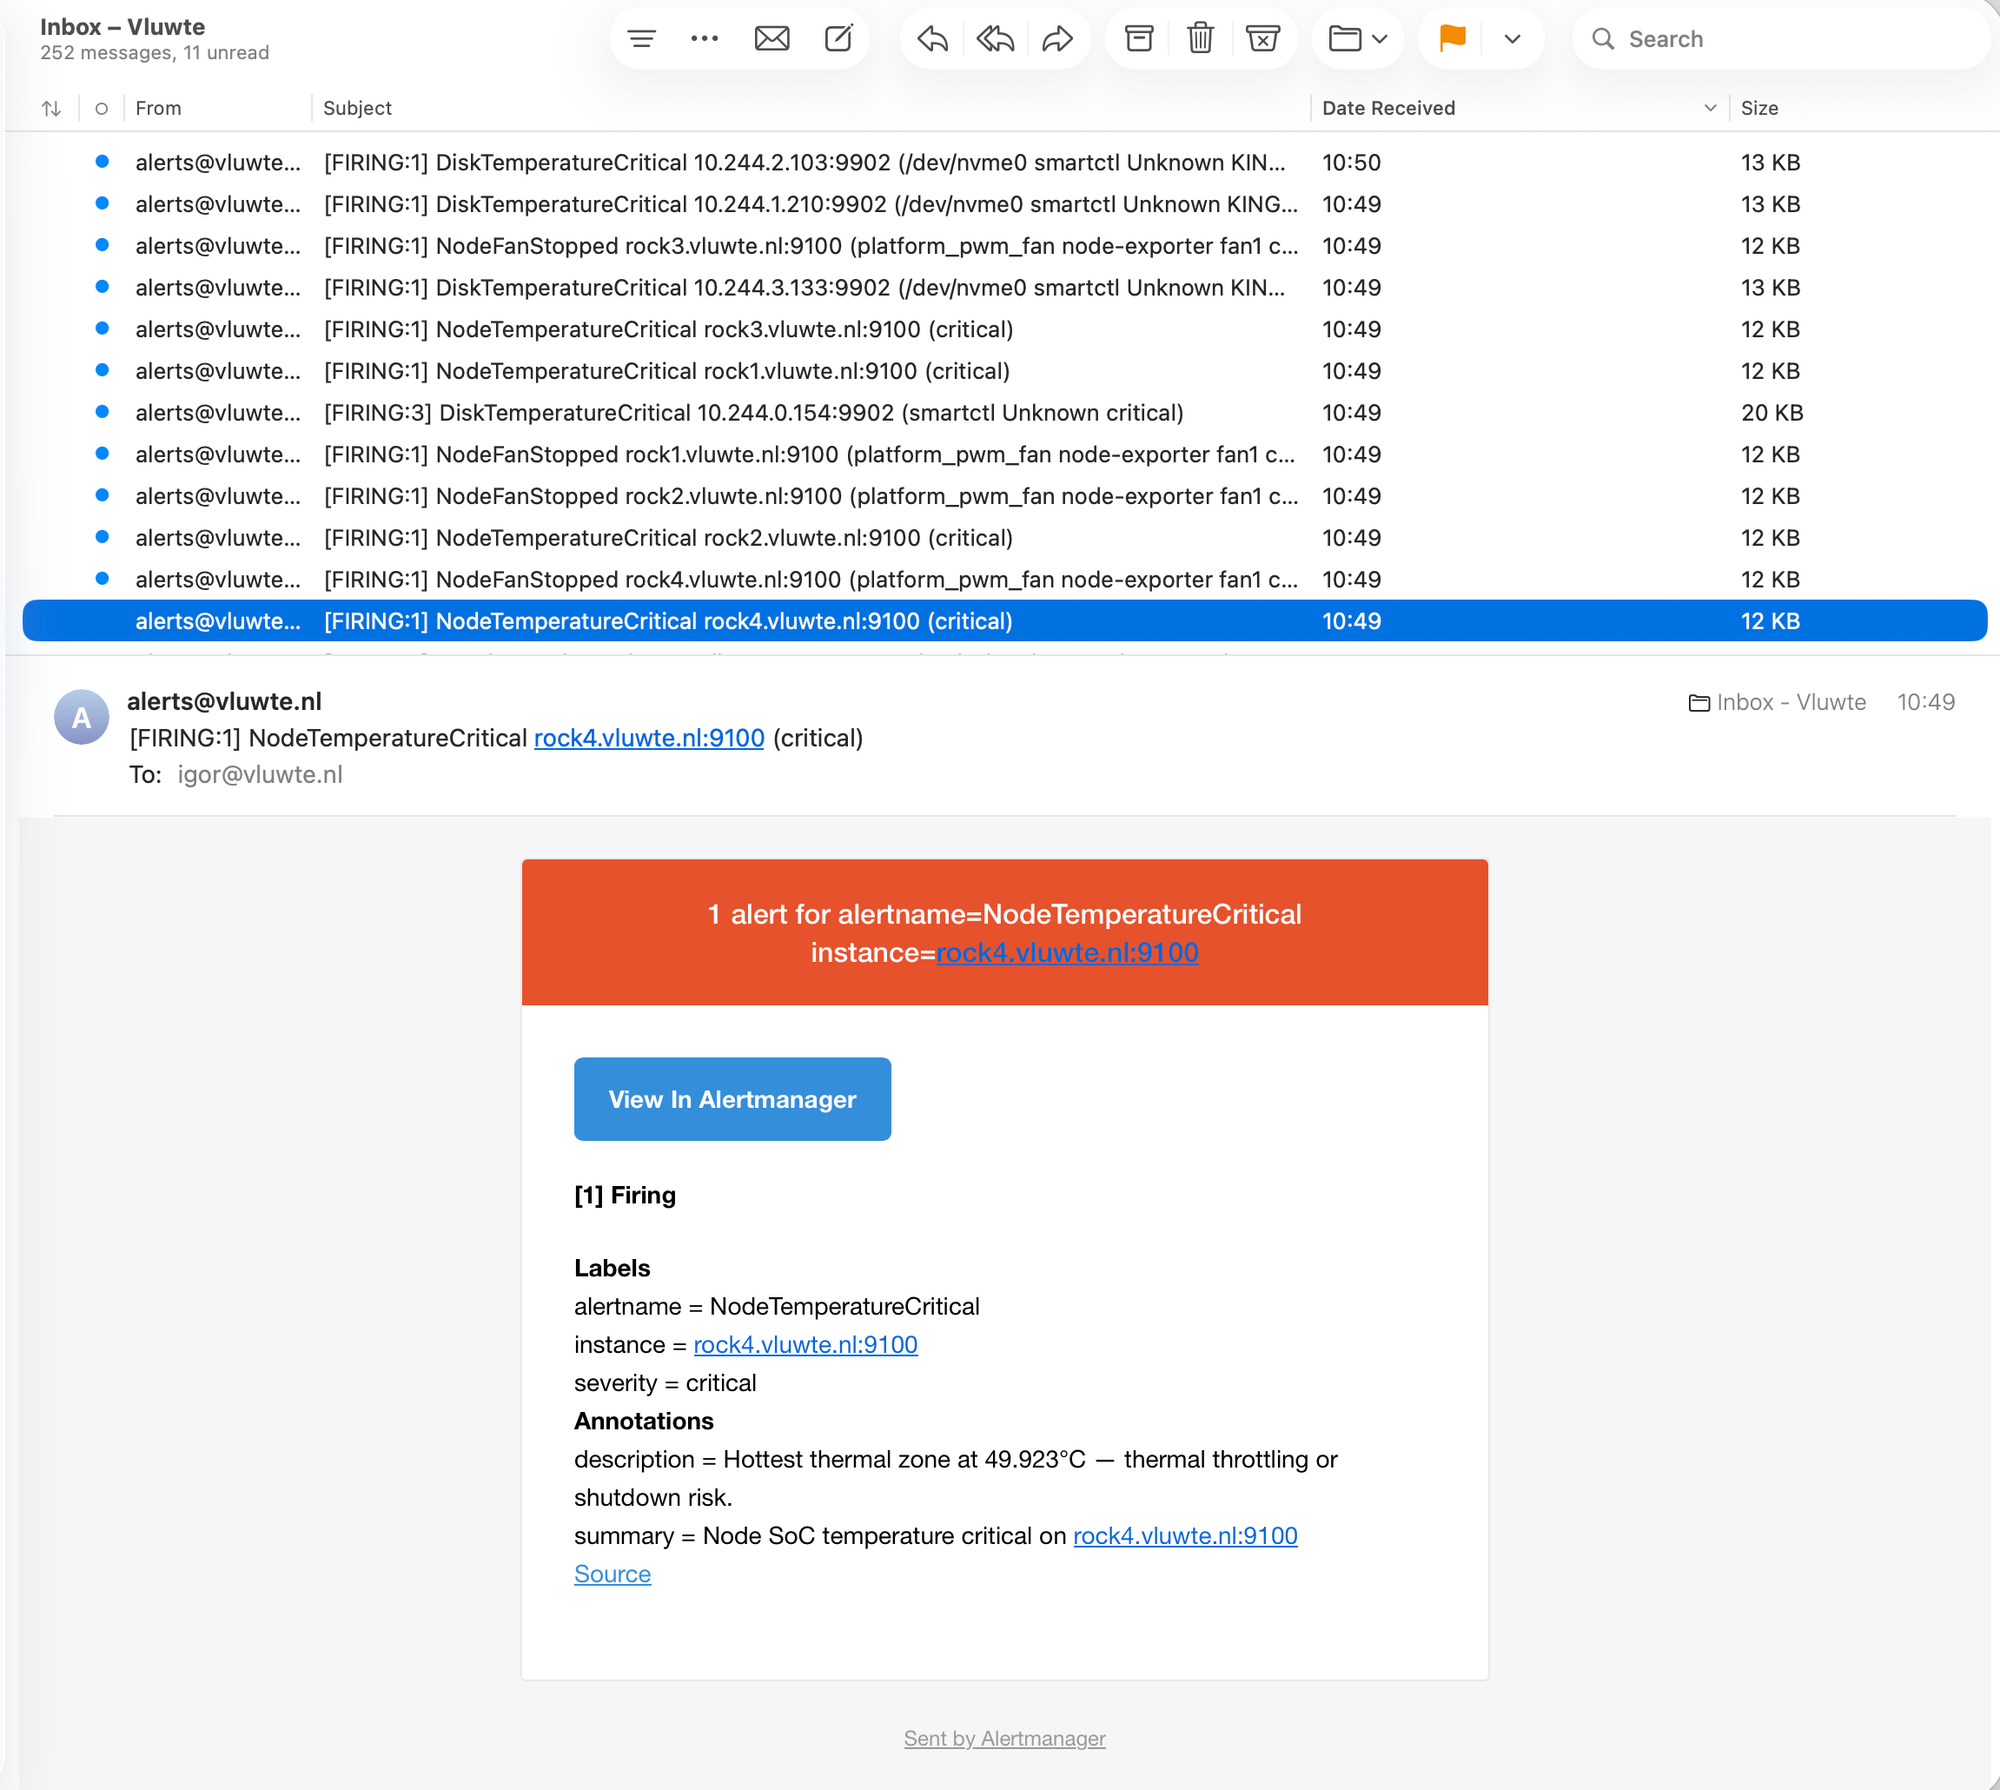
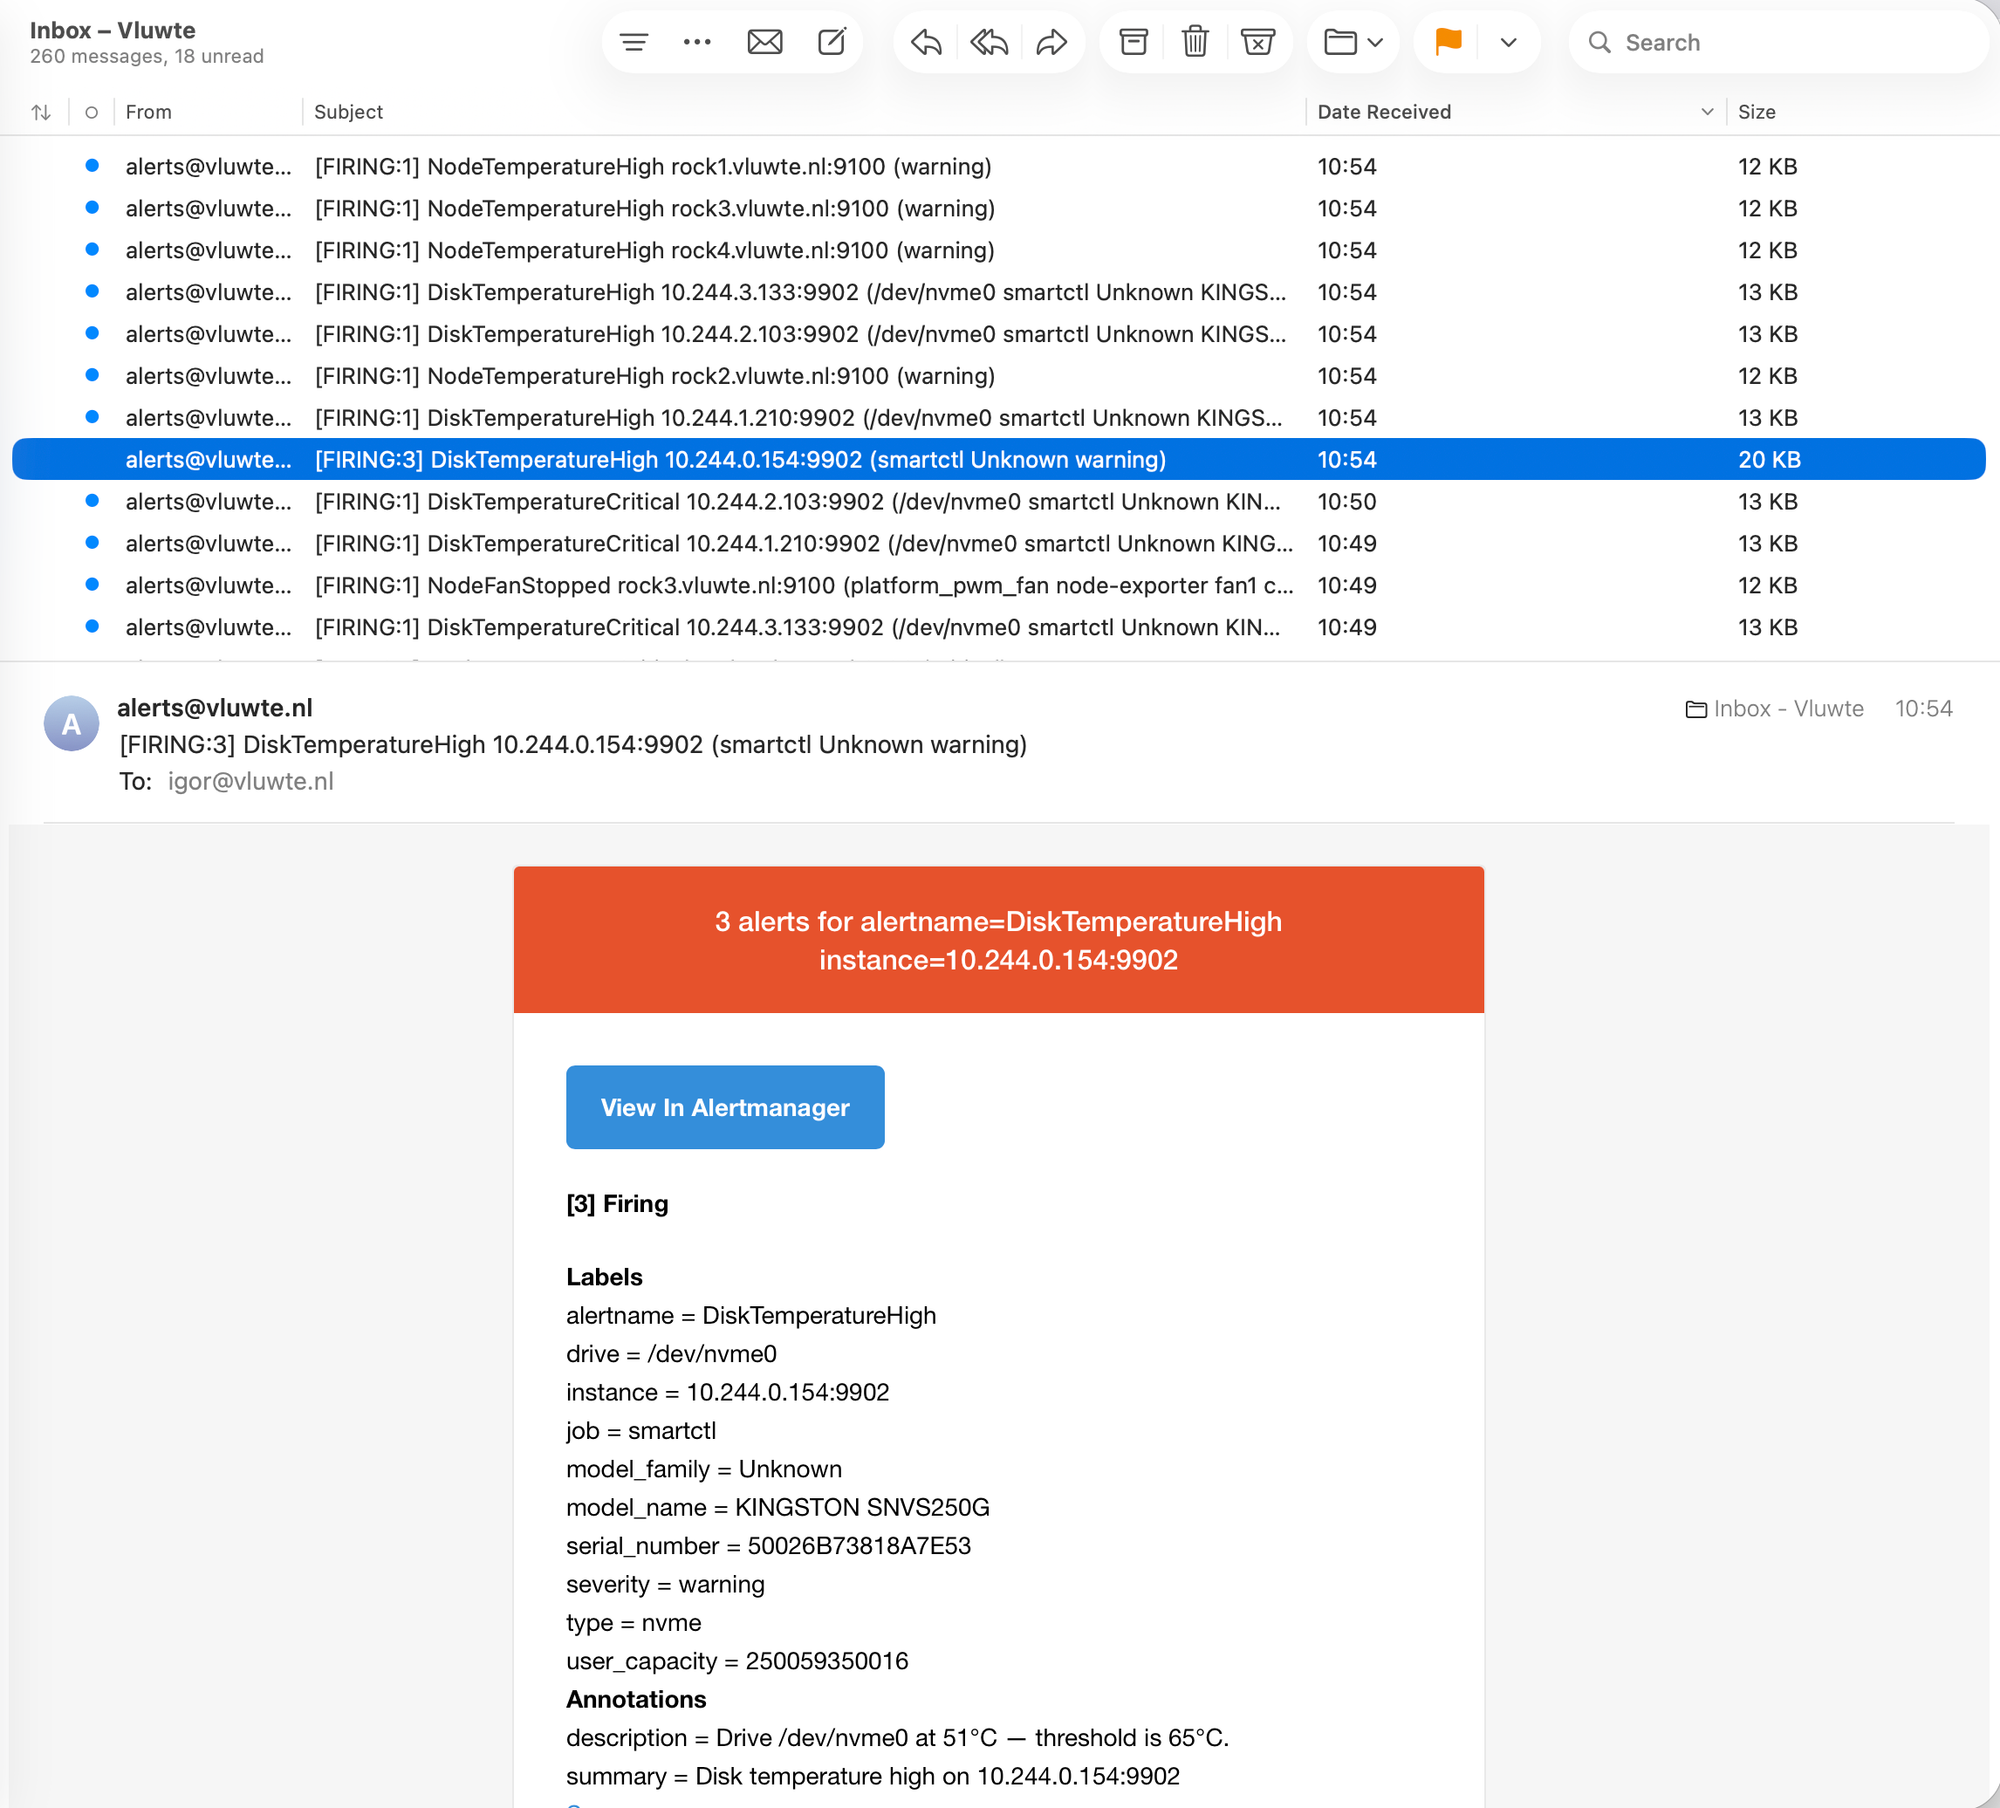
The five-minute gap between batches is exactly what the for durations predict. A condition that lasts five minutes is serious enough to page; a condition that lasts ten minutes is serious enough to page again even if the first page was missed.
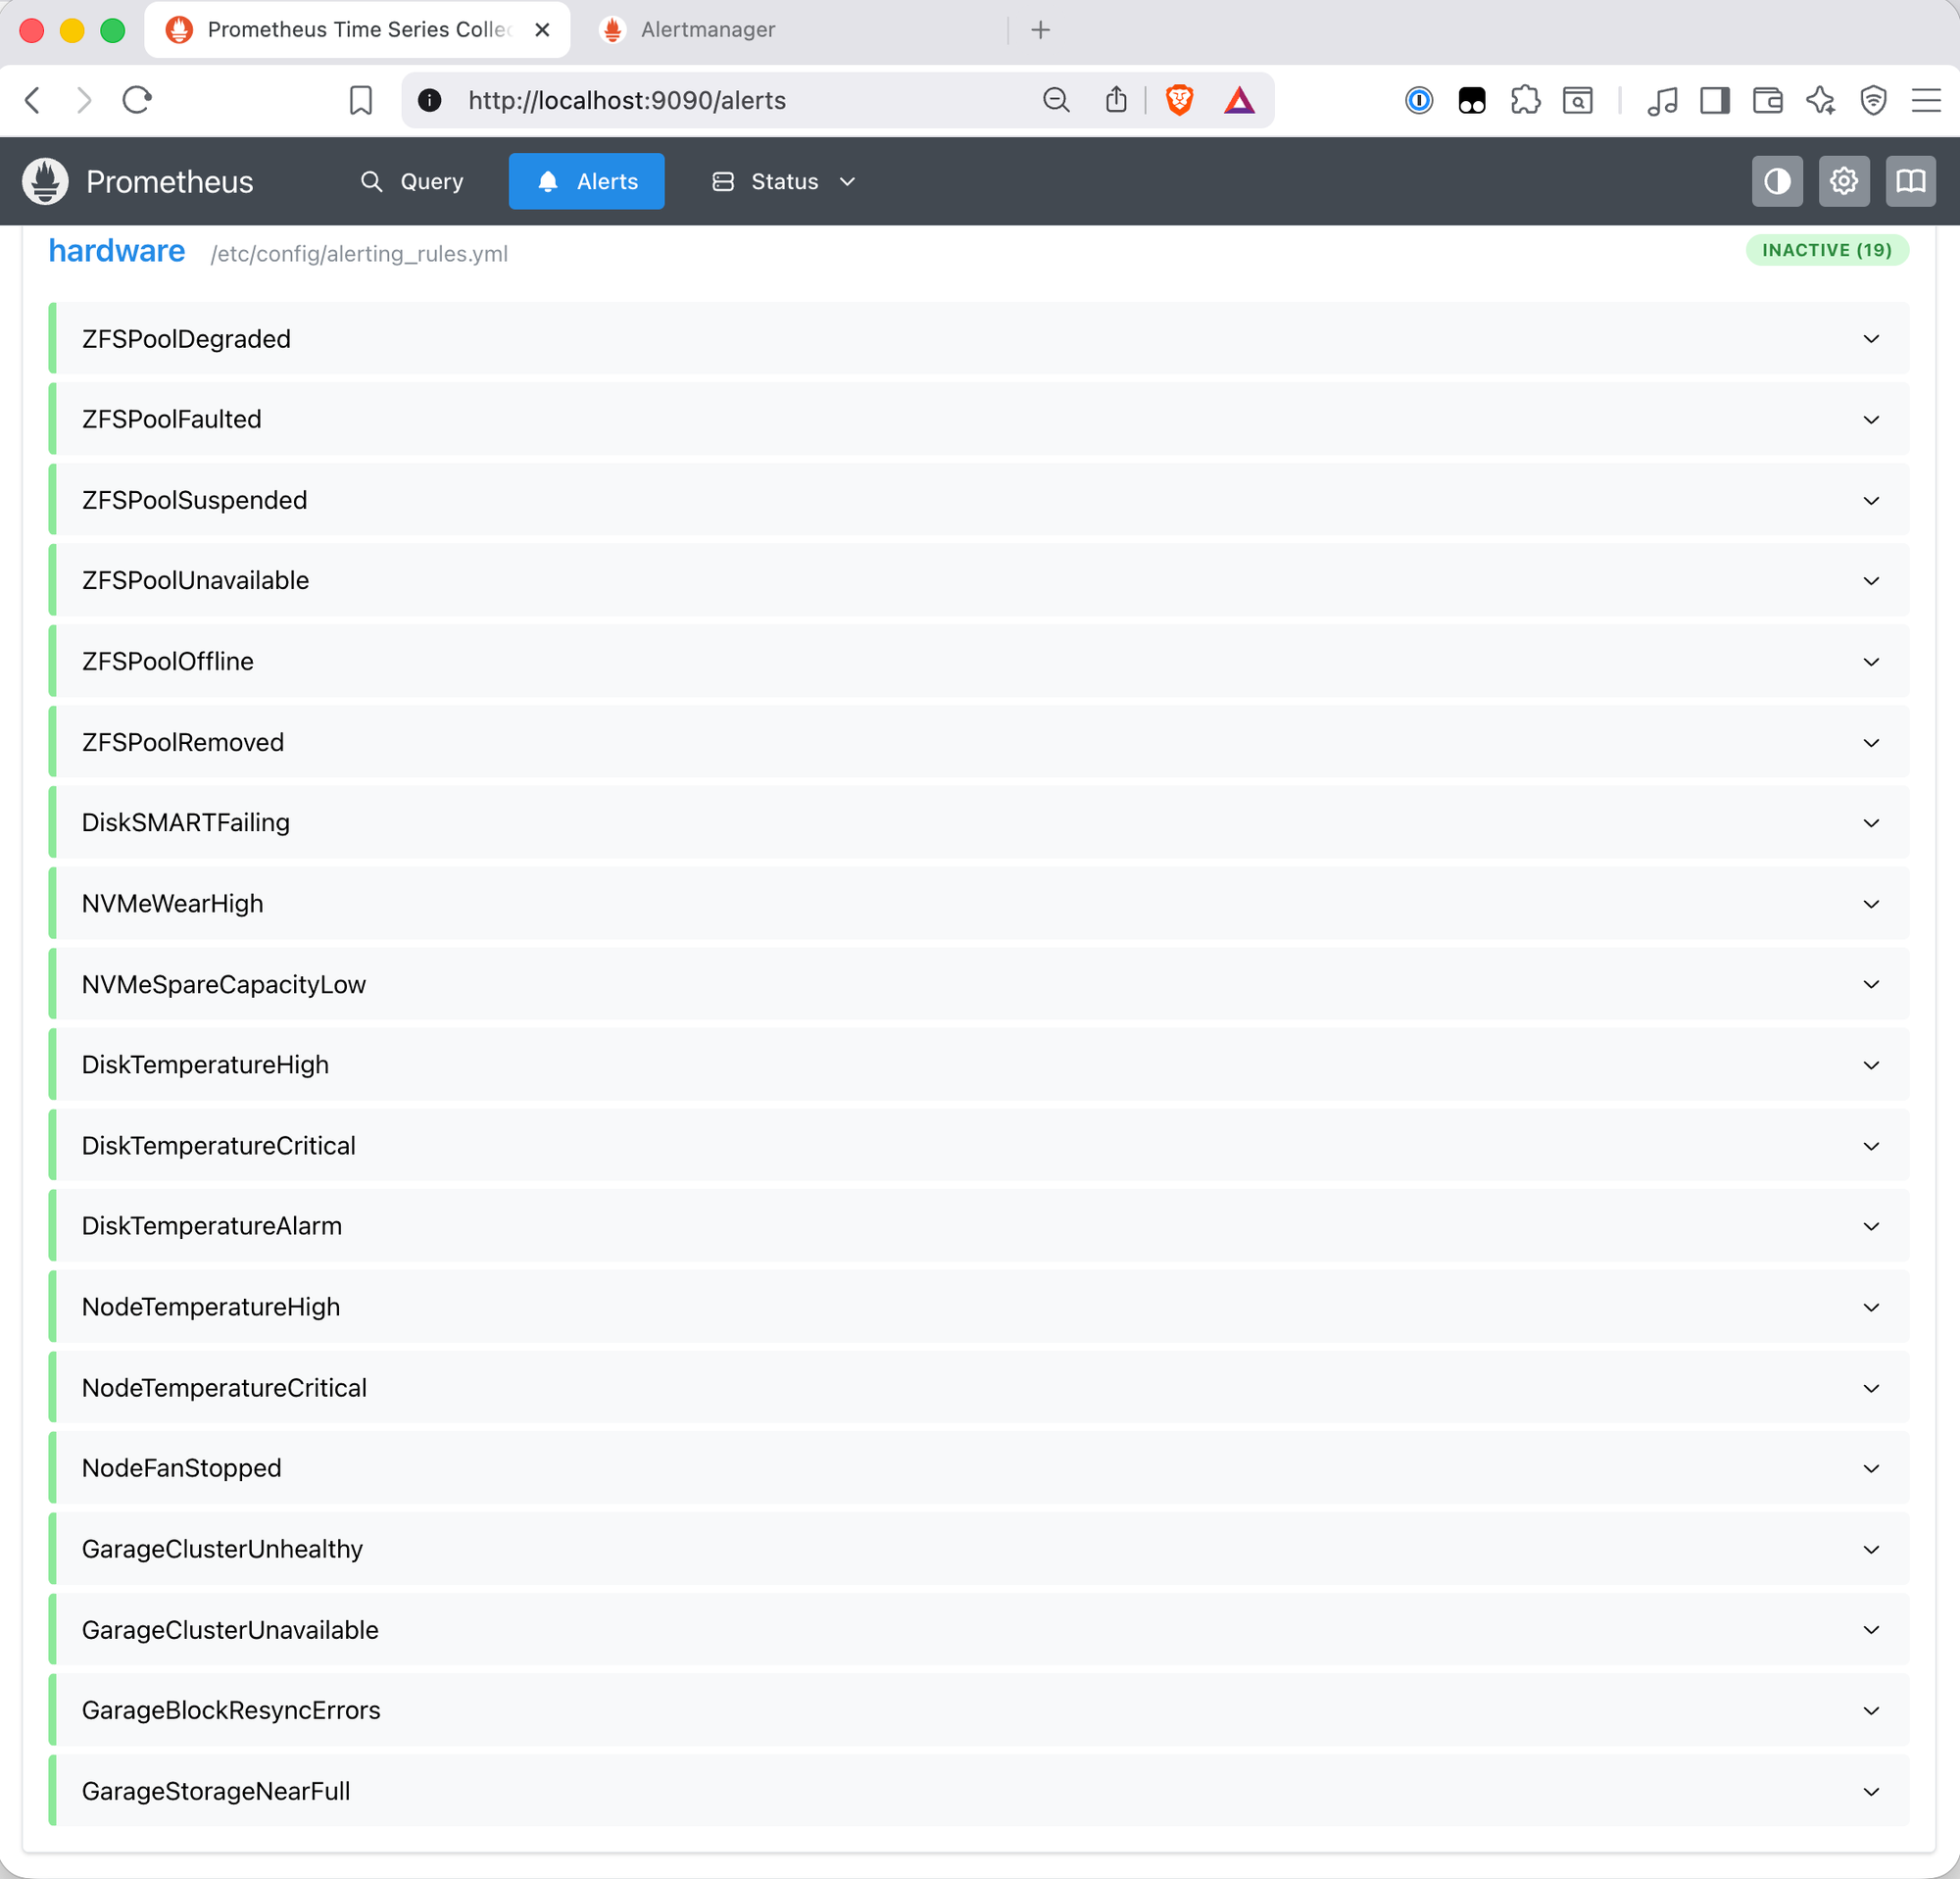
After restoring the production thresholds with another helm upgrade, the rules briefly show UNKNOWN — Prometheus is honest about the fact that it hasn't evaluated the rules since the config was reloaded. A single evaluation cycle resolves this to INACTIVE.
Known Limitation: Pod IPs in SMART Alerts
Alert emails for SMART metrics show pod IP addresses — 10.244.0.154:9902 — rather than node hostnames. This is visible in the DiskTemperatureHigh email in the second batch. Node Exporter alerts correctly show rock4.vluwte.nl:9100; SMART alerts show a pod IP.
The reason is how the scrape job discovers targets. Node Exporter is scraped via a Kubernetes service, so Prometheus uses the service DNS name and the instance label reflects the node hostname. The smartctl scrape job uses pod discovery — it finds the DaemonSet pods by their pod IP and uses that IP as the instance label. The DaemonSet runs one pod per node, but Prometheus has no automatic way to know which pod is on which node without being told explicitly.
Fixing it requires adding a relabelling rule to copy __meta_kubernetes_pod_node_name into a node label during scrape:
- source_labels: [__meta_kubernetes_pod_node_name]
  target_label: node
This is deferred to a future post that will address scrape job deduplication across the cluster. The drive label in the alert annotation identifies the disk clearly enough for a homelab — but this will be cleaned up.
What's Working Now
- ✅ SMART dashboard — 6 panels, NVMe/SATA separated, filtered to real drives
- ✅ ZFS dashboard — ARC panels working at 100% hit rate; Pools section collapsed (pool I/O kstat paths unavailable on this OpenZFS version)
- ✅ 19 hardware alert rules loaded and inactive at production thresholds
- ✅ Alert pipeline confirmed end-to-end — two email batches received, labels resolved correctly
- ✅
promtoolvalidation confirmed: 37 rules total, zero syntax errors - ⚠️ SMART alert emails show pod IPs — deferred to scrape job deduplication post
What's Next
The hardware is now observable and alertable. The remaining gap in the observability stack is logs — Prometheus and Alertmanager handle metric-based alerting well, but there is no log aggregation in place. Pod logs are ephemeral, vanish when pods restart, and require active querying with kubectl logs or stern. Parts 7 and 8 add Loki and Promtail to fix that, and complete the observability stack.
← Previous: Hardware Health Collectors
Questions or suggestions? Leave a comment below or reach out at igor@vluwte.nl.