Cluster Observability Part 1: Prometheus and Node Exporter on Talos
Installing Prometheus and node exporter on Talos Linux: namespace labelling, values files, the duplicate pod gotcha, and confirming all four nodes are being scraped.
Introduction
The Bletchley cluster is up and running. Longhorn is installed, storage is working, pods are scheduling. But a cluster with no workloads is just infrastructure sitting idle — and a cluster with no observability is infrastructure you can't reason about. The first real workload on Bletchley solves both problems at once: Prometheus and node exporter give the cluster something meaningful to run, and in return give me visibility into what those nodes are actually doing — CPU, memory, disk, network.
The plan for observability is three posts. This one covers the data collection layer: Prometheus to store and query metrics, and node exporter to collect hardware and OS metrics from each node. The next post adds Grafana to visualise that data. The post after that adds MetalLB and ingress-nginx so everything gets a proper URL instead of port-forwarding.
I'm deploying these components individually rather than using kube-prometheus-stack, which bundles Prometheus, Grafana, and AlertManager into a single Helm chart. The bundle is convenient, but it's harder to reason about what each component is doing when everything arrives pre-configured together. Installing them one at a time means understanding each piece before adding the next.
By the end of this post, node metrics from all four RK1 nodes are flowing into Prometheus, queryable from a local port-forward. Not glamorous, but it's the foundation everything else sits on.
🏠 This is part of the Homelab Journey series - building a production Kubernetes cluster from scratch.
- Longhorn Deep Dive — replicas, versions, upgrades
- Cluster Observability Part 1: Prometheus and Node Exporter on Talos (you are here)
- Cluster Observability Part 2 — Grafana Dashboards
This post assumes you have the Bletchley cluster running with Longhorn installed. If you're starting from scratch, check out Setting Up Longhorn first.
Why These Two Components Together
Node exporter is a DaemonSet that runs on every node and exposes hardware and OS metrics on port 9100 — CPU time, memory usage, disk I/O, filesystem space, network traffic. It doesn't store anything; it just exposes a /metrics endpoint on each node.
Prometheus is the time-series database that scrapes those endpoints on a schedule and stores the results. You point it at targets (in this case, the four node exporter endpoints), it polls them every 15 seconds by default, and it builds up a queryable history of everything those endpoints report.
The two are tightly coupled — node exporter without Prometheus is just an HTTP endpoint that nobody's reading. Prometheus without node exporter has nothing node-level to scrape. There's no meaningful "does it work" moment with either one alone, which is why they go in the same post.
Preparing the Namespace
Same pattern as Longhorn. The monitoring namespace needs to exist and be labelled privileged before installing anything. Node exporter needs hostNetwork: true and hostPID: true to see real host metrics rather than a container-scoped view, and those settings violate Talos's default restricted pod security policy. The label allows them through.
kubectl create namespace monitoring

kubectl label namespace monitoring \
  pod-security.kubernetes.io/enforce=privileged
Without the label, the namespace and label can be created in either order — but the label must exist before the pods try to start, or they fail to schedule.
Adding the Helm Repository
Both components come from the prometheus-community Helm repository.
helm repo add prometheus-community https://prometheus-community.github.io/helm-charts
helm repo update
I keep all values files for the cluster in ~/talos-cluster/bletchley/prometheus/ — a subdirectory alongside the Talos config files and Longhorn values.
mkdir ~/talos-cluster/bletchley/prometheus
cd ~/talos-cluster/bletchley/prometheus
Installing Node Exporter
Node exporter goes in first, so it's already running on all four nodes by the time Prometheus starts scraping.
The values file
# node-exporter-values.yaml
hostNetwork: true
hostPID: true

tolerations:
  - effect: NoSchedule
    operator: Exists
Three settings, each with a specific purpose.
hostNetwork: true puts the node exporter pod on the host's network namespace rather than the pod network. This is what allows Prometheus to reach it at the node's IP on port 9100, and it's what gives node exporter visibility into the host's actual network interfaces rather than the container network.
hostPID: true gives node exporter access to the host's process namespace. Without it, certain metrics — particularly those derived from /proc — see only the container's view rather than the full node.
The toleration lets node exporter land on all four nodes including the control plane nodes, which carry a NoSchedule taint by default. Without it, the DaemonSet would only schedule on worker nodes. Since allowSchedulingOnControlPlanes: true is set in the Talos cluster config, all four nodes accept workloads — but the toleration is still required for the taint to be respected.
A note on what's not in this file: the chart's default values already configure the root filesystem mount and --path.rootfs argument correctly. There's no need to add these in a custom values file — doing so causes a conflict (more on this in the Lessons Learned section).
The node-exporter install
helm install node-exporter prometheus-community/prometheus-node-exporter \
  --namespace monitoring \
  --version 4.52.0 \
  --values ~/talos-cluster/bletchley/prometheus/node-exporter-values.yaml
The install produces a PodSecurity warning — same as Longhorn. It's the audit trail of the privileged enforcement decision, not an error.
Verify it landed on all four nodes:
kubectl -n monitoring get daemonset
NAME                                     DESIRED   CURRENT   READY   UP-TO-DATE   AVAILABLE   NODE SELECTOR
node-exporter-prometheus-node-exporter   4         4         4       4            4           kubernetes.io/os=linux
DESIRED and READY both showing 4 means the DaemonSet scheduled a pod on every node and all four are healthy.
Installing Prometheus
The values file
# prometheus-values.yaml
server:
  persistentVolume:
    enabled: true
    storageClass: longhorn
    size: 10Gi
  retention: "15d"

serverFiles:
  prometheus.yml:
    scrape_configs:
      - job_name: node-exporter
        static_configs:
          - targets:
            - rock1.vluwte.nl:9100
            - rock2.vluwte.nl:9100
            - rock3.vluwte.nl:9100
            - rock4.vluwte.nl:9100

alertmanager:
  enabled: false

prometheus-pushgateway:
  enabled: false

prometheus-node-exporter:
  enabled: false
A few decisions worth unpacking.
Persistent storage via Longhorn. The storageClass: longhorn setting means Prometheus's time-series database (TSDB) gets a replicated persistent volume rather than ephemeral container storage. If the pod restarts or moves to another node, the historical data survives. This is the first real workload exercising the Longhorn storage layer — if the PVC binds and Prometheus comes up healthy, Longhorn is confirmed working end to end.
15-day retention. Enough history to be useful for spotting patterns and understanding cluster behaviour. The TSDB will use somewhere between 2-5GB depending on the number of active metrics and scrape interval — well within the 10Gi volume. If 15 days proves insufficient, the volume size and retention can be changed and the Helm release upgraded; the TSDB will simply start discarding older data.
AlertManager and Pushgateway disabled. AlertManager handles alerting rules and notification routing — genuinely useful, but a separate topic with its own configuration. Enabling it here with default settings adds complexity without benefit. Same reasoning for Pushgateway, which is for pushing metrics from batch jobs and isn't needed yet.
prometheus-node-exporter: enabled: false. This is important. The standalone prometheus chart bundles node exporter as a sub-chart and enables it by default. Since node exporter is already running as a separate Helm release, this sub-chart must be explicitly disabled. Leaving it enabled would deploy a second set of node exporter pods that immediately conflict with the first set — they'd try to bind to port 9100 on each node and find it already taken. The correct configuration is always to disable it when running node exporter separately, and to include this line in the values file from the start so the intent is documented and reproducible.
Static scrape targets using hostnames. The scrape_configs section tells Prometheus where to look for data. This setup uses static targets — four explicit DNS names, one per node:
scrape_configs:
  - job_name: node-exporter
    static_configs:
      - targets:
        - rock1.vluwte.nl:9100
        - rock2.vluwte.nl:9100
        - rock3.vluwte.nl:9100
        - rock4.vluwte.nl:9100
In a large or dynamic environment you'd use kubernetes_sd_configs instead — Prometheus talks to the Kubernetes API, discovers every pod labelled app: node-exporter, and starts scraping them automatically. Add a fifth node and Prometheus finds it without touching a config file.
For Bletchley I chose static targets for two reasons. First, simplicity and reliability: this is a fixed four-node physical cluster. The hostnames aren't changing, and I want the source of truth to be explicit. If a node goes down, I want to see a specific red error for rock2 in the UI — not have the target silently disappear from a dynamic list. Second, DNS verification: if Prometheus can't resolve rock1.vluwte.nl, that's a CoreDNS or upstream DNS issue surfacing before I even look at metrics. It doubles as a network health check.
The prometheus install
helm install prometheus prometheus-community/prometheus \
  --namespace monitoring \
  --version 28.12.0 \
  --values ~/talos-cluster/bletchley/prometheus/prometheus-values.yaml
Watch the pods come up:
kubectl -n monitoring get pods -w
The prometheus-server-* pod starts as 0/2 — two containers: the Prometheus process itself and a config-reloader sidecar that watches for changes to the ConfigMap and sends a reload signal when it detects them. It transitions to 2/2 Running within about a minute.
Verify the PVC was provisioned by Longhorn:
kubectl -n monitoring get pvc
NAME                STATUS   VOLUME                                     CAPACITY   ACCESS MODES   STORAGECLASS
prometheus-server   Bound    pvc-6f155b3a-769d-49da-aa21-e61a073aa82a   10Gi       RWO            longhorn
STATUS: Bound confirms Longhorn provisioned the volume. If it stays Pending, check that Longhorn is healthy before debugging further.
The final pod state:
kubectl -n monitoring get pods -o wide
NAME                                             READY   STATUS    RESTARTS   AGE   IP            NODE
node-exporter-prometheus-node-exporter-64jx4     1/1     Running   0          16m   10.0.140.12   rock2
node-exporter-prometheus-node-exporter-g6kpj     1/1     Running   0          16m   10.0.140.13   rock3
node-exporter-prometheus-node-exporter-hwm7w     1/1     Running   0          16m   10.0.140.14   rock4
node-exporter-prometheus-node-exporter-tv26m     1/1     Running   0          16m   10.0.140.11   rock1
prometheus-kube-state-metrics-5d654b7dd5-dsvfr   1/1     Running   0          28m   10.244.1.8    rock1
prometheus-server-7677b67fdc-xxbbn               2/2     Running   0          28m   10.244.3.15   rock4
Six pods. The four node exporter pods show node IPs rather than pod network IPs — that's hostNetwork: true in action. The kube-state-metrics pod is a dependency of the Prometheus chart that collects Kubernetes object state (deployment health, pod status, resource requests vs limits) and is worth keeping. The Prometheus server pod landed on rock4.
Verifying the Data
Port-forward to the Prometheus UI:
kubectl -n monitoring port-forward svc/prometheus-server 9090:80
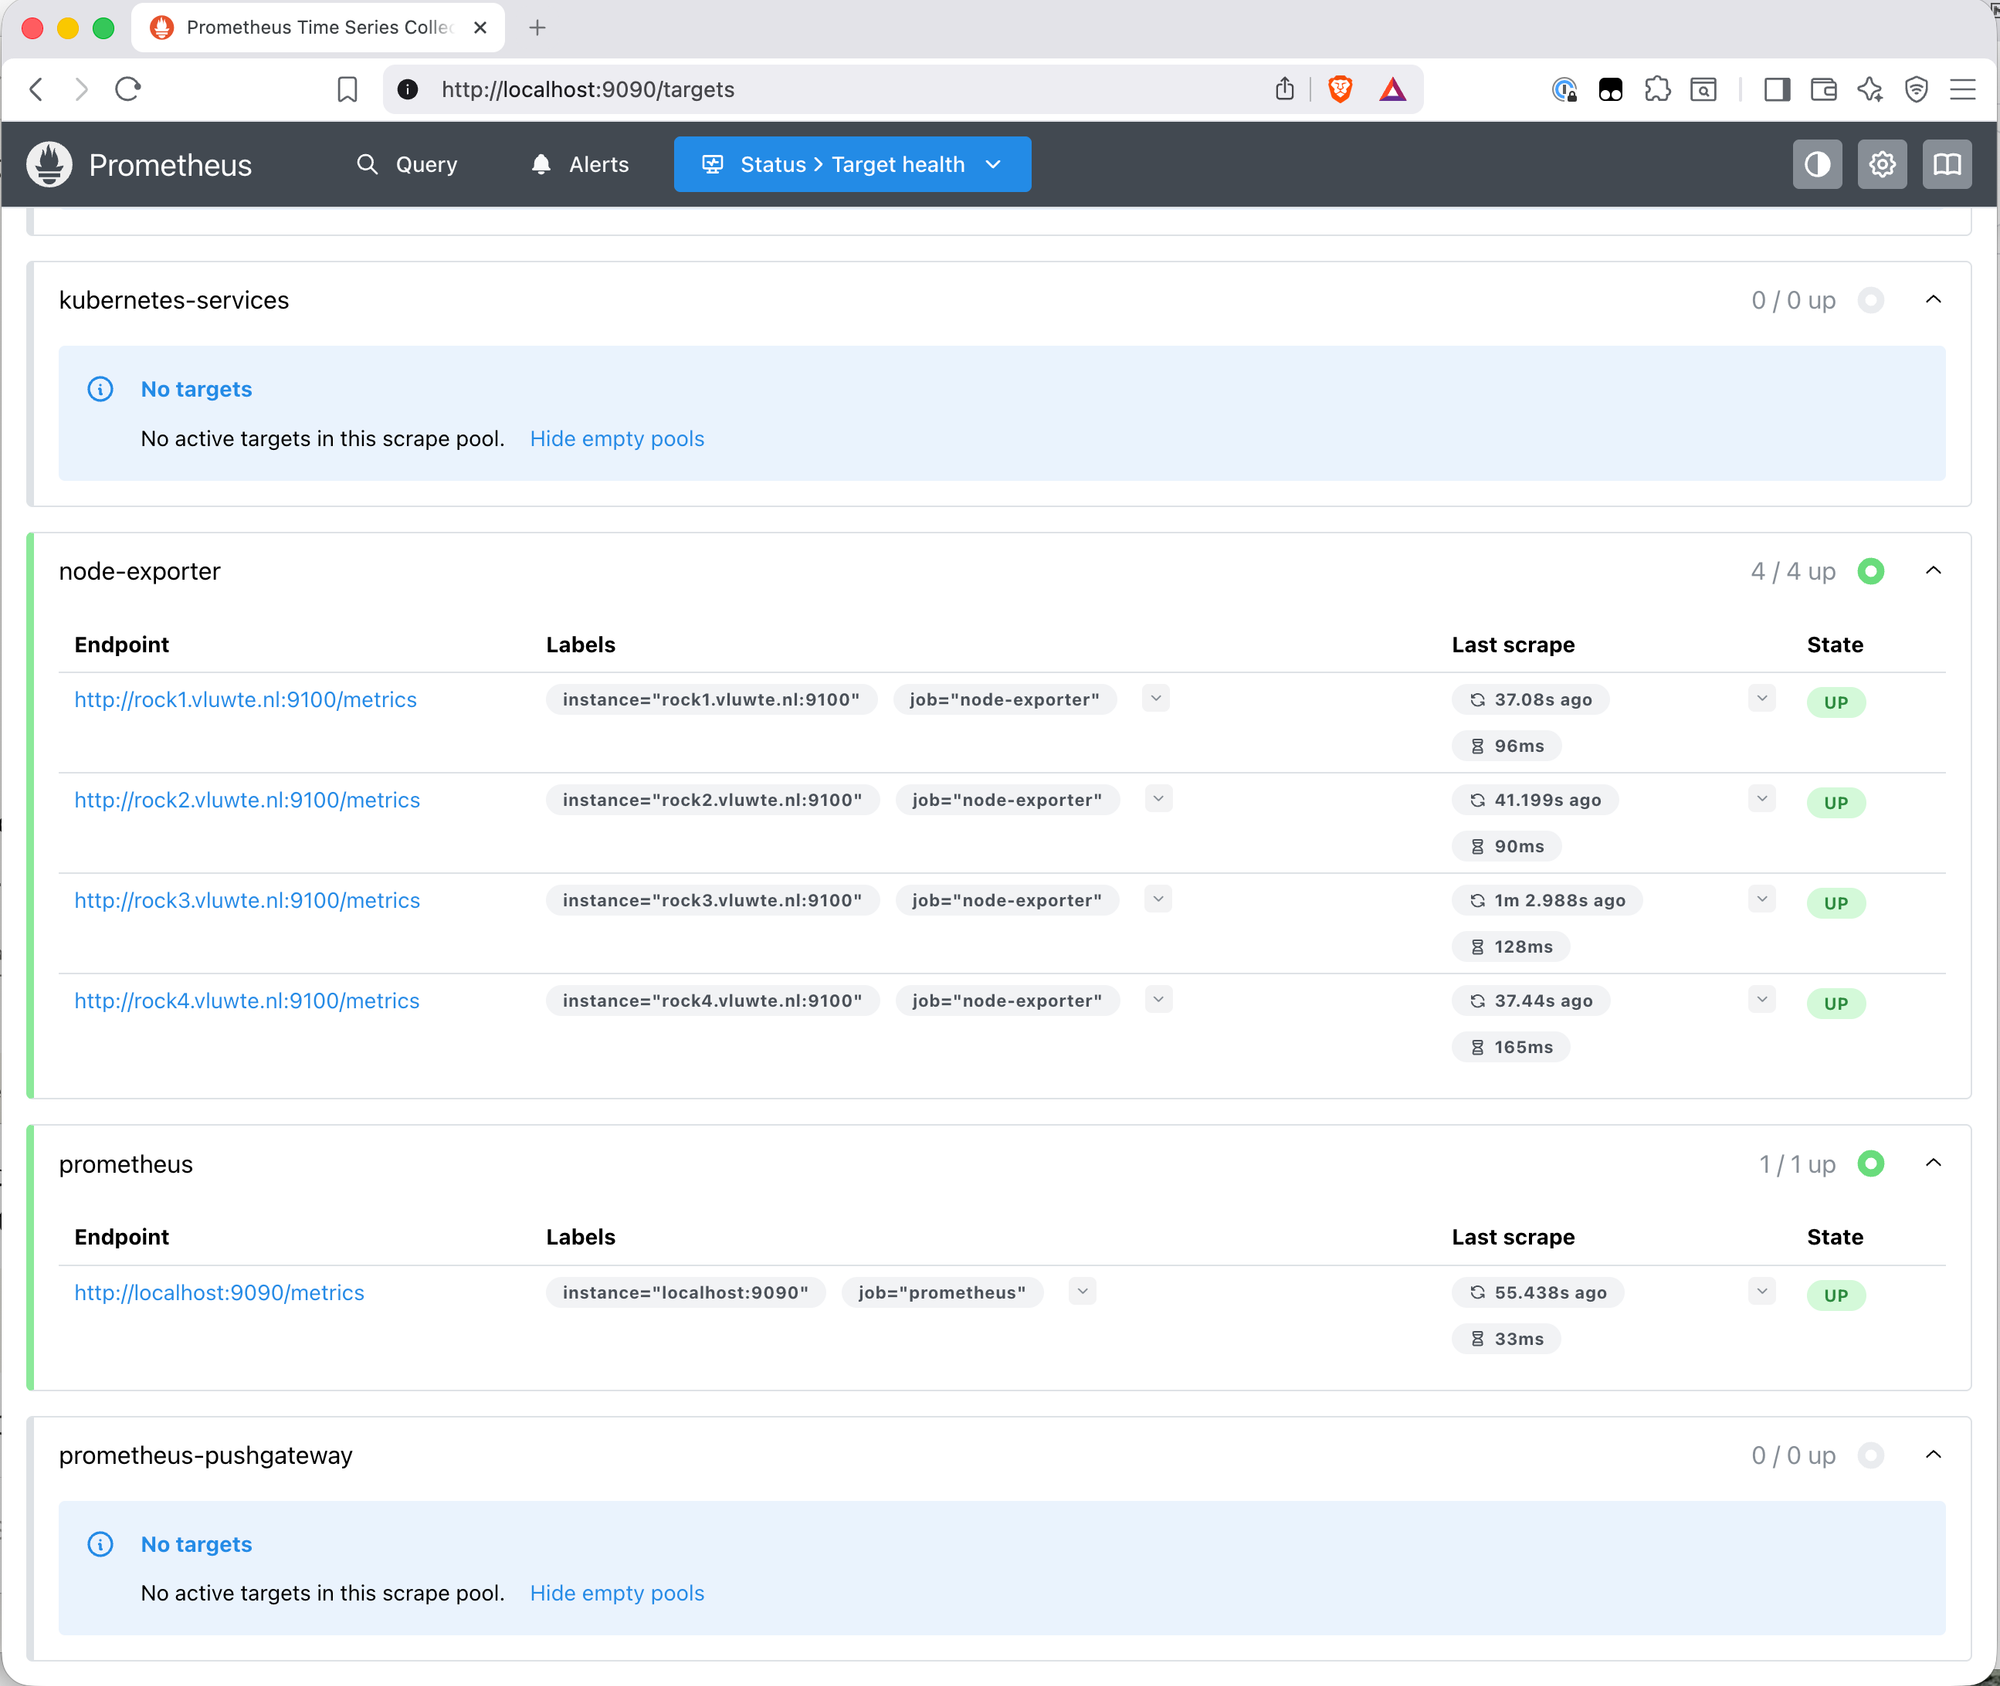
Open http://localhost:9090 and go to Status → Targets. All four node exporter endpoints should show State: UP with recent last-scrape times.
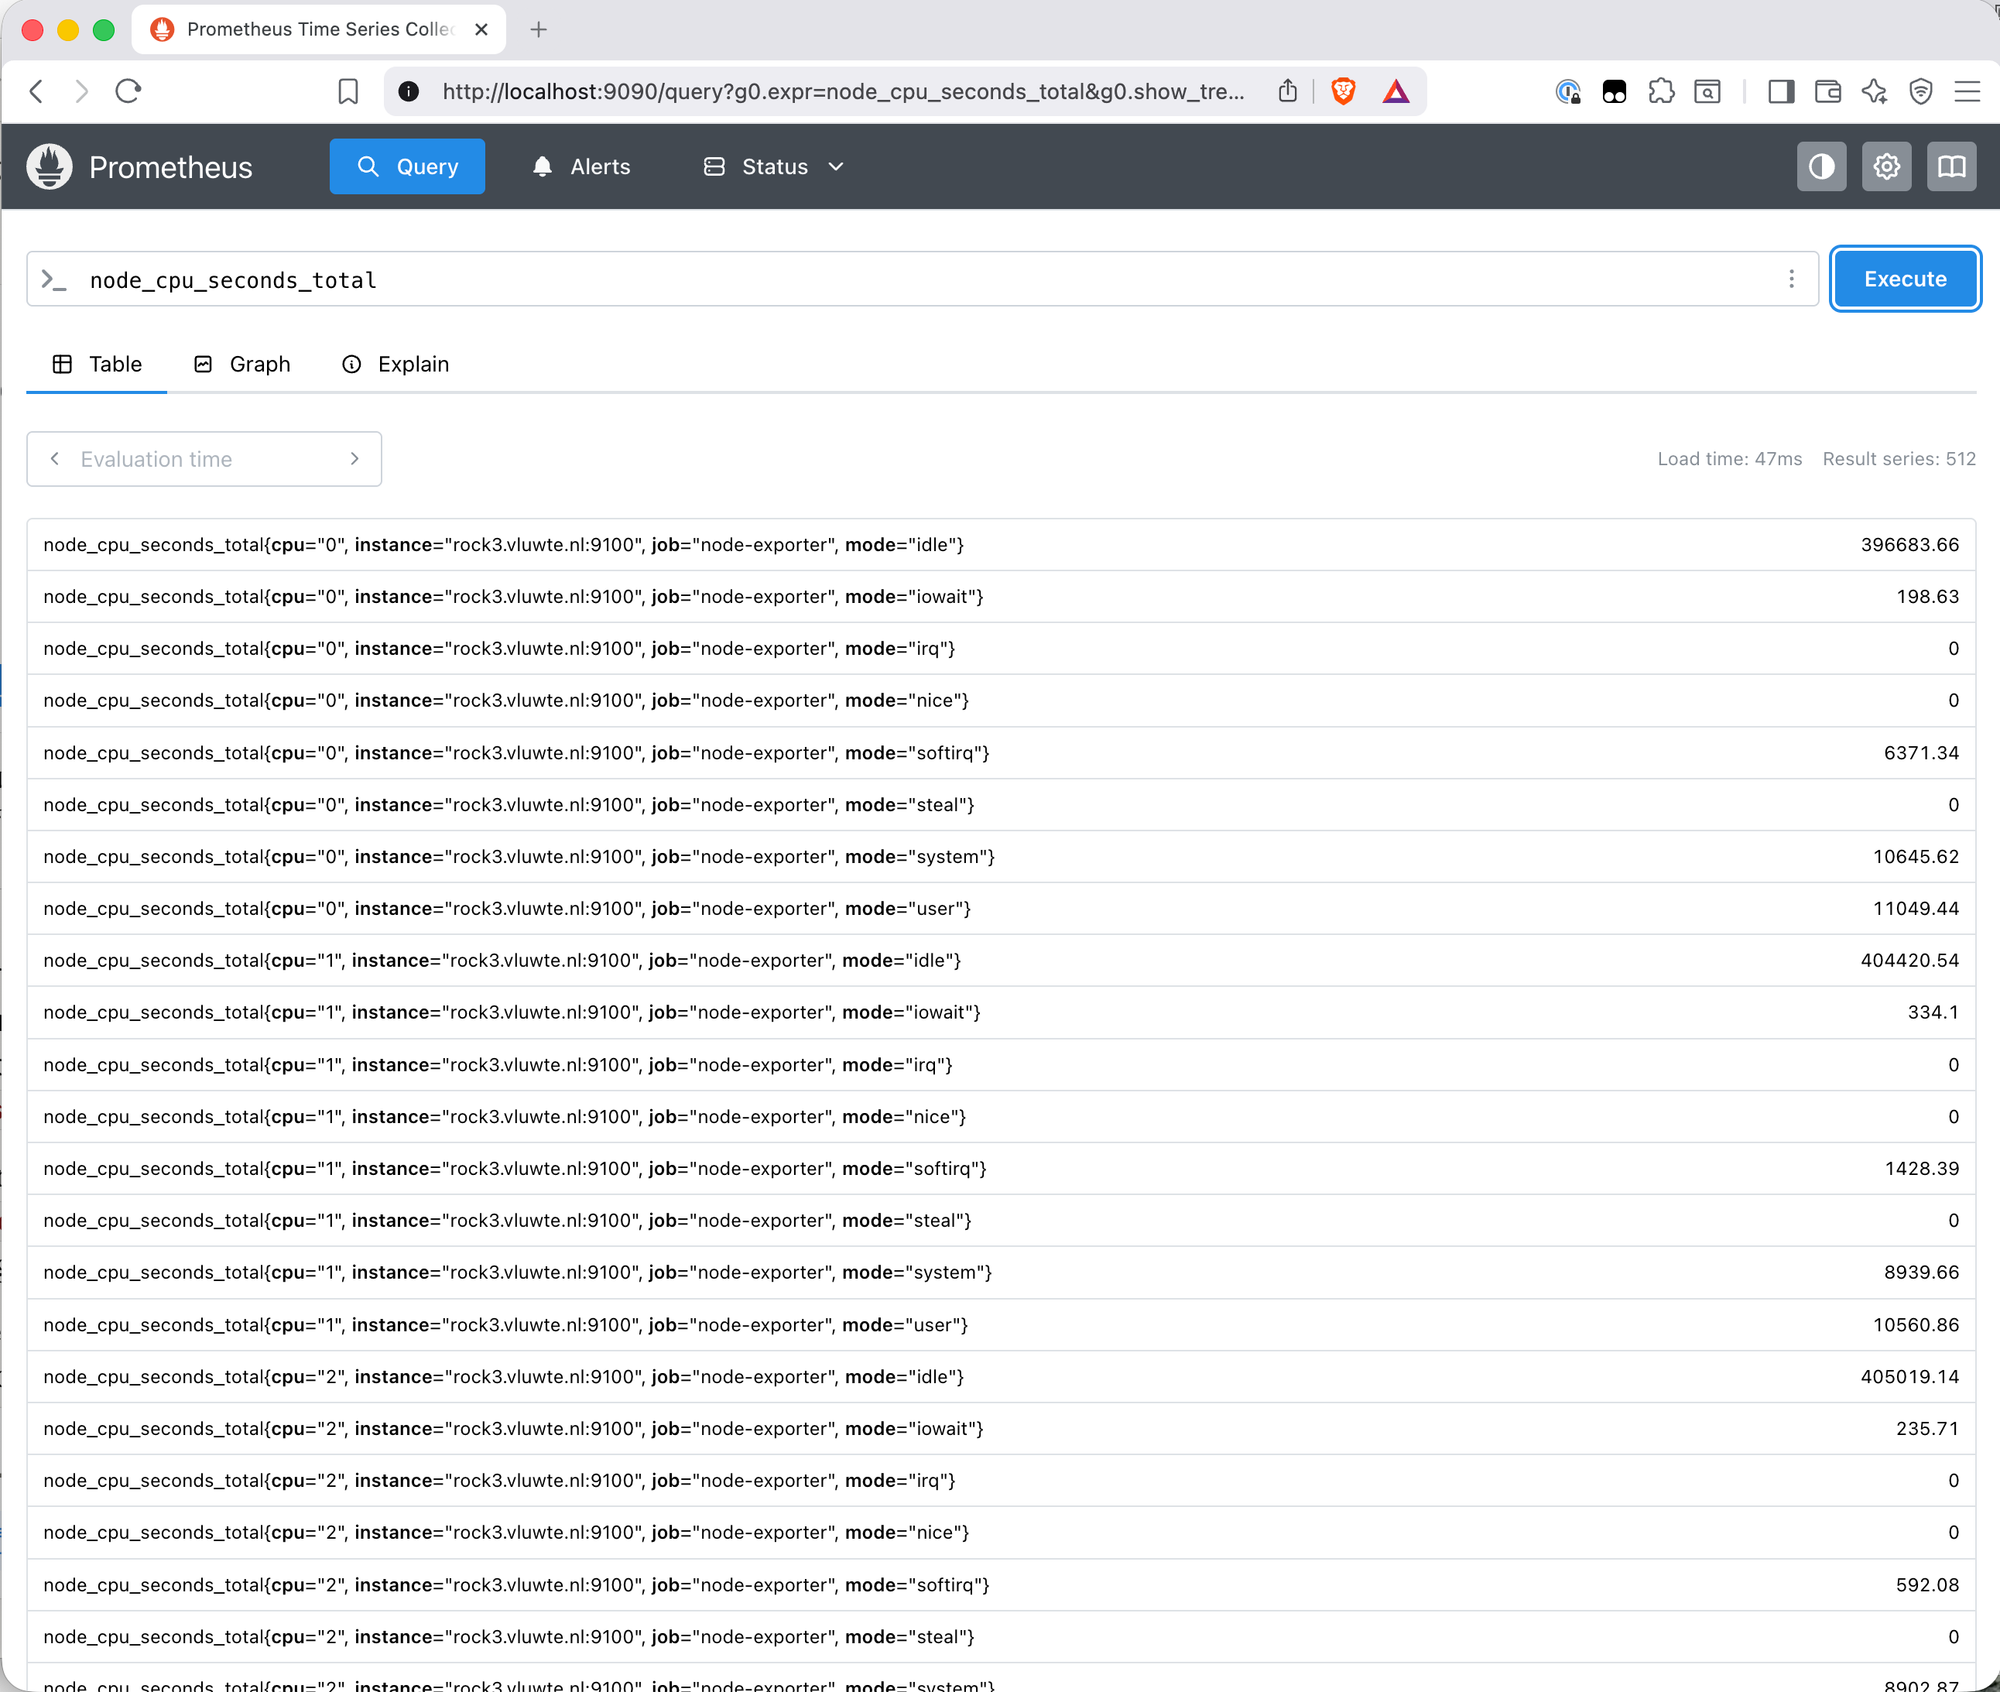
Then run a sanity check query on the Query page:
node_cpu_seconds_total
512 result series — 4 nodes × 8 CPUs × 8 CPU modes — each labelled with instance, cpu, job, and mode. That's real data from real hardware flowing into the TSDB.
Lessons Learned
1. The prometheus-node-exporter: enabled: false line belongs in prometheus-values.yaml from the start.
The standalone prometheus chart bundles node exporter as a sub-chart enabled by default. When running node exporter as a separate Helm release, this line must be explicitly added to the Prometheus values file. Without it, the install deploys a second set of node exporter pods that conflict with the existing ones — they can't bind to port 9100 because it's already taken, and they sit in Pending indefinitely. The fix is a helm upgrade with the line added, which removes the conflicting pods cleanly without touching the Prometheus server. This applies regardless of install order — the duplicate problem happens whether node exporter was installed first or second.
2. Don't add extraArgs: --path.rootfs to the node exporter values file.
The chart already sets --path.rootfs=/host/root internally as part of its default configuration. Adding it again via extraArgs in the values file results in the flag being passed twice on the command line. Node exporter treats repeated flags as an error and immediately exits — which causes a CrashLoopBackOff on all four pods. The error message is clear (flag 'path.rootfs' cannot be repeated), but only visible in the pod logs. The fix is to remove the extraArgs block entirely and let the chart handle it.
3. The PodSecurity warnings on install are not errors.
Both installs produce warnings about violating the restricted pod security standard. These are expected — they're the audit trail of the privileged enforcement decision made when the namespace was labelled. The same pattern appeared with Longhorn. STATUS: deployed in the Helm output is the signal that matters.
What's Working Now
- ✅ Namespace
monitoringcreated and labelledprivileged - ✅ Node exporter DaemonSet running on all four nodes (rock1–rock4)
- ✅ Prometheus server running with a Longhorn-backed 10Gi persistent volume
- ✅ kube-state-metrics running (Kubernetes object state metrics)
- ✅ All four node exporter targets showing
UPin the Prometheus UI - ✅
node_cpu_seconds_totalreturning 512 result series across all nodes
What's Next
The data is flowing but there's no useful way to look at it yet — a raw list of metric values in the Prometheus query UI is functional but not insightful. The next post adds Grafana: connect it to Prometheus as a data source, import the Node Exporter Full dashboard, and get a proper visual overview of what the cluster is actually doing.
← Previous: Longhorn Deep Dive
→ Next: Grafana Dashboards
Questions or suggestions? Leave a comment below or reach out at igor@vluwte.nl.