Cluster Observability Part 3: Dashboards for Storage, Kubernetes, and Network
Importing Longhorn, Kubernetes, and resource dashboards onto the Bletchley cluster — and fixing the scrape config that was only collecting from one of four nodes.
Introduction
Prometheus has been collecting data from the Bletchley cluster since Part 1. Four nodes, all their filesystems, every container, every Kubernetes object — fifteen days of metrics sitting in a Longhorn-backed volume. The problem was that none of it was visible. There was one dashboard showing node-level CPU and memory, and that was it. Longhorn volumes could fill up silently. Pods could be stuck in CrashLoopBackOff. The 1Gb inter-node links could be saturating. None of it would surface unless you happened to be looking at the right kubectl output at the right moment.
This post is about fixing that. Almost no new configuration — the data already exists for Kubernetes and node metrics. The one exception is Longhorn: it exposes a metrics endpoint natively but needs an explicit scrape job added to Prometheus before any of that data becomes available. Everything else is dashboards on top of what's already being collected.
It turned out to be slightly more involved than just clicking Import. Longhorn needed a scrape job added before any dashboard would show data, and the scrape job itself needed a fix once the dashboard revealed it was only collecting from one of four nodes. The dashboard found the problem that the Prometheus targets page hadn't surfaced. That felt like a good demonstration of why dashboards matter.
🏠 This is part of the Homelab Journey series - building a production Kubernetes cluster from scratch.
- Grafana Dashboards
- Cluster Observability Part 3: Dashboards for Storage, Kubernetes, and Network (you are here)
- Central Authentication
This post assumes Prometheus, Node Exporter, and Grafana are already running in the monitoring namespace. If you haven't set that up yet, start with Prometheus and Node Exporter and Grafana Dashboards first.What Prometheus Is Already Collecting
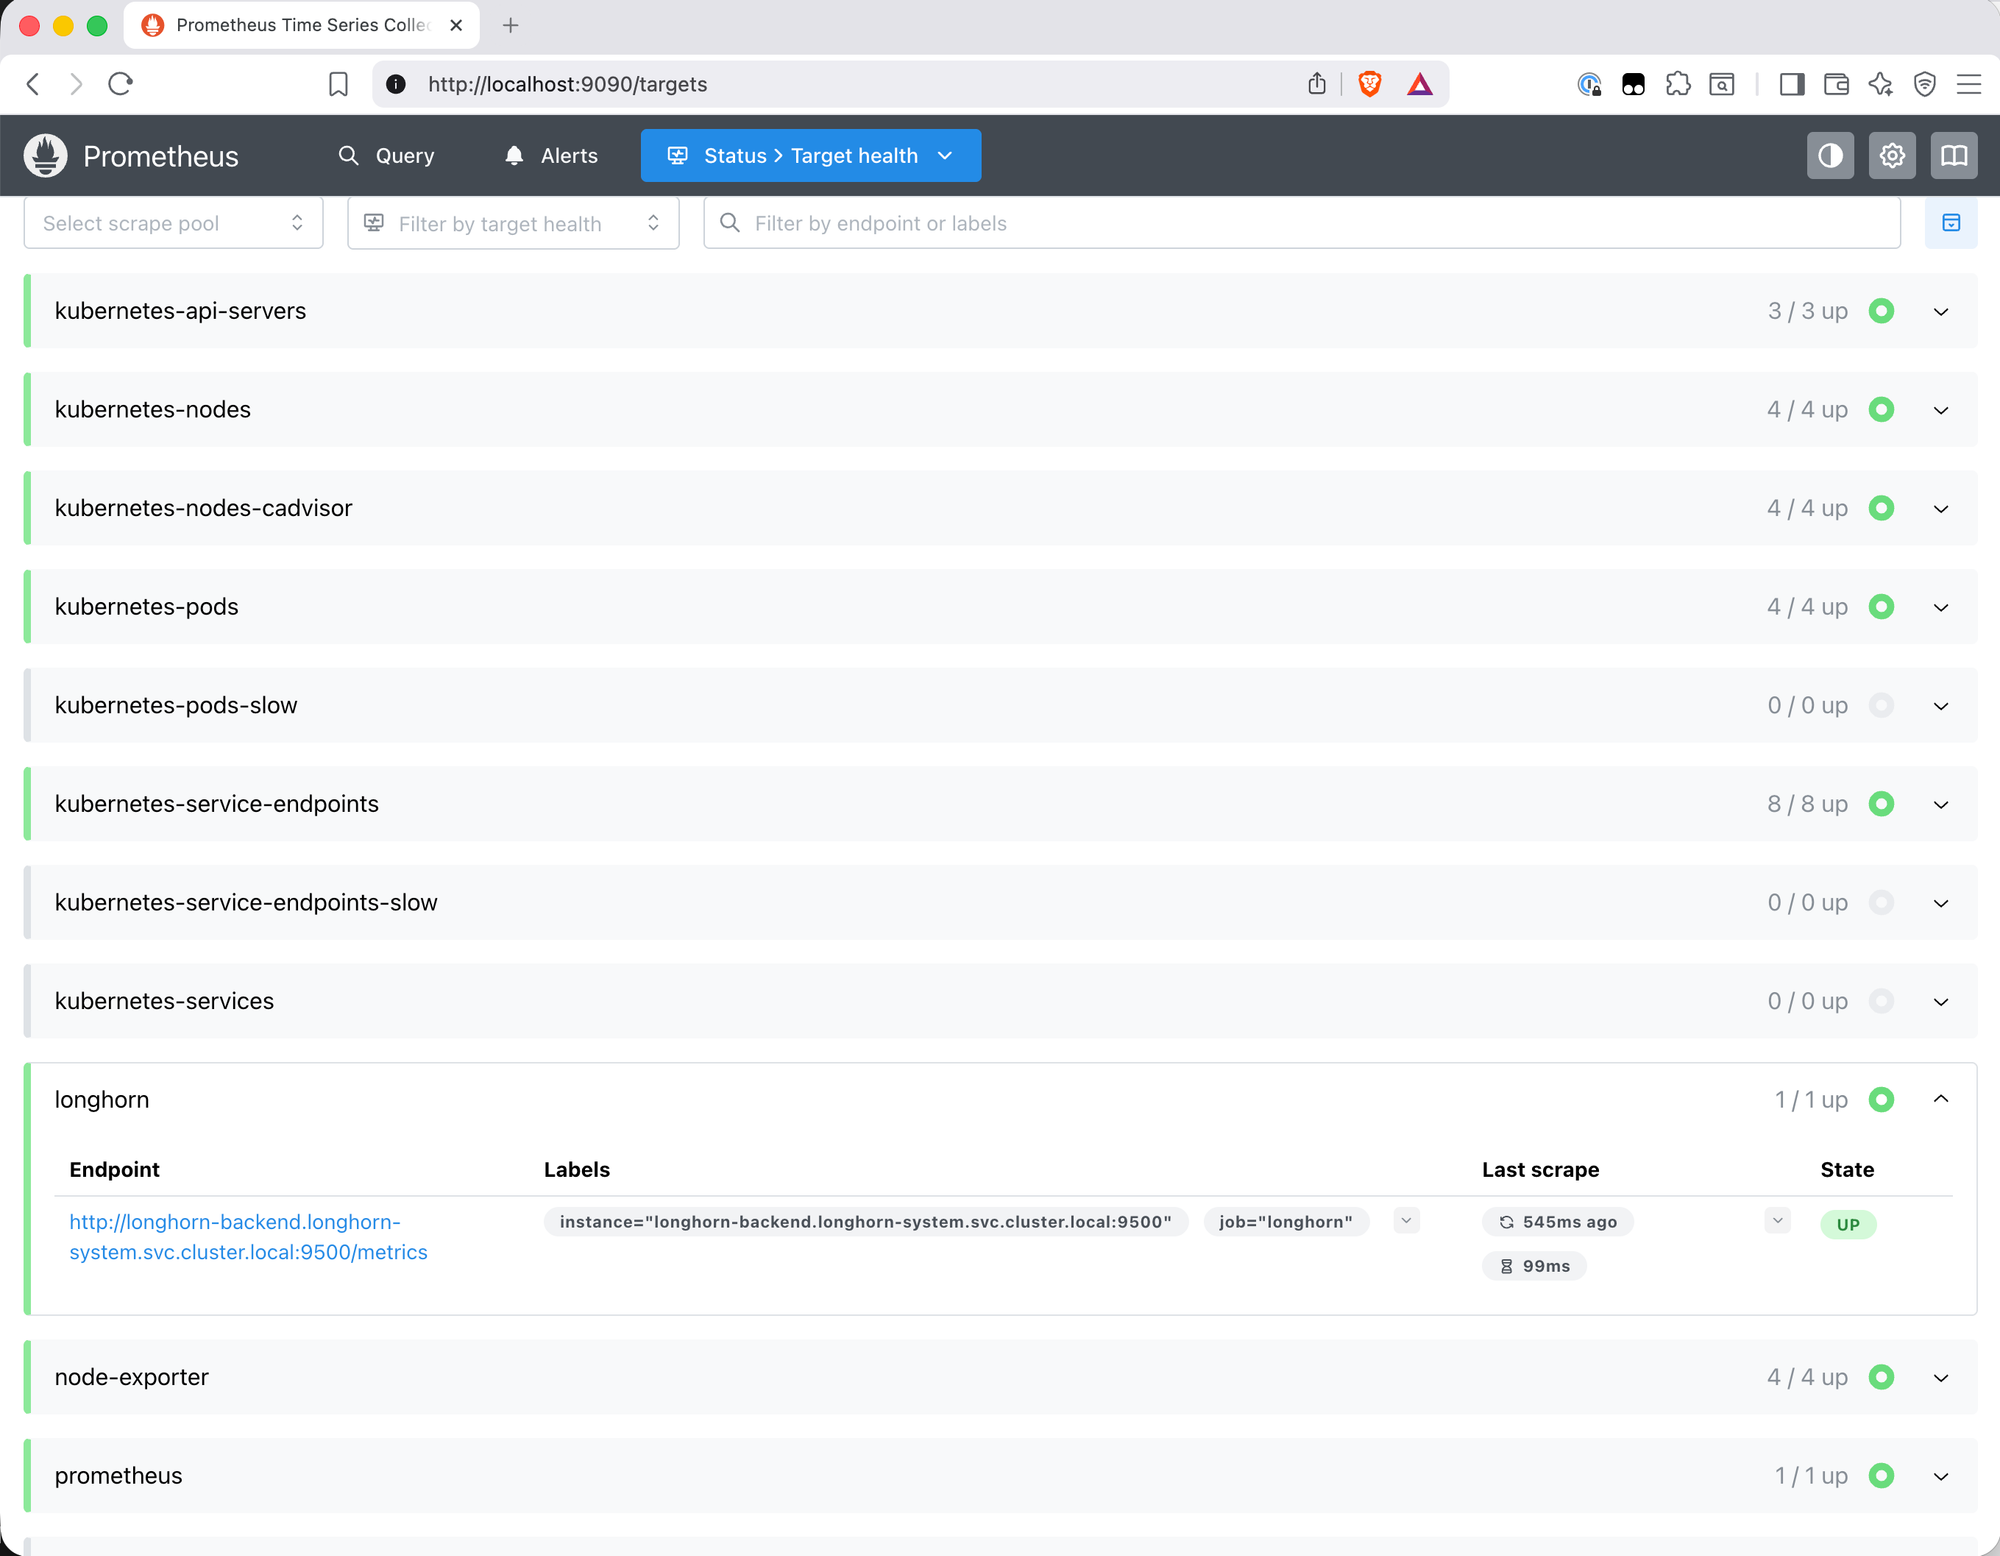
Before importing anything, it's worth knowing what's actually in Prometheus. The targets page at /targets is the place to start. After the setup in Parts 1 and 2, this is what's scraping:
| Job | Targets | What it provides |
|---|---|---|
node-exporter |
4/4 | Per-node CPU, memory, disk I/O, filesystem, network |
kubernetes-nodes-cadvisor |
4/4 | Container-level CPU and memory via cAdvisor |
kubernetes-service-endpoints |
8/8 | kube-state-metrics — pod status, deployment health, restart counts |
kubernetes-api-servers |
3/3 | API server metrics |
kubernetes-nodes |
4/4 | Node-level Kubernetes metrics |
kubernetes-pods |
4/4 | Pod-level metrics via annotation discovery |
prometheus |
1/1 | Prometheus self-scrape |
One notable absence: Longhorn. Despite running on the cluster and exposing a /metrics endpoint, it wasn't appearing anywhere in the targets list. The longhorn_volume_usage_bytes query in the expression browser returned nothing. On Bletchley Longhorn doesn't have the Kubernetes annotations that trigger automatic service discovery, so it needs an explicit scrape job.
Adding the Longhorn Scrape Job
Longhorn exposes metrics on port 9500 of the longhorn-manager pods, accessible via the longhorn-backend service. Verifying this is straightforward:
kubectl get svc -n longhorn-system
NAME                         TYPE        CLUSTER-IP      EXTERNAL-IP   PORT(S)    AGE
longhorn-backend             ClusterIP   10.109.240.79   <none>        9500/TCP   22d
longhorn-frontend            ClusterIP   10.108.100.97   <none>        80/TCP     22d
longhorn-admission-webhook   ClusterIP   10.96.136.242   <none>        9502/TCP   22d
The service exists and maps to port 9500. Before updating Prometheus, it's worth confirming the metrics endpoint actually responds. The natural approach is kubectl port-forward — but that doesn't work here, and understanding why is useful.
Why Port-Forward Fails for Longhorn
Running kubectl port-forward svc/longhorn-backend 9500:9500 connects successfully but immediately drops with "connection refused" inside the pod. The reason becomes clear when you check what the process is actually listening on from inside the container:
kubectl -n longhorn-system exec -it pod/longhorn-manager-9tgvz -- sh -c "ss -tlnp"
State   Local Address:Port
LISTEN  10.244.1.4:9500       ← pod IP, not localhost or 0.0.0.0
LISTEN  127.0.0.1:6060
LISTEN  *:9503
LISTEN  *:9502
Port 9500 is bound to the pod's own IP (10.244.1.4), not to 0.0.0.0. kubectl port-forward tries to connect to 127.0.0.1:9500 inside the network namespace — nothing is there. This is worth understanding: most Go-based metrics exporters bind to :9500 (all interfaces) by default, accepting connections from anywhere. Longhorn's choice to bind specifically to the pod IP is deliberate — it is a more restrictive choice than the typical :9500 binding used by most exporters. It just means port-forward can't be used to test it directly.
The workaround is to curl from inside the pod using its actual IP:
kubectl -n longhorn-system exec -it pod/longhorn-manager-9tgvz -- \
  sh -c "curl http://10.244.1.4:9500/metrics 2>&1 | head -5"
# HELP longhorn_backup_actual_size_bytes Actual size of this backup
# TYPE longhorn_backup_actual_size_bytes gauge
longhorn_backup_actual_size_bytes{backup="backup-0be9f05...",volume="pvc-710ed4..."} 4.17e+08
Metrics are there. The endpoint works.
First Attempt: Single Service Target
The obvious scrape config points at the service:
extraScrapeConfigs: |
  - job_name: longhorn
    static_configs:
      - targets: ['longhorn-backend.longhorn-system.svc.cluster.local:9500']
After a helm upgrade, the Longhorn job appeared in Prometheus targets — 1/1 up. Looked correct.
Imported dashboard 22705 and immediately saw the problem.
The Dashboard Found What the Targets Page Didn't
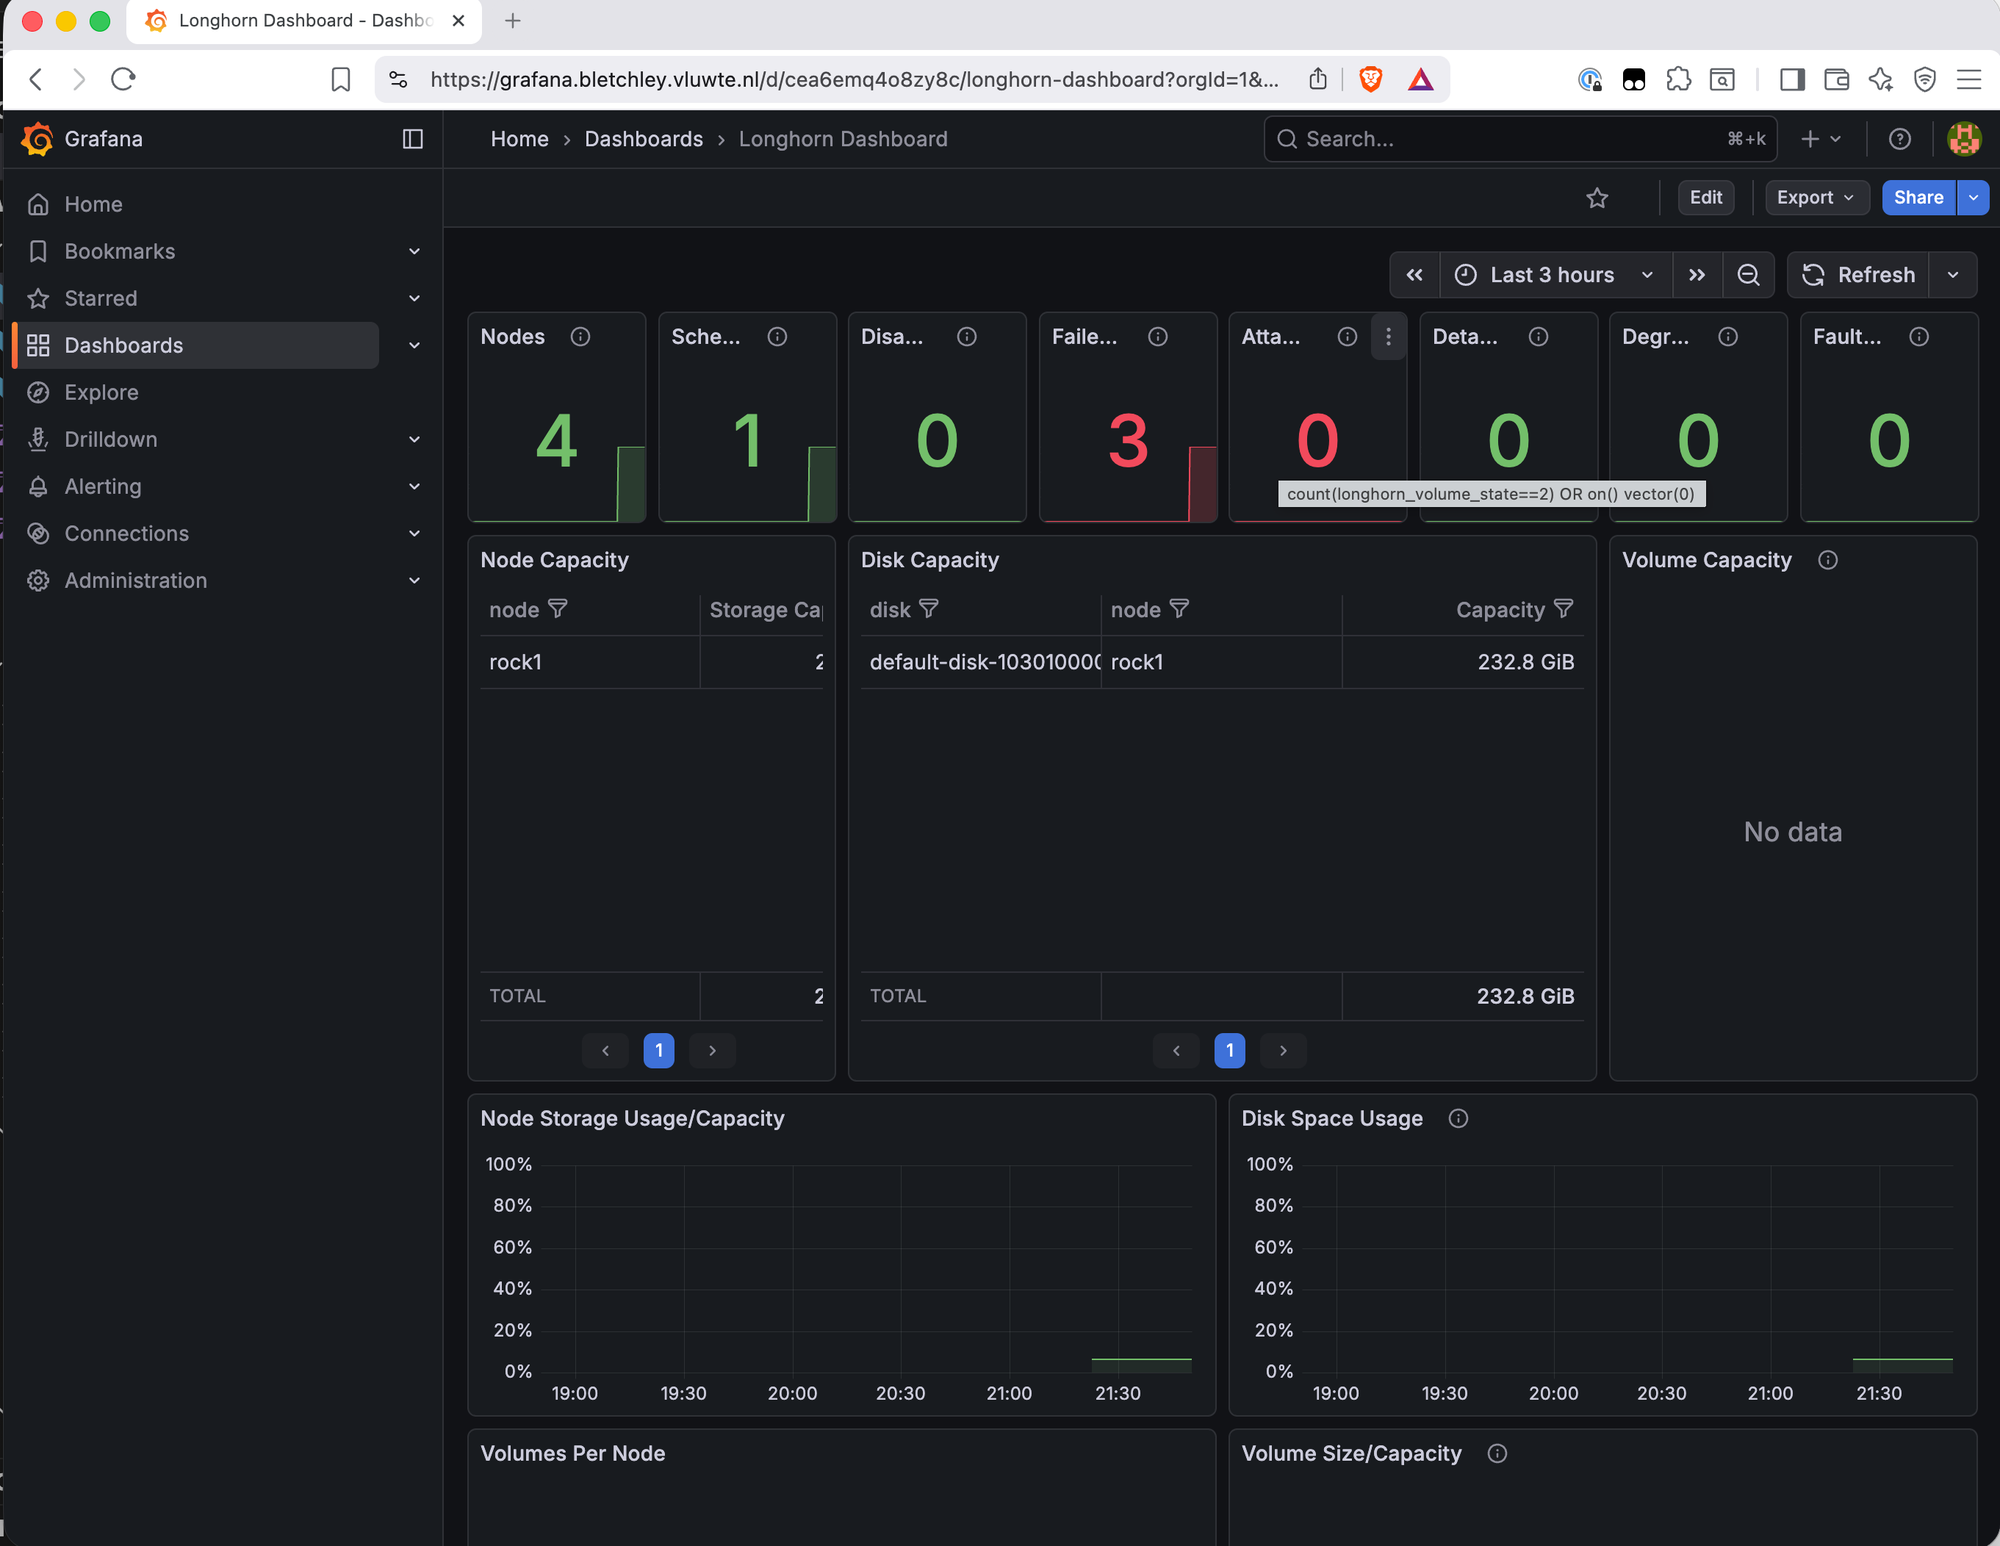
The top row of the Longhorn dashboard showed: Nodes: 4, Scheduled: 1, Failed: 3 in red.
Drilling into the Failed Nodes panel revealed the query: total nodes minus nodes with condition="ready". The Prometheus query longhorn_node_status showed only 8 results — all for node="rock1". Three nodes were completely absent from the metrics.
The scrape job was working — it was hitting the longhorn-backend service — but a Kubernetes Service DNS name is not a direct connection to a pod. kube-proxy intercepts the connection via iptables/IPVS rules and routes it to one of the backing pods. This isn't truly random — kube-proxy load balancing often ends up sticky due to connection reuse and consistent hashing, which is why it wasn't cycling through the four pods but consistently landing on rock1's pod, leaving the other three nodes unreported.
The Fix: Kubernetes Service Discovery
Pod IPs are not stable — they change on every restart. Hardcoding the four pod IPs would work until the next restart. The right approach is to let Prometheus find the pods dynamically using Kubernetes service discovery:
extraScrapeConfigs: |
  - job_name: longhorn
    kubernetes_sd_configs:
      - role: pod
        namespaces:
          names:
            - longhorn-system
    relabel_configs:
      - source_labels: [__meta_kubernetes_pod_label_app]
        action: keep
        regex: longhorn-manager
      - source_labels: [__meta_kubernetes_pod_ip]
        target_label: __address__
        replacement: $1:9500
      - source_labels: [__meta_kubernetes_pod_node_name]
        target_label: node
This tells Prometheus to find all pods in longhorn-system with label app=longhorn-manager and scrape port 9500 on each one. The pod IP is used directly — which works precisely because Longhorn binds to the pod IP, not localhost. The node label is added from the pod's node name so metrics can be filtered per node in dashboards.
Two assumptions are baked in. Port 9500 is hardcoded — this works because each longhorn-manager pod exposes metrics on exactly one port and that's consistent across all pods. The app=longhorn-manager label selector is specific to this Longhorn deployment — label conventions can differ between Helm chart versions and installation methods. Before applying this to a different cluster, verify the actual pod labels with kubectl get pods -n longhorn-system --show-labels and adjust the keep regex accordingly.
A few things worth keeping in mind as the cluster evolves:
Label conflicts. The target_label: node relabel rule adds a node label to all scraped metrics. If Longhorn's own metrics already export a node label internally, this relabel silently overwrites it. honor_labels: true would preserve Longhorn's exported labels instead — not needed here since Longhorn's manager metrics don't export a node label themselves, but worth revisiting if a future version changes that.
Cardinality. Scraping four pods individually rather than one service endpoint means 4x the scrape connections and metric series. On a four-node cluster this is negligible — worth knowing if the pattern is applied at larger scale.
Duplication risk. If the Prometheus Operator is added later and a ServiceMonitor for Longhorn is also created, both configs will scrape the same pods simultaneously — every metric appears twice, breaking aggregations and alerting rules. Moving to Prometheus Operator means removing this extraScrapeConfigs job at the same time.
After applying this config with helm upgrade, the Longhorn dashboard immediately updated: Failed: 0, all four nodes visible in the Node Capacity and Disk Capacity tables.
/image
file: screenshot-step-2-longhorn-grafana-dashboard-updated.png
alt: Longhorn Grafana dashboard showing Nodes 4, Scheduled 4, Failed 0 in green, with Node Capacity table listing rock1 through rock4 and Disk Capacity showing all four nodes with their disks
caption: After switching to Kubernetes service discovery — Failed: 0, all four nodes reporting.
The top row stat panels give an immediate health summary: node count, scheduled volumes, disabled, failed, attached, detached, degraded, faulted. With the scrape config fixed, the remaining panels — disk capacity, volume state, backup status — all show live data across the cluster.
The Node Capacity and Disk Capacity tables show each node with its storage allocation. The Volume Capacity panel shows PVCs by name — useful for tracking which volumes are growing.
A few panels show "No data" — Node CPU/Memory Usage, Longhorn Manager CPU/Memory, and Instance Manager CPU/Memory. These use cAdvisor metrics with label filters that don't match what the kubernetes-nodes-cadvisor job produces on Talos Linux.
"No data" in Grafana is often a query problem, not a scraping problem. The
data exists in Prometheus — runningcontainer_cpu_usage_seconds_totalin the
expression browser returns results immediately. The dashboard queries are filtering
it out with labels that don't exist in this setup. This is one of the most common
traps when importing community dashboards: a blank panel looks like missing data
but is almost always a label mismatch. Always verify in Prometheus first before
assuming a scrape is broken.
The full breakdown of affected panels and root causes across all three dashboards is in the Known Limitations section below.
The Remaining Dashboards
With Longhorn scraping confirmed and the first dashboard working correctly, two
more dashboards were imported via Grafana → Dashboards → New → Import.
Kubernetes K8S Dashboard (ID 15661)
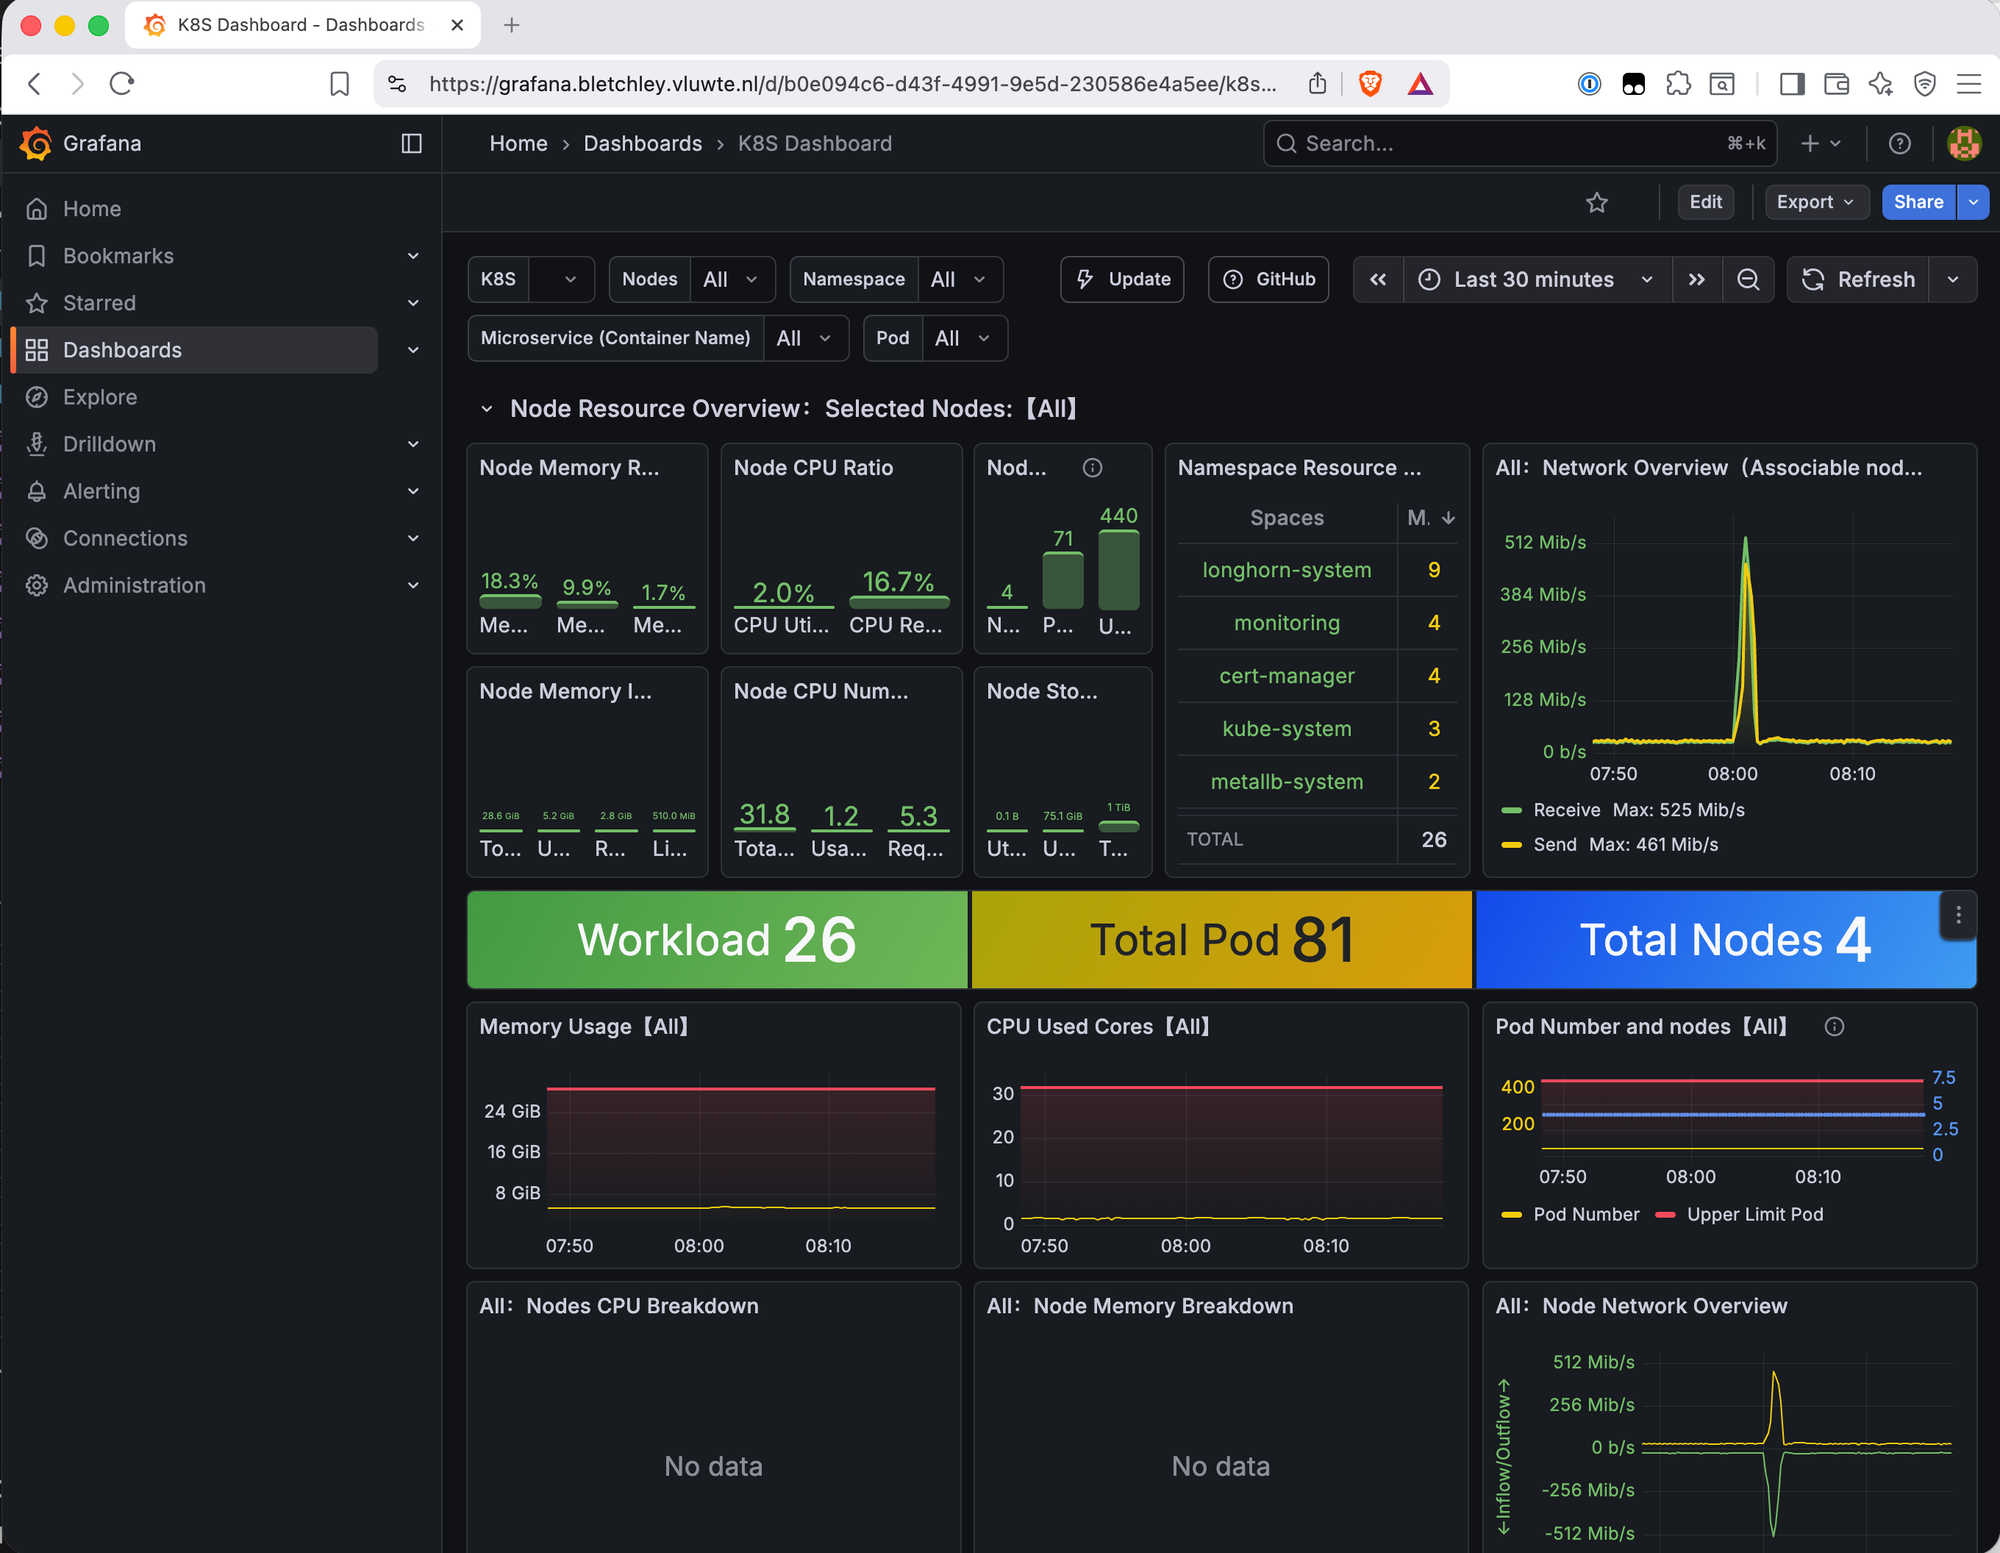
This dashboard works immediately with no configuration — kube-state-metrics is already being scraped via kubernetes-service-endpoints. Key panels:
The namespace resource breakdown shows pod counts per namespace at a glance: longhorn-system (9), monitoring (4), cert-manager (4), kube-system (3), metallb-system (2). Useful for understanding where pods are concentrated.
The network overview shows live inter-node traffic. A spike to 525 Mb/s was visible shortly after import — that's over half the 1Gb inter-node capacity. Longhorn runs recurring backup jobs every four hours, and the spike timing matched exactly. Good to know the backup jobs are visible in network metrics and that the traffic stays well within the 1Gb limit even during a full backup cycle.
The workload summary — Workload 26, Total Pod 81, Total Nodes 4 — gives a quick sanity check that nothing is unexpectedly missing.
CPU usage across all nodes is low (2.0% utilized, 16.7% requested), which confirms the cluster has significant headroom.
Kubernetes Resource Monitoring (ID 17375)
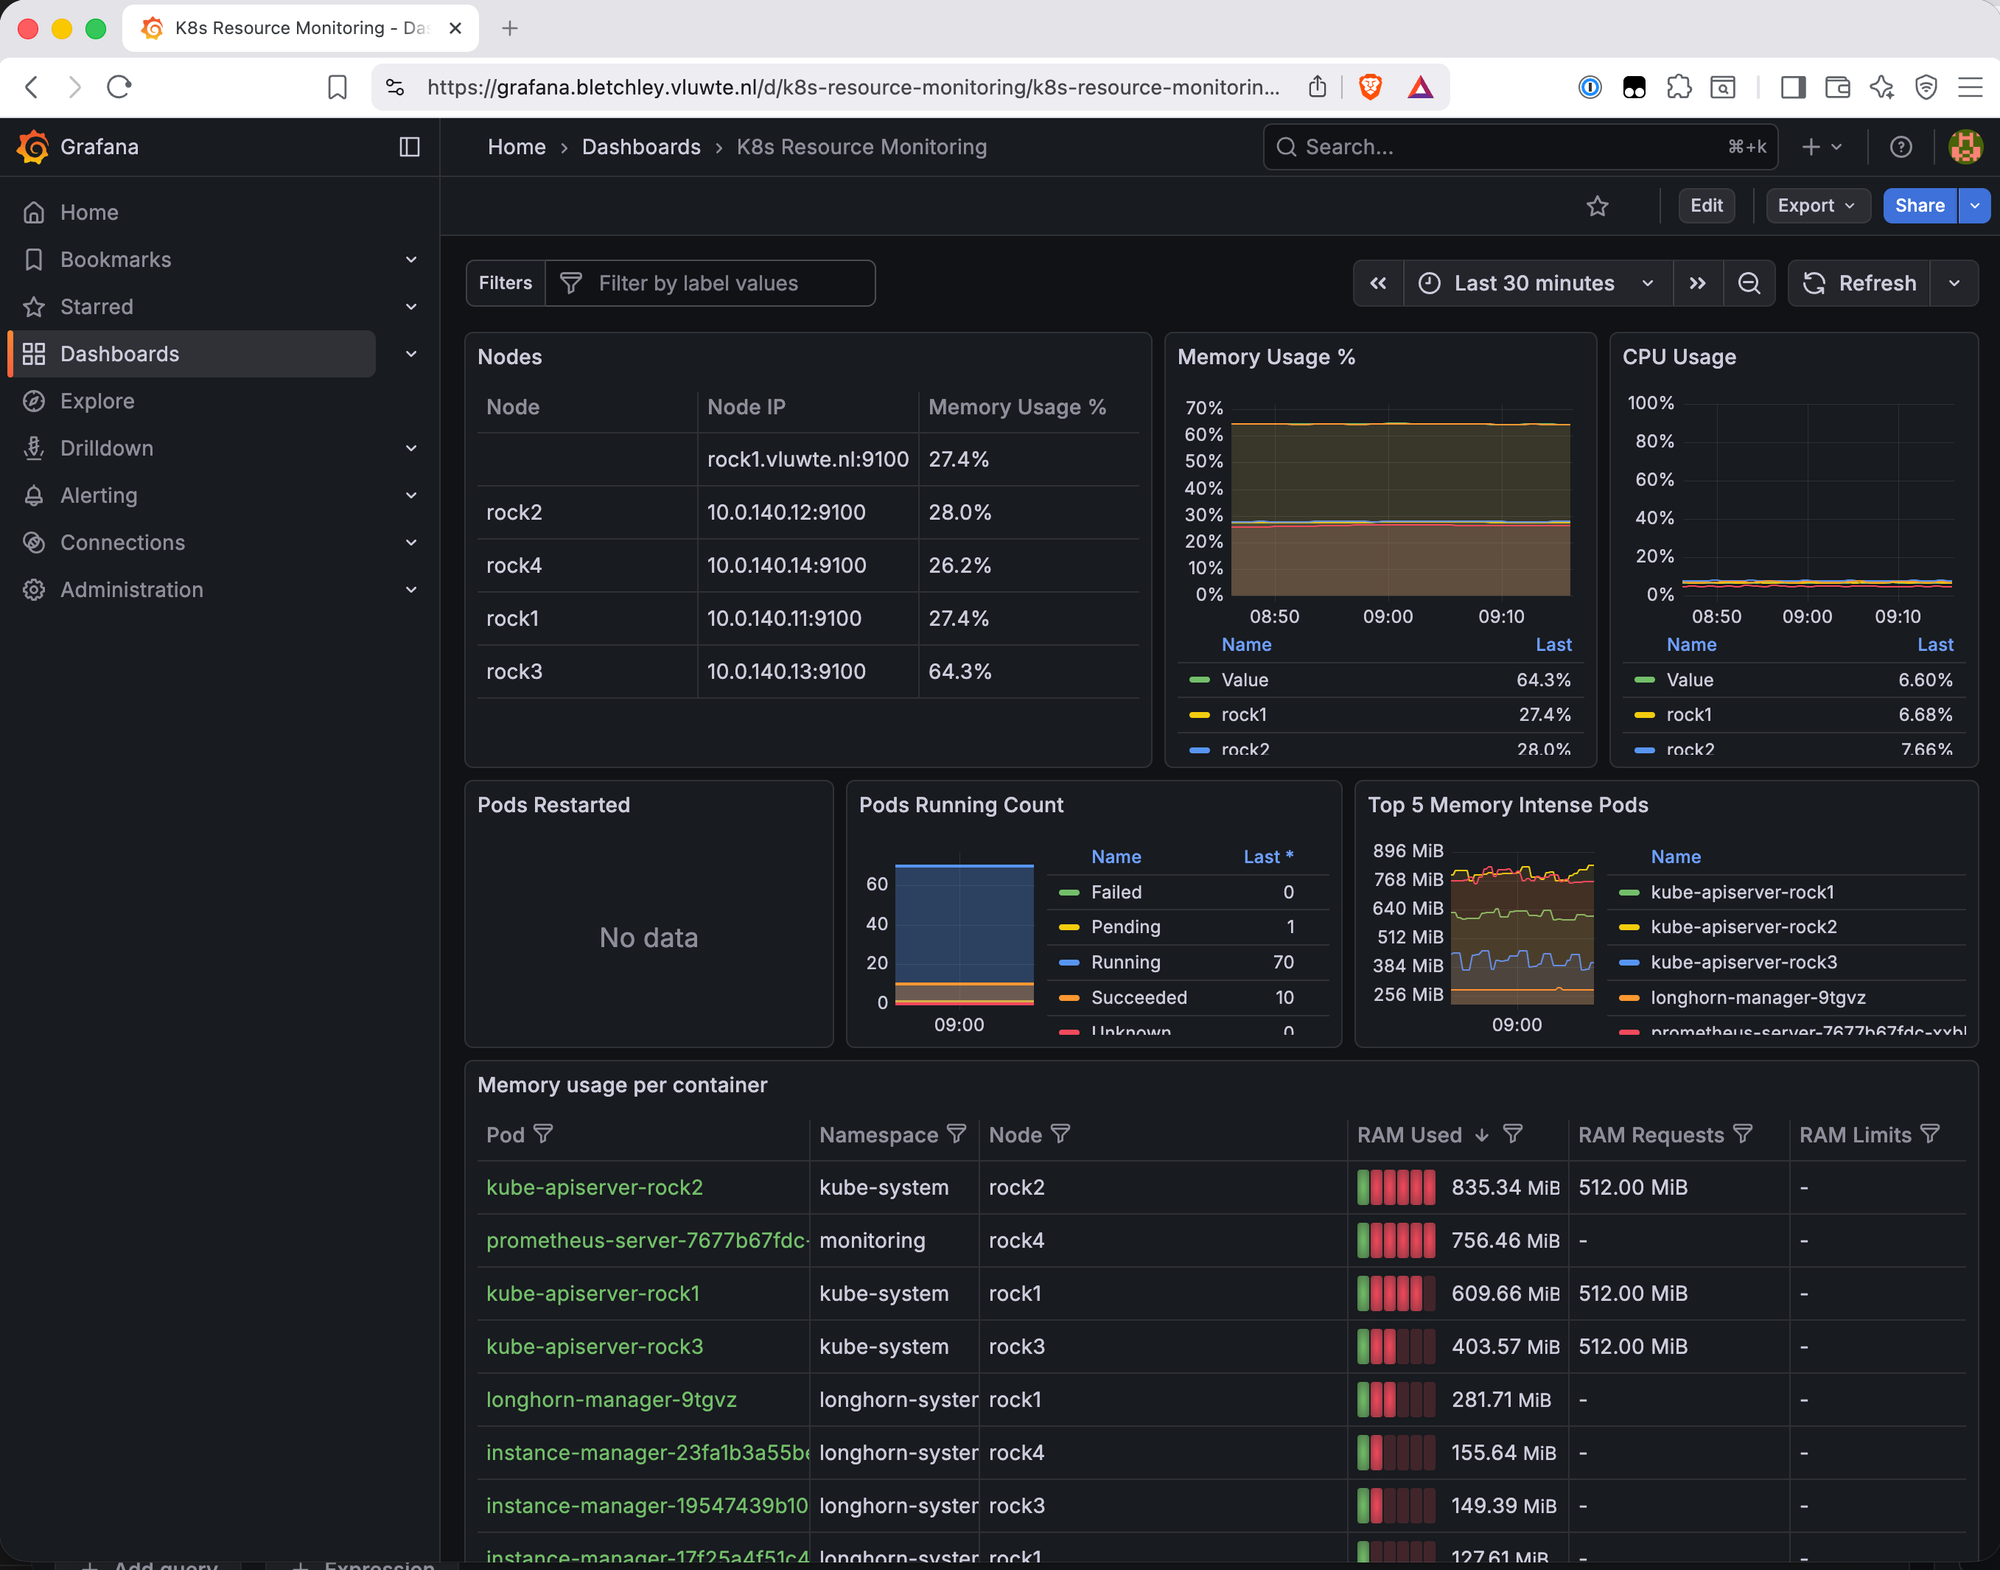
This dashboard provides the most granular resource view of the three. The Node Information Detail table is immediately useful:
| Node | Pods | CPU Cores | Memory | Disk | Memory % |
|---|---|---|---|---|---|
| rock1 | 18 | 8 | 7 GiB | 1 TiB | 27.4% |
| rock2 | 19 | 8 | 7 GiB | 1 TiB | 28.0% |
| rock3 | 16 | 8 | 7 GiB | 1 TiB | 64.3% |
| rock4 | 18 | 8 | 7 GiB | 1 TiB | 26.2% |
rock3 at 64.3% memory immediately stands out.
Why rock3 Is Different
Filtering the Memory Usage per Container table to node = rock3 reveals the answer:
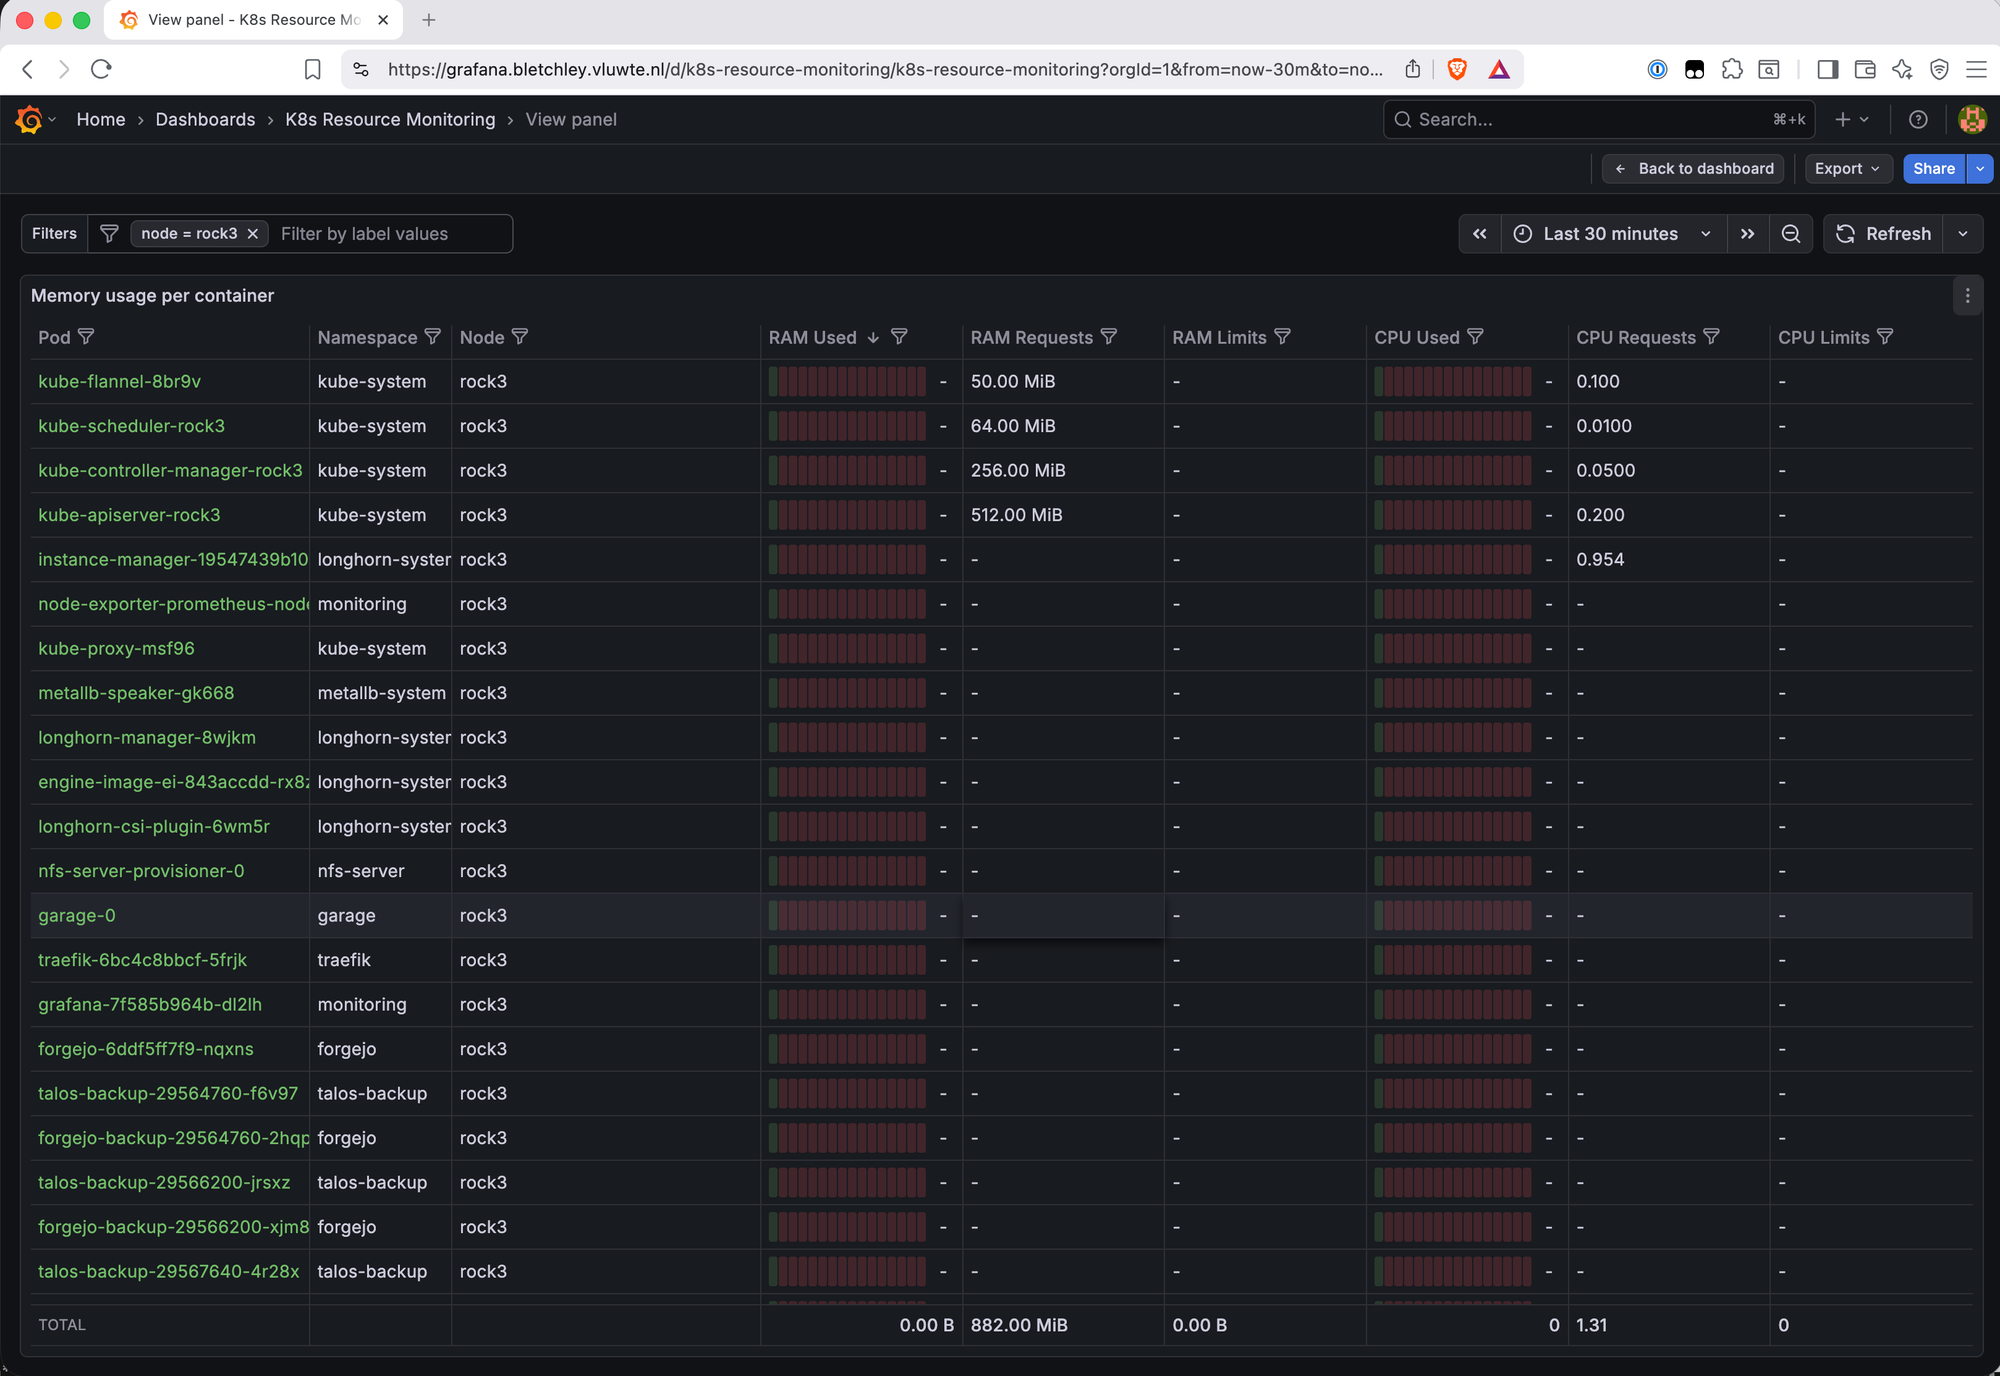
rock3 is carrying two categories of load that the other nodes don't share:
Control plane components — kube-apiserver (512 MiB requested), kube-controller-manager (256 MiB), kube-scheduler (64 MiB). These run on one node in a single-control-plane cluster. rock3 drew the short straw.
Application workloads that landed here — Garage S3 is pinned to rock3 because it's the only node with the additional storage disk. Grafana, Forgejo, Traefik, and nfs-server-provisioner all scheduled onto rock3 by chance. Combined with the control plane overhead and the standard per-node workloads (longhorn-manager, engine-image, csi-plugin, instance-manager, node-exporter, kube-flannel, kube-proxy), rock3 ends up with 22 pods vs 16-19 on the others.
This kind of workload accumulation is common in small clusters. Without anti-affinity rules or topology spread constraints, the Kubernetes scheduler places pods based on available resources at the time of scheduling — it doesn't rebalance existing workloads as new ones arrive. In a four-node cluster where one node happens to have more free capacity at scheduling time, or where certain workloads are pinned by storage constraints (Garage on rock3), the imbalance compounds over time. Adding podAntiAffinity rules or topologySpreadConstraints to key workloads would distribute the load more evenly — worth revisiting once the cluster is more settled.
At 64.3% this isn't a problem — there's still 35% headroom. But it's useful to know, and the dashboard surfaced it in the first five minutes.
What's Working Now
- ✅ Longhorn metrics scraping — all four nodes via Kubernetes service discovery
- ✅ Longhorn Dashboard (22705) — node health, disk capacity, volume state, backup status
- ✅ Kubernetes K8S Dashboard (15661) — namespace overview, network traffic, workload counts
- ✅ Kubernetes Resource Monitoring (17375) — per-node and per-pod memory/CPU, PVC storage
- ✅ All four nodes visible across all dashboards
Known Limitations: Dashboard Panel Mismatches
Several panels across the imported dashboards show "No data." These are not scrape failures — the underlying metrics exist in Prometheus. The cause is label mismatches between what the community dashboards expect and what this setup produces.
origin_prometheus label (affects 15661): Panels using origin_prometheus=~"$origin_prometheus" in their PromQL queries return nothing. This label is added by multi-cluster Prometheus setups (Thanos, federation) and doesn't exist in a single-cluster install. The metric container_cpu_usage_seconds_total is being collected correctly — the filter is excluding it.
cAdvisor label mismatches (affects both 15661 and 22705): The Node CPU Breakdown, Node Memory Breakdown, Longhorn Manager CPU/Memory, and Instance Manager CPU/Memory panels show no data. The kubernetes-nodes-cadvisor job on Talos Linux produces slightly different labels than what these dashboards expect.
Pods Restarted panel (17375): No data for a similar label mismatch reason. This was one of the panels specifically wanted for detecting CrashLoopBackOff — it will be addressed in a future dashboard customisation post.
These are accepted limitations for now. The panels that do work provide good value and the broken panels are a known, diagnosable problem rather than an unknown gap.
Fixing these panels means editing the PromQL queries directly — removing the origin_prometheus filter and correcting the cAdvisor label selectors to match what Talos Linux produces. It's systematic work rather than complex work, and it's the right moment to also add panels specific to this cluster: ZFS pool health, Garage S3 metrics, and Longhorn backup status. That's covered in a future post on adapting community dashboards using Grafana's relabeling and query editor.
What's Next
The cluster now has visibility into storage, Kubernetes health, and resource usage. The next gap is notification — dashboards show you what's happening when you're looking, but nothing alerts when you're not. Part 4 covers enabling Alertmanager and writing the first alerting rules for the thresholds that matter: filesystem usage, node availability, Longhorn volume health, and pod restarts.
Beyond that, the dashboard panel mismatches are worth a dedicated post — adapting community dashboards to remove multi-cluster label filters and fix cAdvisor label mismatches for Talos Linux. That work will also be the right moment to add panels specific to this cluster: ZFS pool health, Garage S3 metrics, and Longhorn backup status.
← Previous: Grafana Dashboards
→ Next: Central Authentication
Questions or suggestions? Leave a comment below or reach out at igor@vluwte.nl.