Cluster Observability Part 2: Grafana Dashboards
Adding Grafana to the Bletchley cluster: Longhorn-backed storage, pre-configured Prometheus datasource, and the Node Exporter Full dashboard showing live node metrics.
Introduction
The previous post got Prometheus running and node exporter collecting hardware metrics from all four RK1 nodes. The data is there — but querying raw metric series in the Prometheus UI isn't how you actually use an observability stack day to day. What you want is a dashboard: CPU, memory, disk, and network for all nodes at a glance, with graphs that show trends over time rather than a snapshot of the current moment.
This post adds Grafana. The steps are lighter than the Prometheus post — no new namespace configuration, no DaemonSets, no Talos-specific gotchas. Grafana is a single Deployment, a Longhorn-backed PVC, and a pre-wired connection to the Prometheus data source that's already running in the same namespace. Install it, import a community dashboard, and the cluster has a proper monitoring interface.
The result is still accessed via port-forward for now. That changes in the next post, when MetalLB and ingress-nginx give everything a real URL.
🏠 This is part of the Homelab Journey series - building a production Kubernetes cluster from scratch.
- Prometheus and Node Exporter
- Cluster Observability Part 2: Grafana Dashboards (you are here)
- MetalLB and ingress-nginx

This post assumes Prometheus and node exporter are already running in the monitoring namespace. If you haven't set that up yet, start with Prometheus and Node Exporter first.The Values File
Grafana comes from its own Helm repository, separate from prometheus-community.
helm repo add grafana https://grafana.github.io/helm-charts
helm repo update
All Grafana config lives alongside the Prometheus values files in ~/talos-cluster/bletchley/grafana/.
# grafana-values.yaml
persistence:
  enabled: true
  storageClassName: longhorn
  size: 5Gi

adminPassword: "changeme"

datasources:
  datasources.yaml:
    apiVersion: 1
    datasources:
      - name: Prometheus
        type: prometheus
        url: http://prometheus-server.monitoring.svc.cluster.local
        isDefault: true
Three things in this file.
Persistent storage. The storageClassName: longhorn setting gives Grafana a replicated PVC for its internal database — dashboards, users, alert rules, preferences. Without persistence, everything configured in the UI is lost the moment the pod restarts. 5Gi is more than sufficient; Grafana's database is small.
Admin password. Setting this explicitly in the values file means you know the password and it's reproducible across reinstalls. Change changeme to something real before leaving this running. The values file should be treated like any credential file — don't commit it to a public repository. The password can be changed later through the Grafana UI at Administration → Users, or by updating the values file and running helm upgrade.
Pre-configured data source. The datasources block wires Grafana to Prometheus before the pod even starts. The URL http://prometheus-server.monitoring.svc.cluster.local is the in-cluster DNS name for the Prometheus service — every Kubernetes Service gets a name in the format <service-name>.<namespace>.svc.cluster.local, resolvable by any pod in the cluster. Since Grafana is going into the same monitoring namespace as Prometheus, this address works immediately with no manual configuration needed. When Grafana starts, Prometheus is already listed as the default data source.
Installing Grafana
helm install grafana grafana/grafana \
  --namespace monitoring \
  --version 10.5.15 \
  --values ~/talos-cluster/bletchley/grafana/grafana-values.yaml
The install produces two notices worth understanding.
The first is this chart is deprecated — the grafana/grafana chart has been flagged in favour of the newer grafana/grafana-enterprise naming convention in the Helm repository. The chart itself works correctly; this is a cosmetic repository housekeeping message, not a functional warning. STATUS shows deployed and the pod comes up healthy.
The second is the familiar PodSecurity warning about the init-chown-data init container, which runs as root to fix filesystem permissions on the Longhorn volume before Grafana starts. Same pattern as Longhorn and Prometheus — expected, not an error.
Watch the pod come up:
kubectl -n monitoring get pods -w
The pod goes through Init:0/1 (the init container running) → PodInitializing → Running. Once it shows 1/1 Running, check that the PVC was provisioned:
kubectl -n monitoring get pvc
NAME                STATUS   VOLUME                                     CAPACITY   STORAGECLASS
grafana             Bound    pvc-710ed489-2d9f-48d8-8d86-83d86f71b85a   5Gi        longhorn
prometheus-server   Bound    pvc-6f155b3a-769d-49da-aa21-e61a073aa82a   10Gi       longhorn
Both PVCs bound. Longhorn is now backing two workloads.
Accessing the UI
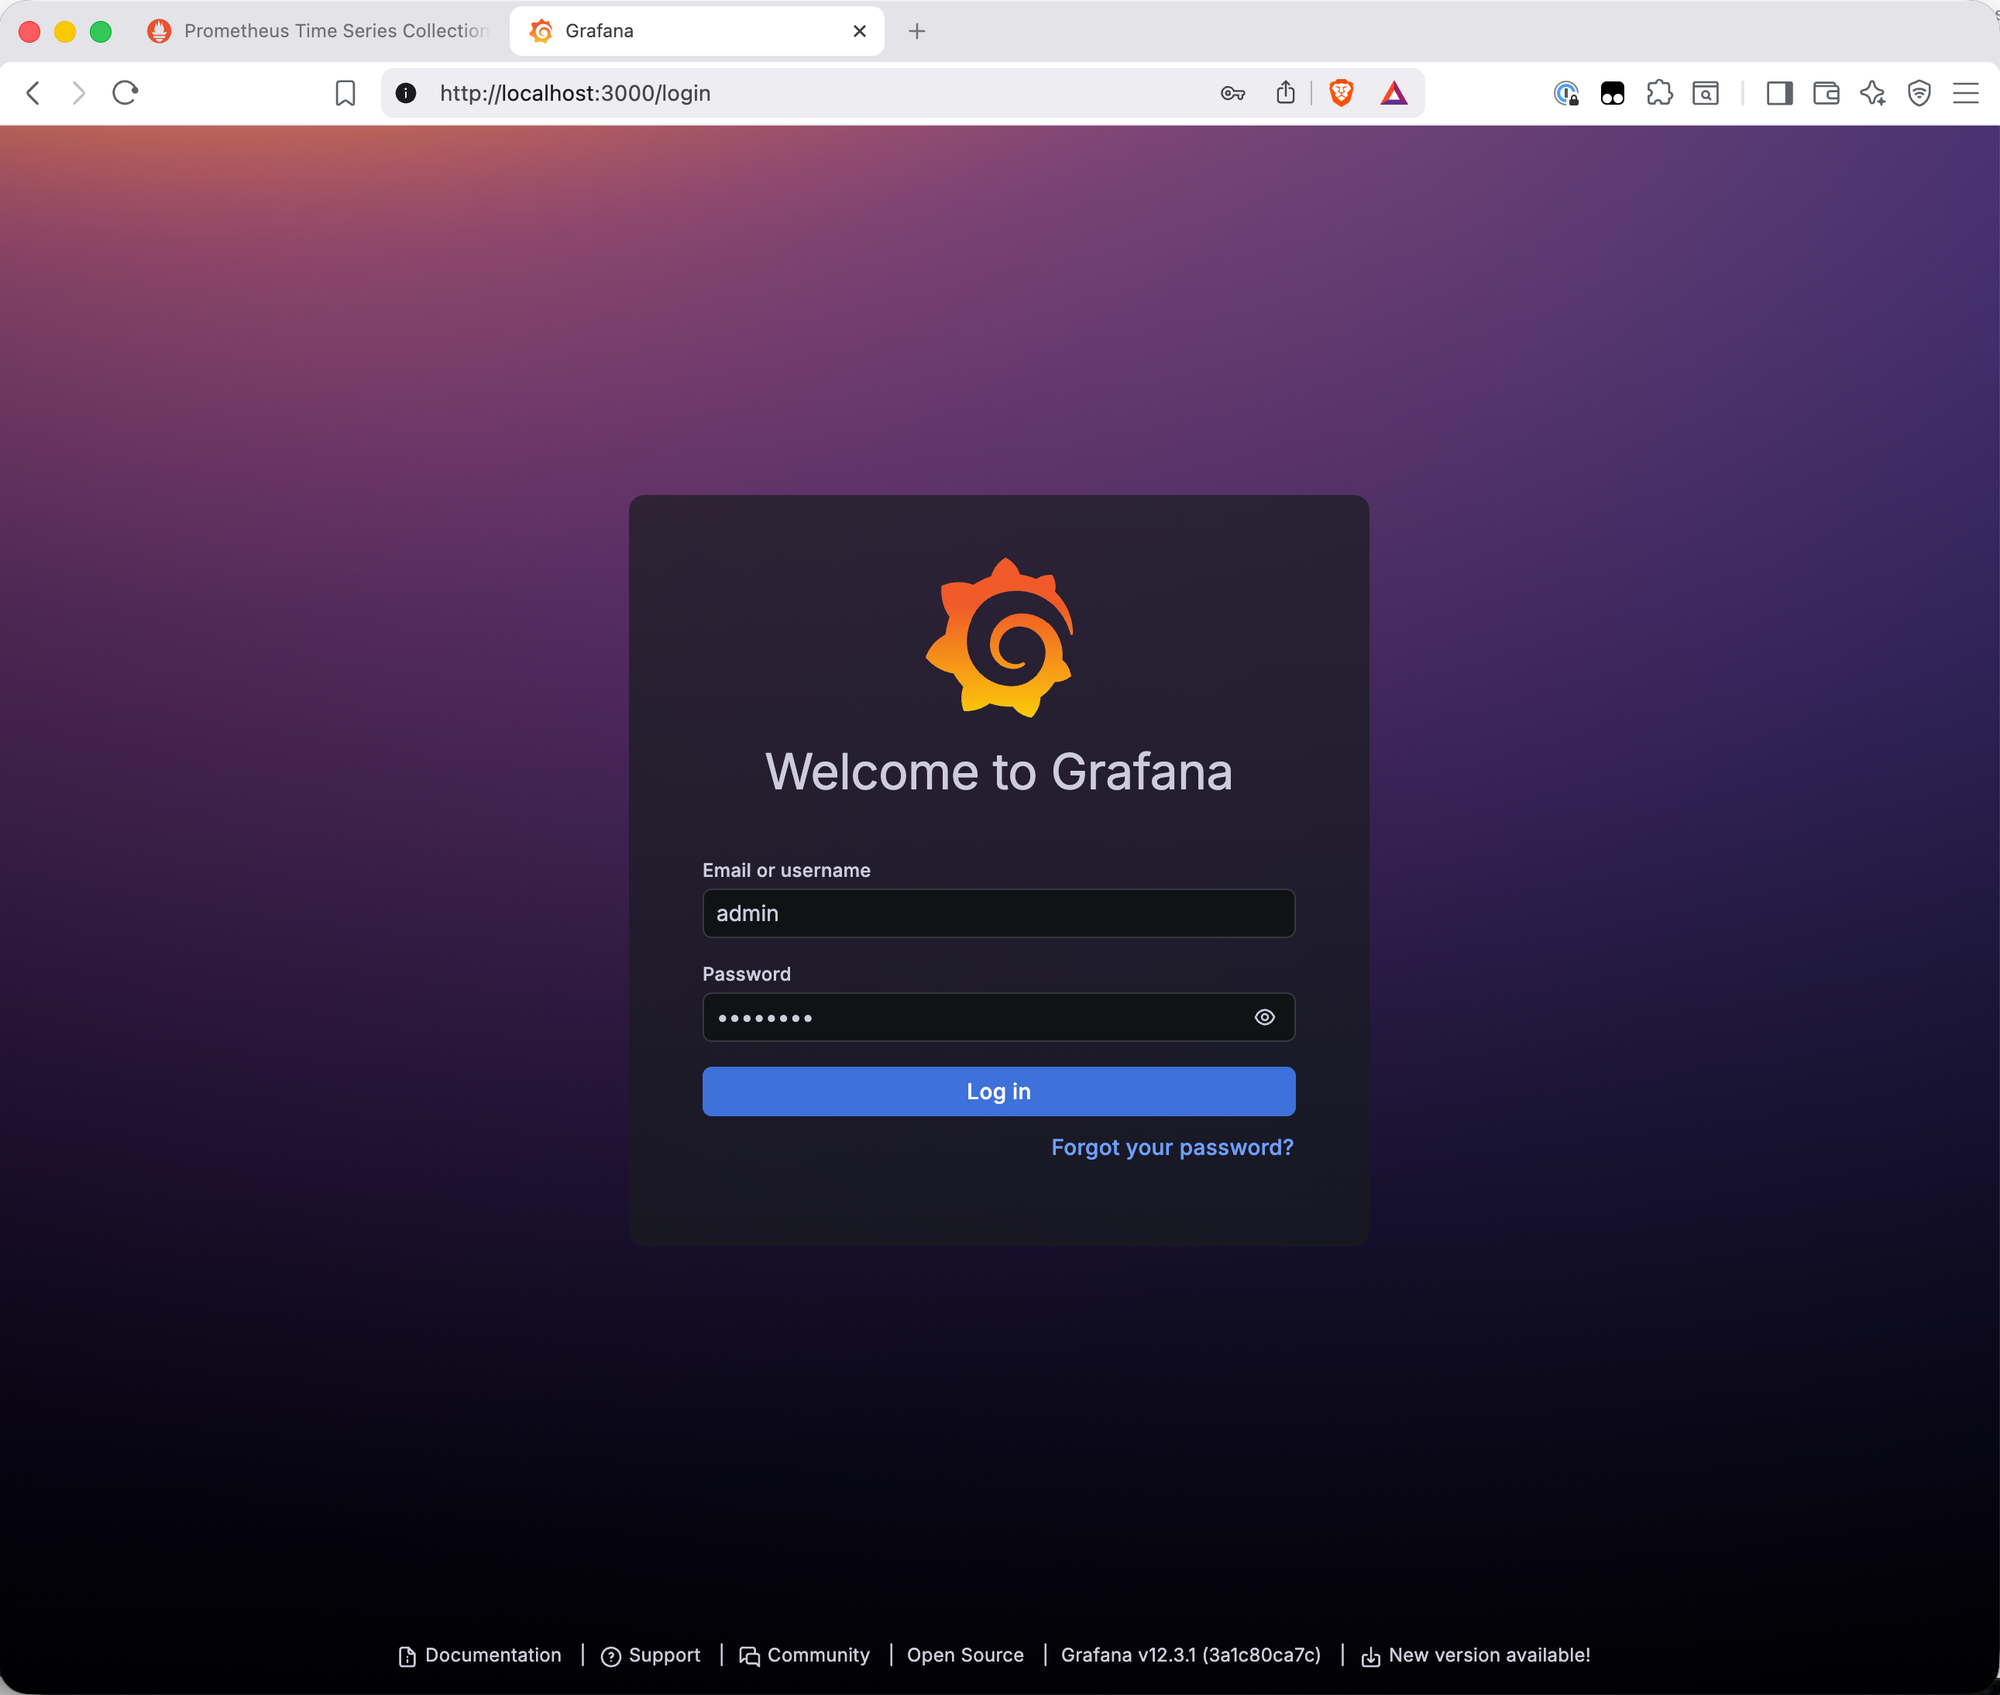
kubectl -n monitoring port-forward svc/grafana 3000:80
Open http://localhost:3000. Grafana v12.3.1 is running — the application version is separate from the Helm chart version (10.5.15). Log in with admin and the password set in the values file.
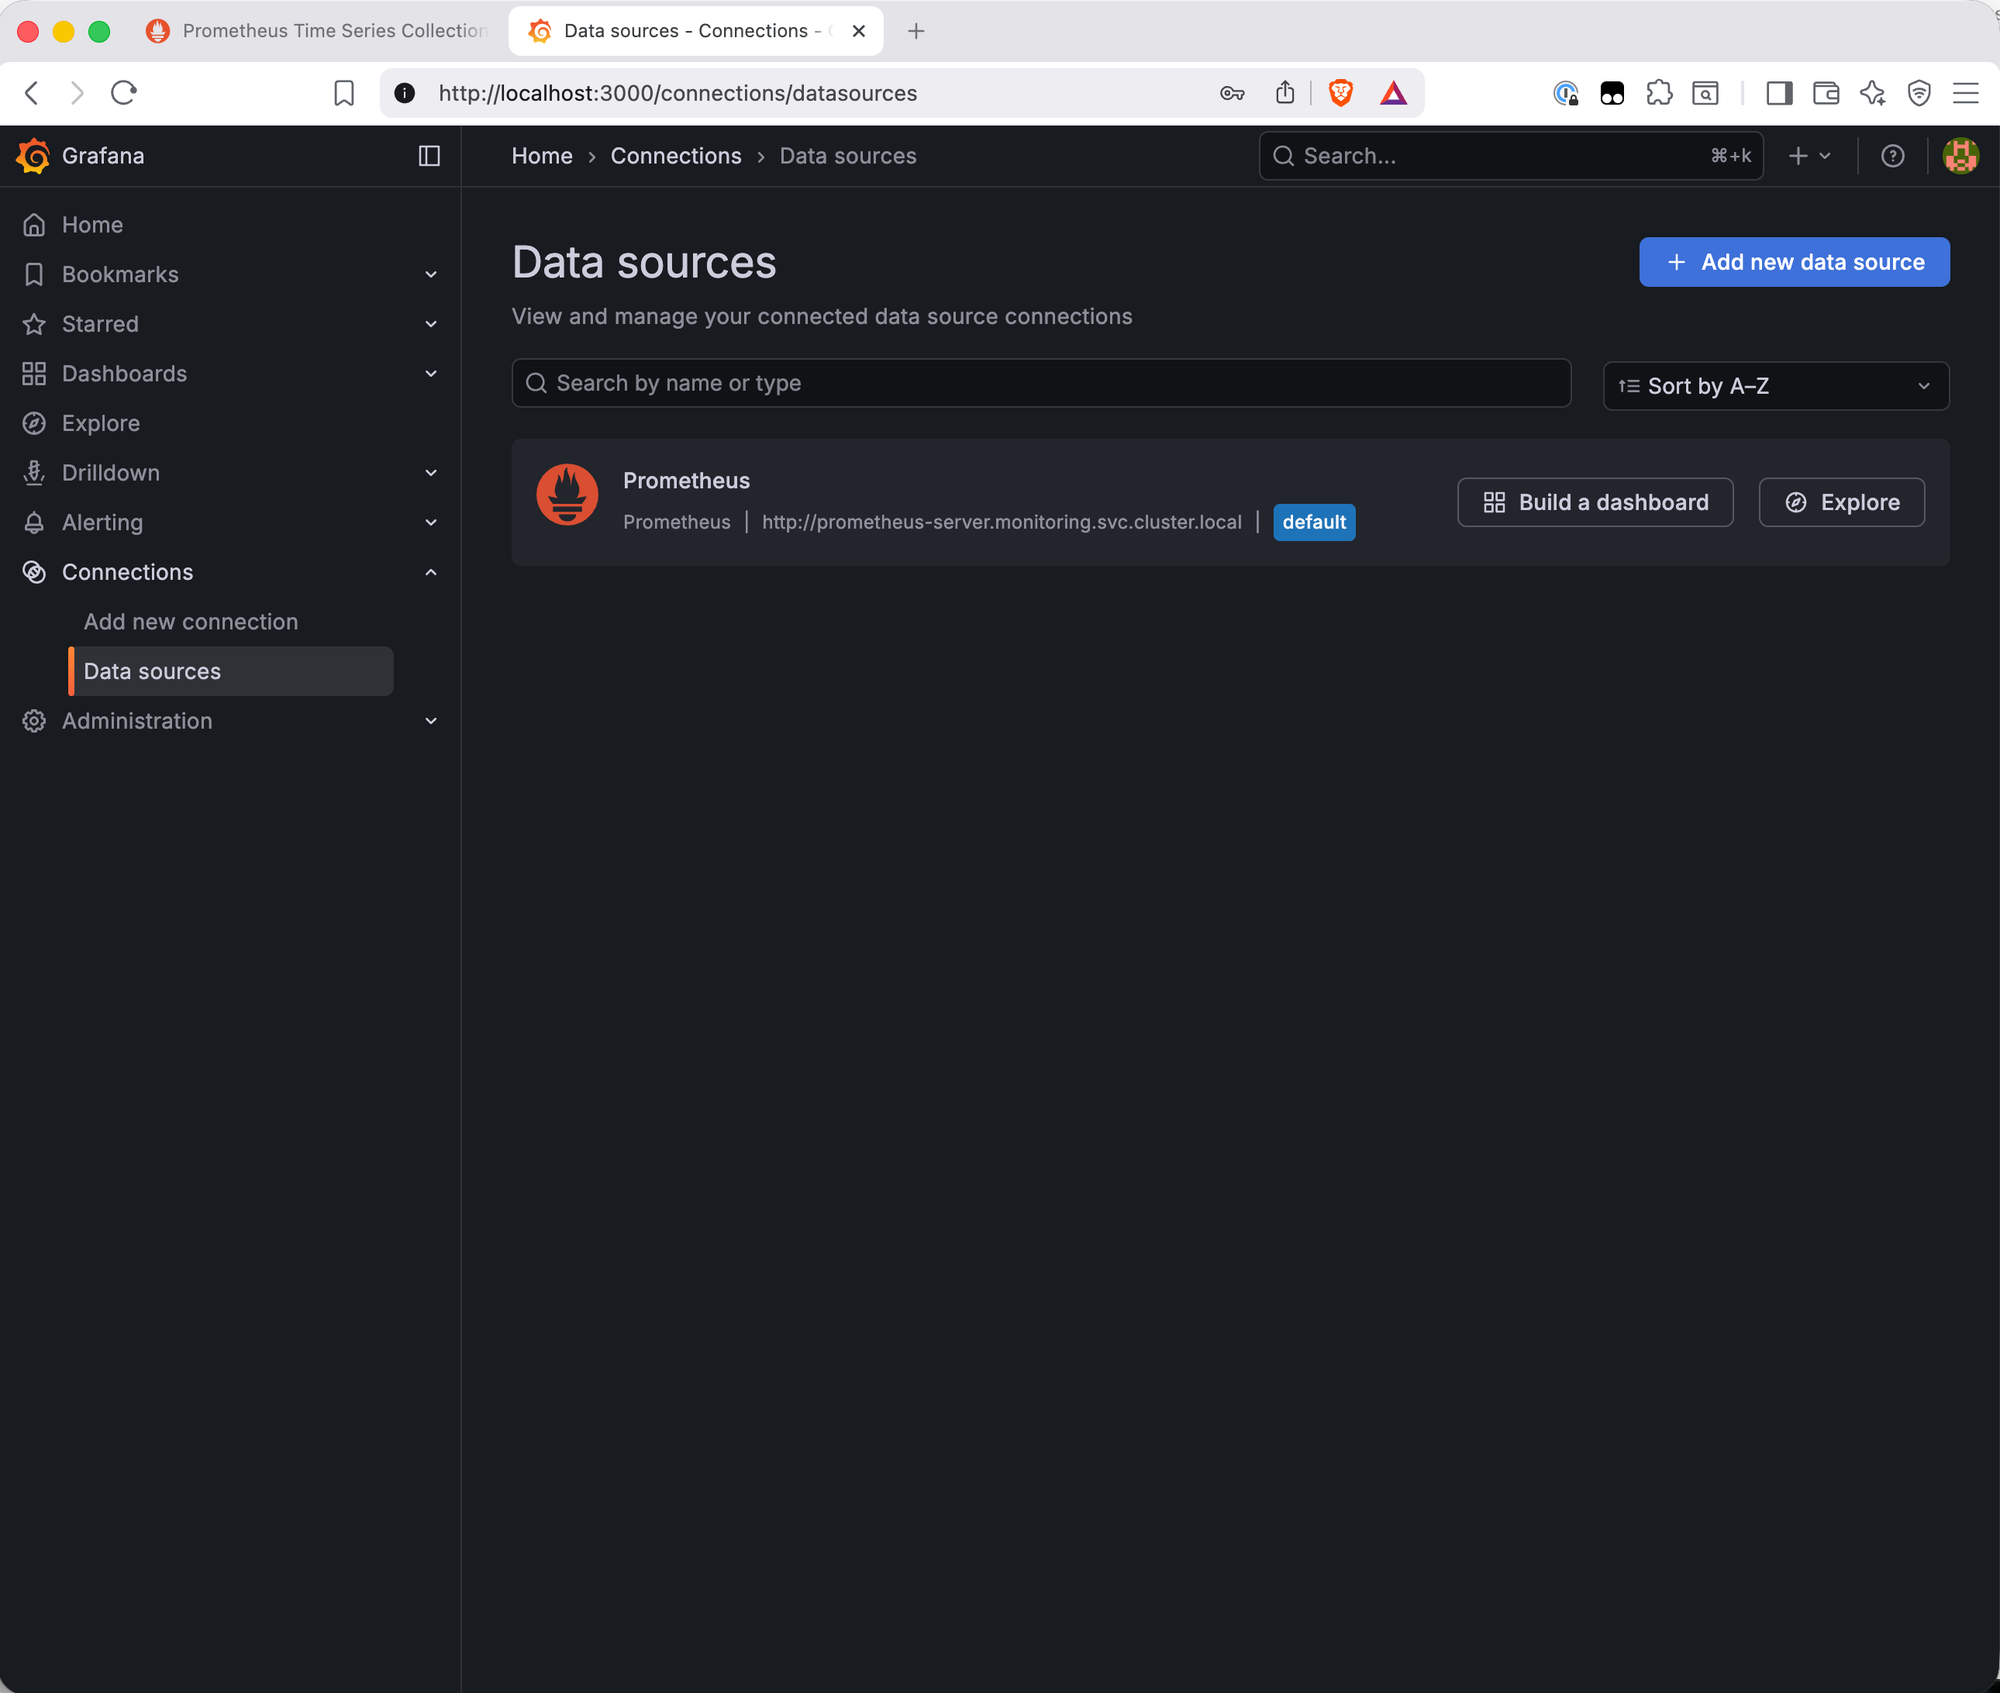
Verifying the Data Source
Go to Connections → Data Sources. Prometheus is already listed as the default data source — the values file did its job.
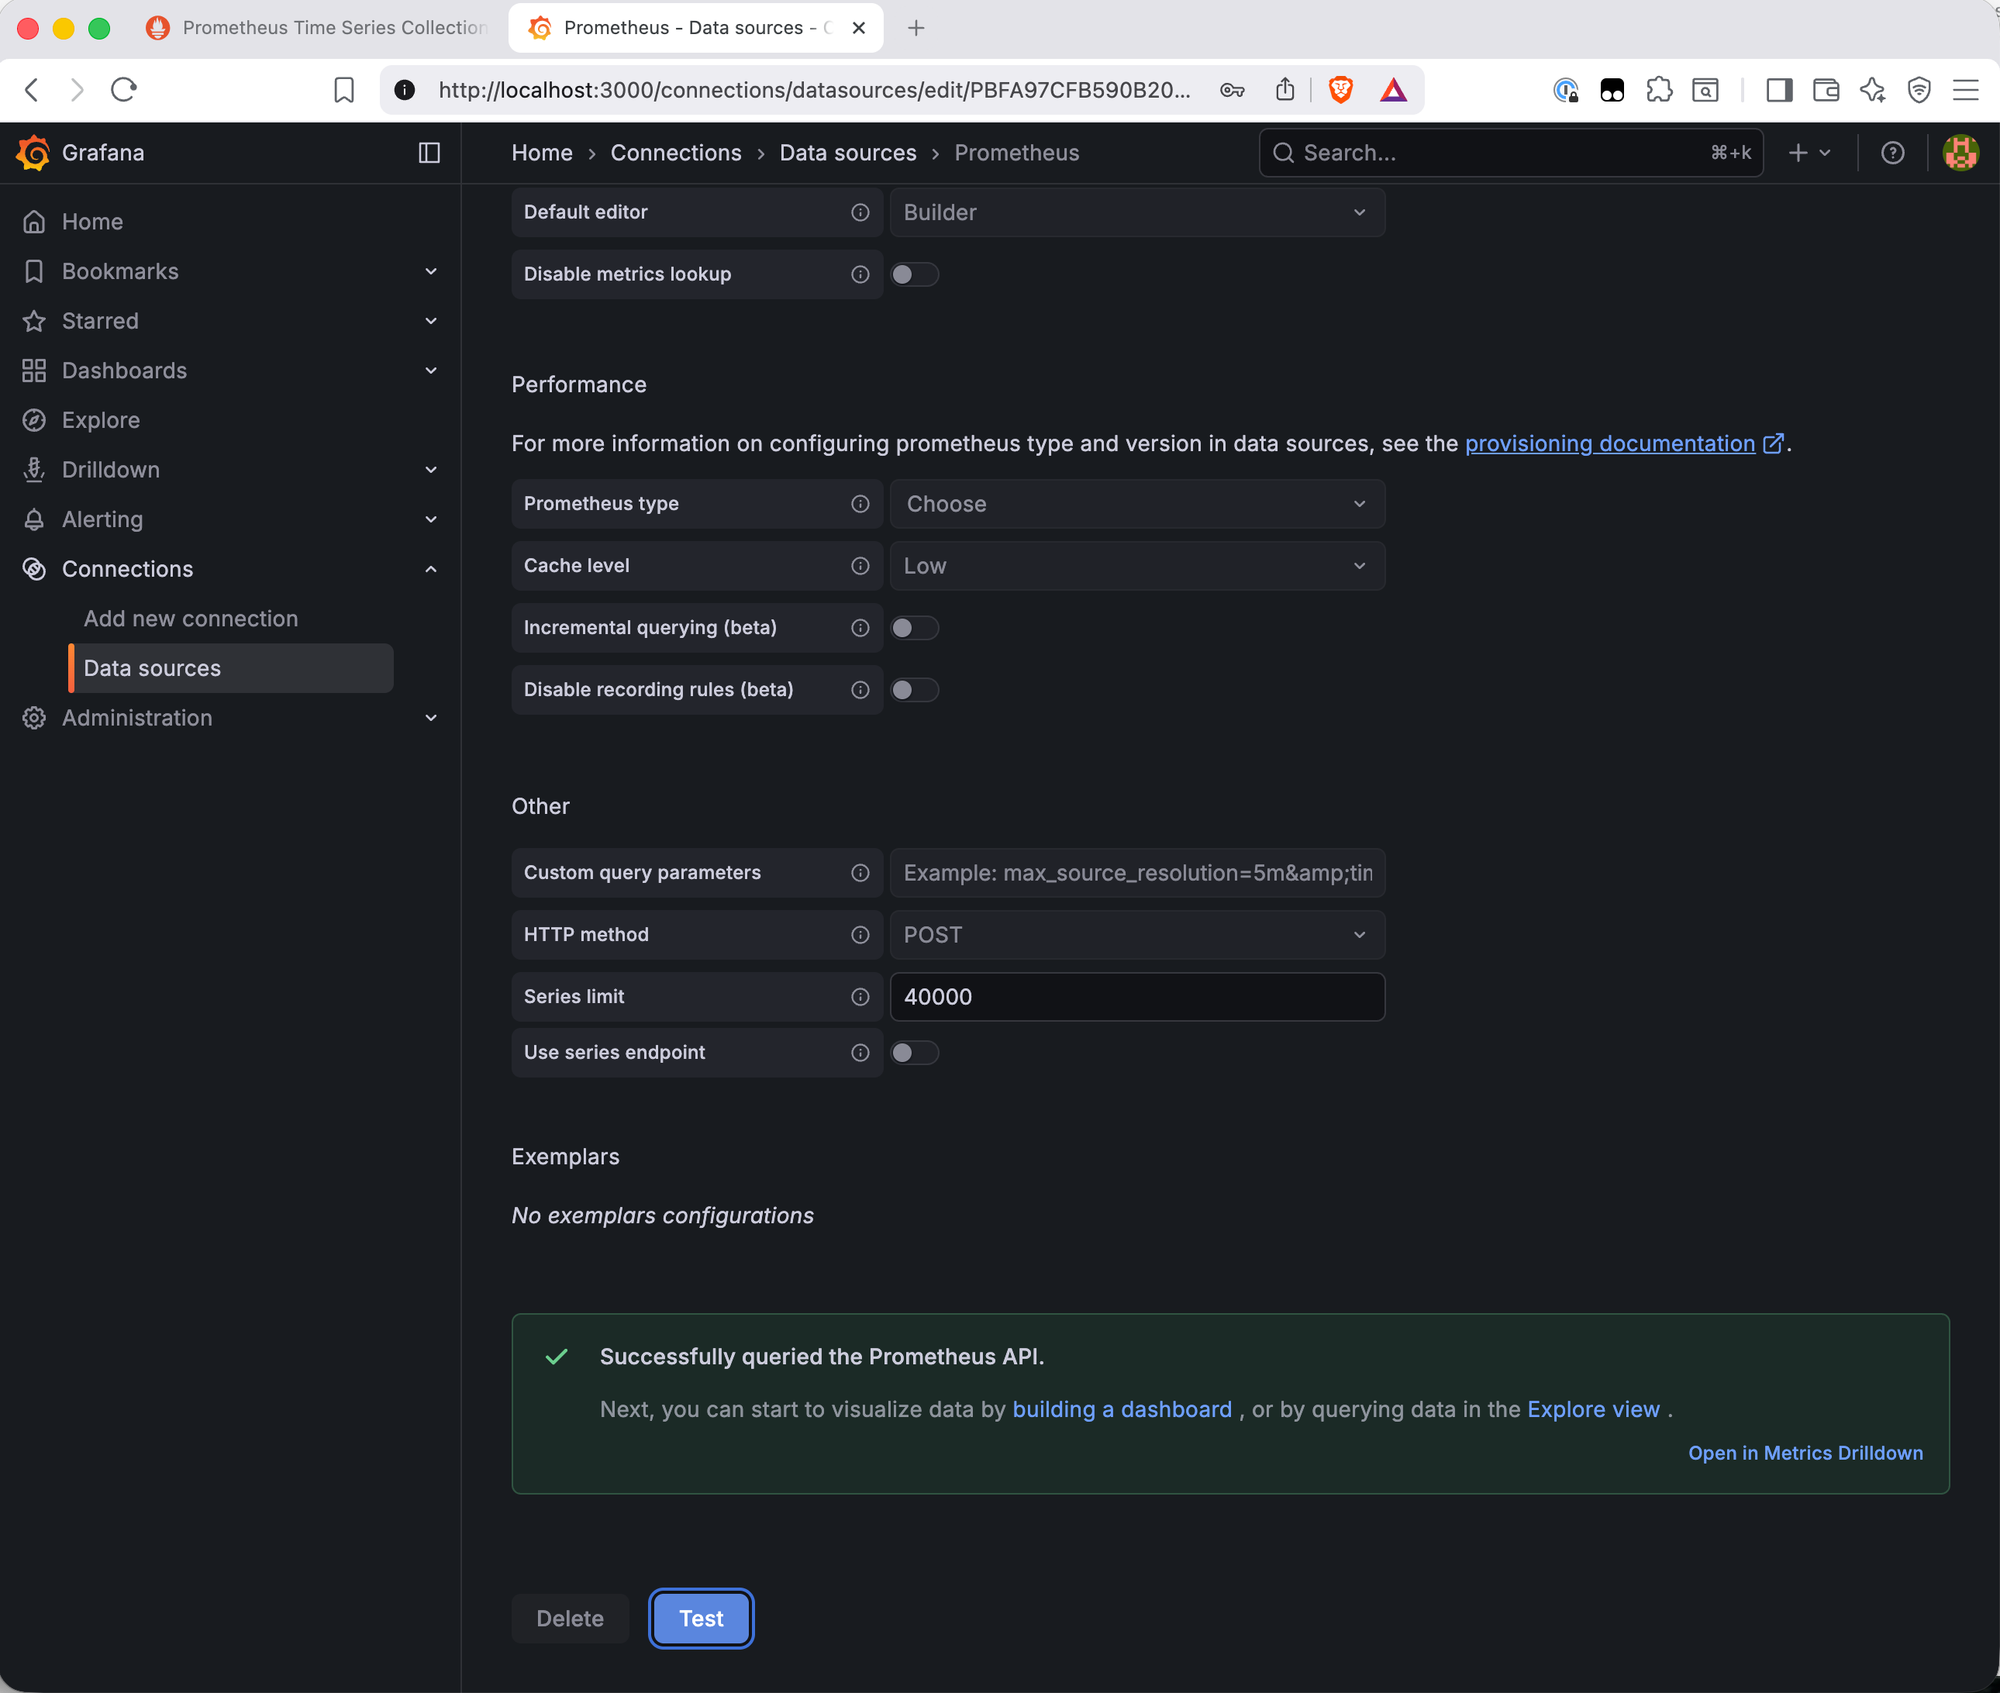
Click the Prometheus entry and scroll to the bottom to hit Save & Test. A green "Successfully queried the Prometheus API" banner confirms the connection is live.
Importing the Node Exporter Full Dashboard
Grafana has a community dashboard library at grafana.com/grafana/dashboards. Dashboard 1860 — Node Exporter Full — is the standard starting point for node-level hardware monitoring. It covers CPU, memory, disk I/O, filesystem, and network for every node, with a node selector at the top to switch between them.
Go to Dashboards → New → Import. Enter 1860 in the "Import via grafana.com" field and click Load. The dashboard metadata loads from grafana.com — name, author, last updated. Click Import to bring it in.
The dashboard connects to the Prometheus data source automatically and renders immediately with live data.
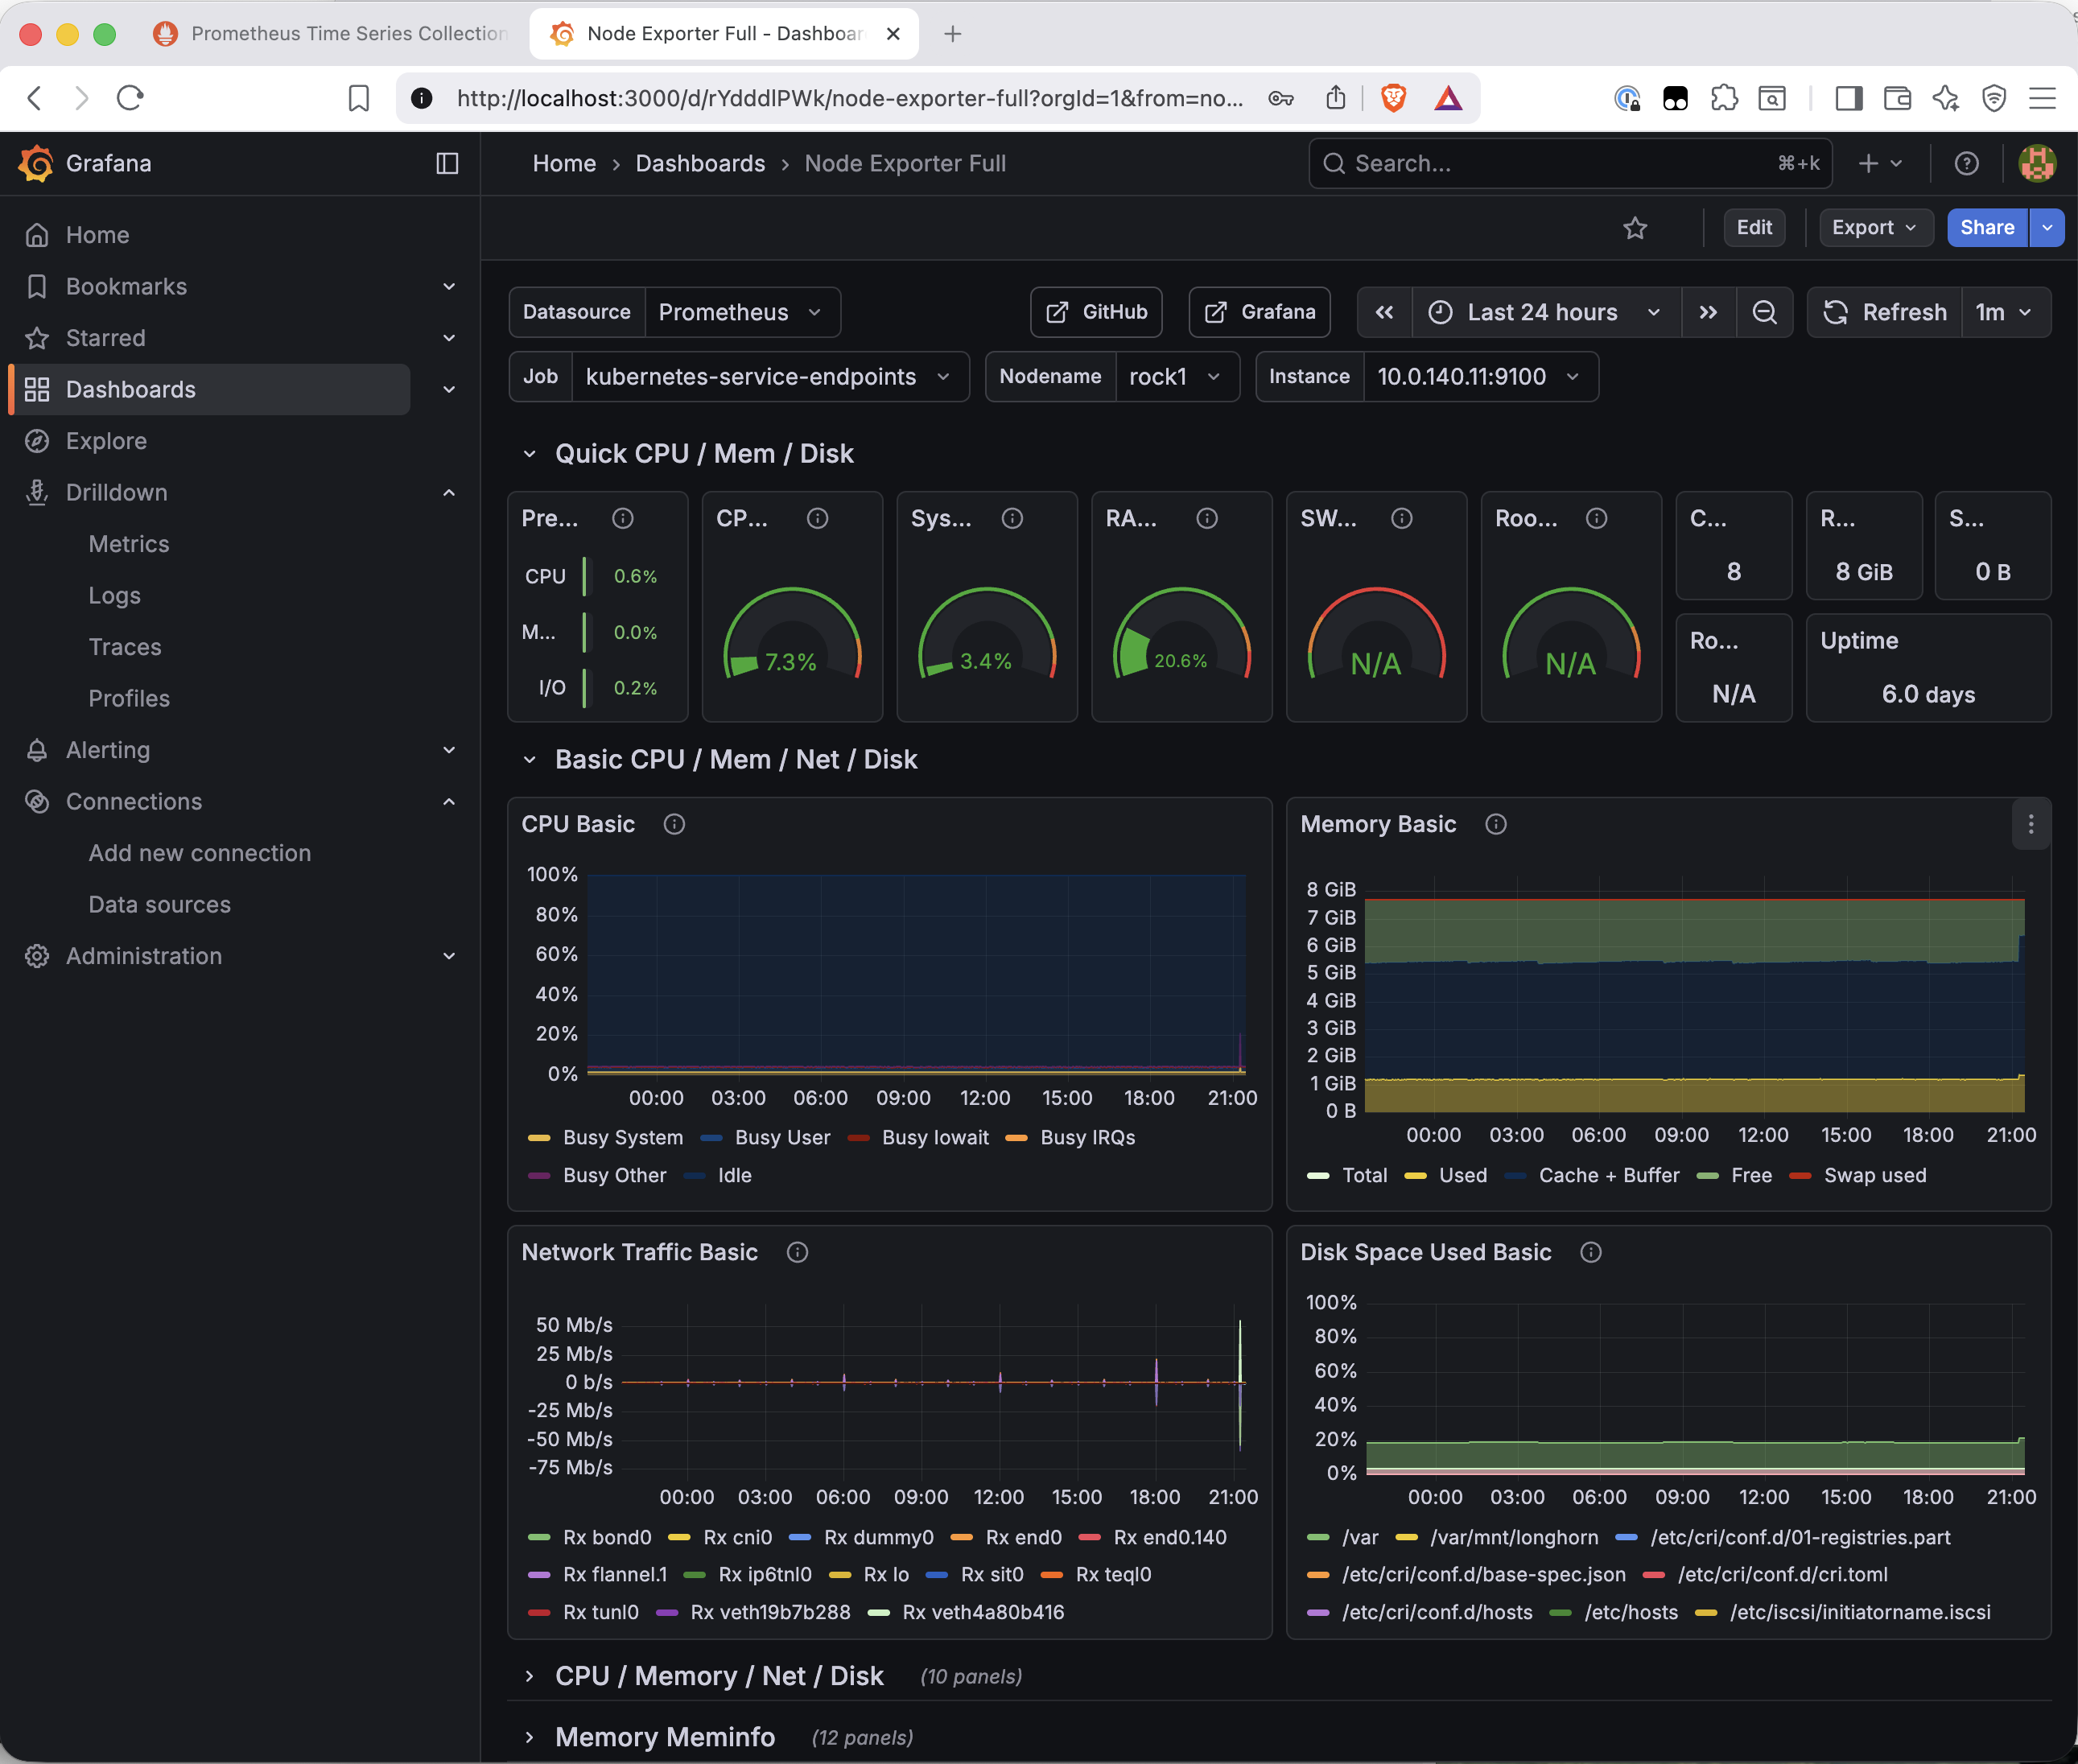
A few things worth pointing out in this dashboard. The node selector at the top lets you switch between rock1–rock4. The Job field shows kubernetes-service-endpoints rather than node-exporter — the dashboard auto-detected the job label via kube-state-metrics service endpoint discovery rather than the static scrape job name. The data is correct regardless; this is a label difference with no practical impact.
The disk space panel is particularly interesting — /var/mnt/longhorn appears alongside the system partitions, showing the NVMe mount that Longhorn uses for volume storage on each node. The cluster's storage layer is visible in its own monitoring dashboard.
What's Working Now
- ✅ Grafana deployed with a Longhorn-backed PVC
- ✅ Prometheus pre-configured as the default data source via in-cluster DNS
- ✅ Data source connection verified — Prometheus API queried successfully
- ✅ Node Exporter Full dashboard (ID 1860) imported and showing live data
- ✅ All four nodes selectable in the dashboard node selector
What's Next
Grafana and Prometheus are both accessed via port-forward — a kubectl command that needs to be running in a terminal for the UI to be reachable. That's fine for occasional use, but it's not how a monitoring stack should work long-term. The next post adds MetalLB and ingress-nginx: MetalLB assigns a real IP from VLAN 140 to the cluster's load balancer, and ingress-nginx routes HTTP traffic to services by hostname. Grafana gets a proper URL. No more port-forwarding.
← Previous: Prometheus and Node Exporter
→ Next: MetalLB and ingress-nginx
Questions or suggestions? Leave a comment below or reach out at igor@vluwte.nl.