Cluster Observability Part 5: Hardware Health Collectors - ZFS, SMART, and Thermal
Adding ZFS, SMART, and thermal collectors to the Bletchley cluster — and three ARM64 image attempts before finding one that actually works.
Introduction
After Part 4, the Bletchley cluster has solid alerting on the things Prometheus could already see: filesystem usage, node availability, Longhorn volume health, pod restarts, network saturation. What it cannot see is the physical layer underneath all of that. Whether the ZFS mirror pool on rock3 is degraded. Whether any NVMe or SATA drive has accumulated reallocated sectors or is wearing out. Whether the RK3588 SoCs are running hot under sustained load.
These are silent failure modes. A degraded ZFS mirror typically keeps the system running, but it reduces redundancy and can impact performance or expose latent read errors. SMART errors often don’t affect performance directly, and failures can still appear sudden in practice — even when warning signals were present. The only way to catch these early is to instrument them, and none of that data was in Prometheus yet.
This post covers the three additions that close that gap: extending Node Exporter with ZFS and hardware thermal metrics, deploying a SMART exporter as a privileged DaemonSet, and adding a Garage scrape job. The Talos Linux constraint — immutable OS, no SSH, no package manager — shapes how each of these is done. And the ARM64 constraint adds a layer of friction that the SMART exporter makes very visible.
This post is part of the Observability sub-series.
- Part 1: Prometheus and Node Exporter
- Part 2: Grafana Dashboards
- Part 3: Dashboards for Storage and Kubernetes
- Part 4: Alerting with Prometheus and Alertmanager
🏠 This is part of the Homelab Journey series - building a production Kubernetes cluster from scratch.
- Closing the Backup Loop
- Cluster Observability Part 5: Hardware Health Collectors — ZFS, SMART, and Thermal (you are here)
This post assumes Prometheus, Node Exporter, and Alertmanager are already running on the cluster. If you are starting from scratch, Part 1 covers the initial setup.
The Talos Constraint
On a standard Linux box, adding SMART monitoring is a one-liner: apt install smartmontools. On Talos Linux it is not. The OS is immutable — there is no package manager, no SSH, no way to install software on the host. Everything runs in containers.
This changes the approach for any collector that needs privileged host access. Instead of installing a tool on the node, you deploy a container with access to the host's kernel interfaces or block devices, and the tool runs inside that container. The container gets /dev via a hostPath volume mount and does its own queries from there. The Talos host never needs to have anything installed.
Running a privileged container on Talos requires the namespace to allow it. Kubernetes enforces pod security at the namespace level — by default, namespaces use the restricted profile which blocks privileged containers, hostPath mounts, and containers running as root. The monitoring namespace was labelled pod-security.kubernetes.io/enforce=privileged in Part 1 to allow Node Exporter's hostNetwork and hostPID requirements. That same label is what permits the smartctl DaemonSet to run with access to /dev. Without it, the pod would be rejected before it even tries to start — not an image pull error, not a runtime error, just a policy violation at admission.
Node Exporter: ZFS and Thermal Metrics
Node Exporter has built-in collectors for ZFS kernel stats and hardware monitoring sensors — --collector.zfs and --collector.hwmon. The first step was checking whether these were already active.
kubectl -n monitoring get daemonset node-exporter-prometheus-node-exporter -o yaml | grep -A 30 args
The args list showed only the path flags set by the chart — no --collector.zfs, no --collector.hwmon. The assumption going in was that both needed to be explicitly enabled.
Before adding them, one more thing to verify: whether /proc/spl/kstat/zfs/ — the kernel path the ZFS collector reads from — was accessible inside the Node Exporter pod on rock3.
kubectl -n monitoring exec \
  $(kubectl -n monitoring get pod -l app.kubernetes.io/name=prometheus-node-exporter \
    --field-selector spec.nodeName=rock3 -o name) \
  -- ls /host/proc/spl/kstat/zfs/
It returned the full ZFS stats tree: arcstats, datapool, vdev_mirror_stats, zil, and more. The existing /host/proc mount that Node Exporter already has is sufficient — no extra hostPath configuration needed. The zfs-exporter fallback that was in the plan was not needed.
With that confirmed, I added both flags to node-exporter-values.yaml and applied with helm upgrade. The DaemonSet rolled out node by node — rock3 took about 10 seconds longer than the others, consistent with the ZFS collector initialising on first start.
Then the surprise. Checking in Grafana, ZFS ARC data was already there — not just from after the upgrade, but going back weeks.
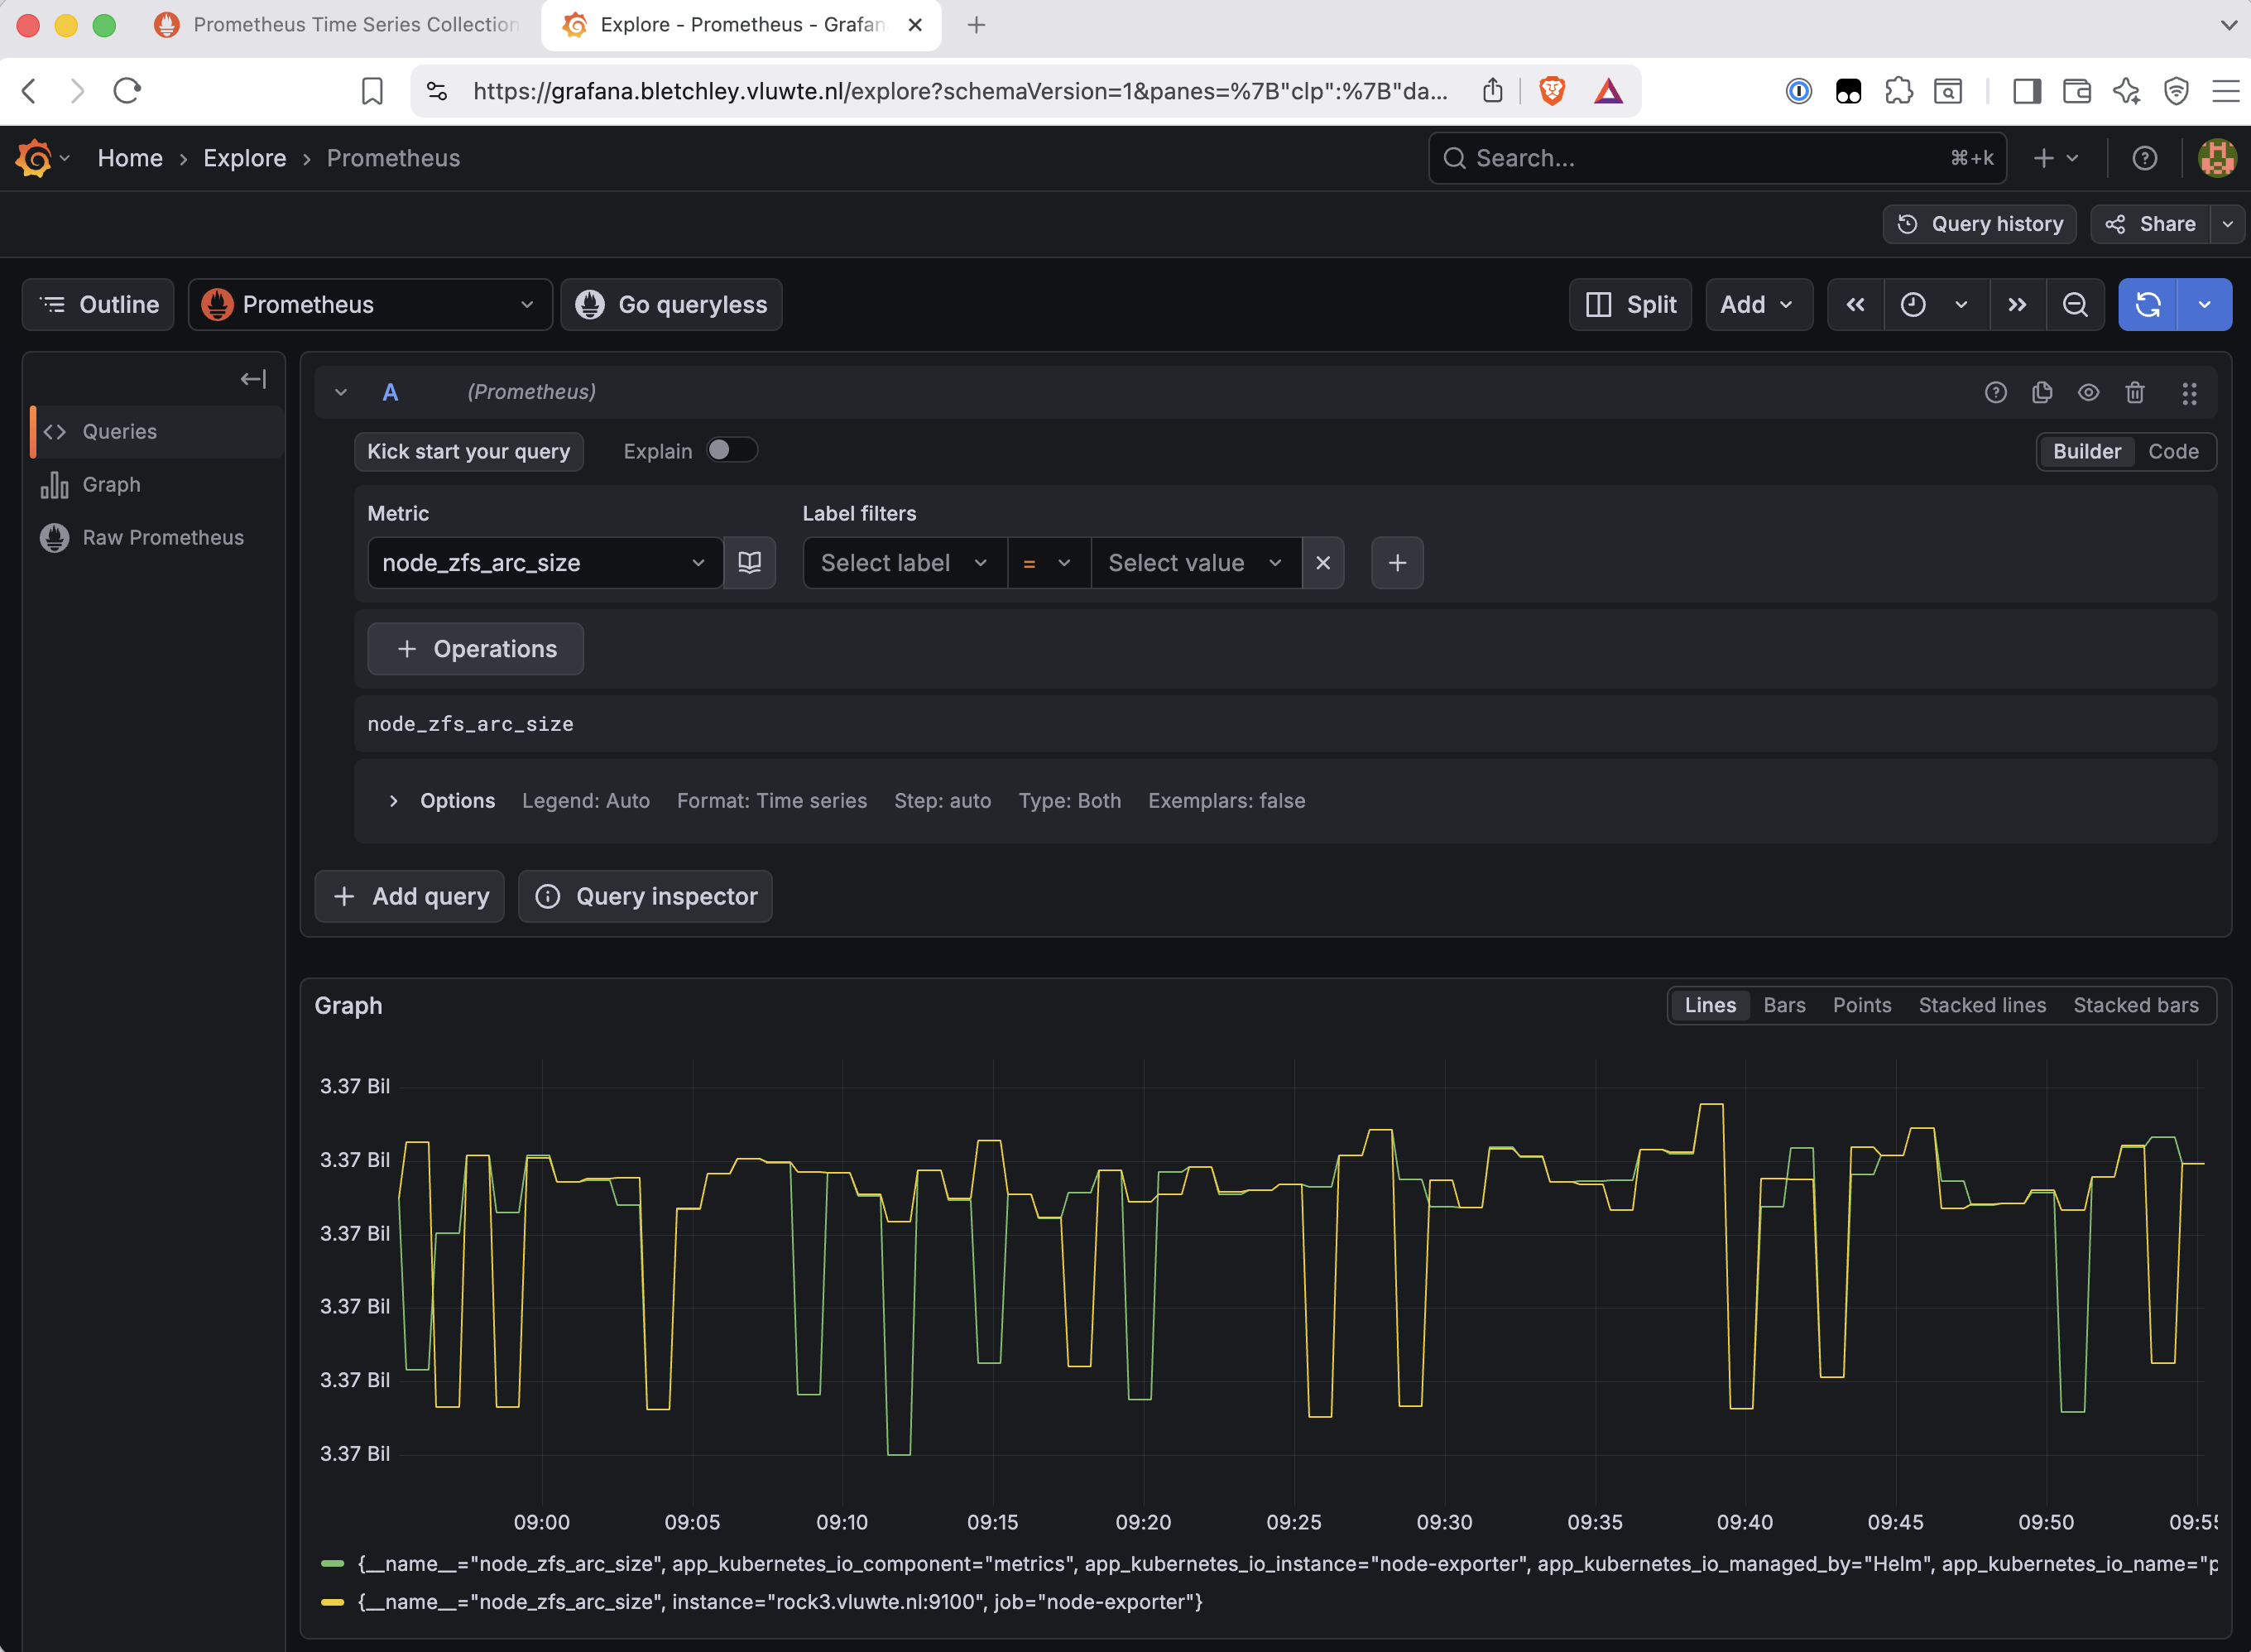
The reason: both collectors are default enabled in Node Exporter v1.10.2.
kubectl -n monitoring exec \
  $(kubectl -n monitoring get pod -l app.kubernetes.io/name=prometheus-node-exporter \
    --field-selector spec.nodeName=rock3 -o name) \
  -- /bin/node_exporter --help 2>&1 | grep zfs
# --[no-]collector.zfs       Enable the zfs collector (default: enabled).
The flags were not in the args list because you only see flags that differ from their defaults. The collectors were already running. The extraArgs additions were redundant — not harmful, and kept as explicit documentation of intent, but they changed nothing functionally.
The lesson: check the defaults before assuming a flag needs enabling. The absence of a flag from the args list does not mean the feature is off.
Non-ZFS nodes: all four nodes log msg=zfs at startup — that is just the collector registration line, not an error. A quick check with stern confirmed INFO level only, one line per node. On rock1, rock2, and rock4, the ZFS collector runs silently and produces no data.
Deploying smartctl_exporter
The SMART exporter is where things got interesting. The plan was to use the prometheus-community/prometheus-smartctl-exporter Helm chart and work through the image fallback options if needed.
Attempt 1: Default chart image
helm install smartctl-exporter prometheus-community/prometheus-smartctl-exporter \
  --namespace monitoring \
  --version 0.16.0
All four pods landed in ImagePullBackOff within seconds. The official quay.io/prometheuscommunity/smartctl-exporter image dropped ARM64 support after v0.7.0 — there is no linux/arm64 manifest in the current image. Expected, but confirmed.
smartctl-exporter-prometheus-smartctl-exporter-0-9gflw   0/1     ImagePullBackOff   0          75s
smartctl-exporter-prometheus-smartctl-exporter-0-pxvvn   0/1     ImagePullBackOff   0          75s
smartctl-exporter-prometheus-smartctl-exporter-0-s8bgs   0/1     ImagePullBackOff   0          75s
smartctl-exporter-prometheus-smartctl-exporter-0-wdcpv   0/1     ImagePullBackOff   0          75s
Uninstalled, moved to option B.
Attempt 2: linux-arm64 tag
There is a separate image specifically for ARM64: quay.io/prometheuscommunity/smartctl-exporter-linux-arm64:master. Created smartctl-exporter-values.yaml:
# apps/monitoring/prometheus/smartctl-exporter-values.yaml
image:
  repository: quay.io/prometheuscommunity/smartctl-exporter-linux-arm64
  tag: master
The image pulled. All four pods reached 1/1 Running. But then:
kubectl -n monitoring exec smartctl-exporter-prometheus-smartctl-exporter-0-2rtjz \
  -- smartctl --scan
# exec /usr/sbin/smartctl: exec format error
exec format error on the binary itself — the image pulled cleanly for ARM64, but the manifest for prometheuscommunity/smartctl-exporter-linux-arm64:master declares ARCH=amd64. The name says ARM64, the manifest says otherwise. Option B fails for a subtler reason.
Attempt 3: matusnovak/prometheus-smartctl
The third option from the planning file: matusnovak/prometheus-smartctl, which explicitly lists linux/arm64/v8 support. Checked the GitHub repo — v2.5.0 is the latest release. Updated the values file:
# apps/monitoring/prometheus/smartctl-exporter-values.yaml
image:
  repository: matusnovak/prometheus-smartctl
  tag: v2.5.0
Reinstalled:
helm install smartctl-exporter prometheus-community/prometheus-smartctl-exporter \
  --namespace monitoring \
  --version 0.16.0 \
  --values ~/talos-cluster/bletchley/apps/monitoring/prometheus/smartctl-exporter-values.yaml
smartctl-exporter-prometheus-smartctl-exporter-0-256v9   1/1     Running             0          6s
smartctl-exporter-prometheus-smartctl-exporter-0-2rtjz   1/1     Running             0          6s
smartctl-exporter-prometheus-smartctl-exporter-0-s4hdb   1/1     Running             0          6s
smartctl-exporter-prometheus-smartctl-exporter-0-z7xgk   1/1     Running             0          6s
All four nodes, 1/1 Running, 6 seconds. Checked the logs:
stern -n monitoring smartctl-exporter --no-follow
Devices discovered on all nodes — Kingston NVMe on all four, two 960GB SATA SSDs on rock3, metrics flowing. Option C works.
ARM64 image debugging checklist
The three attempts above follow a pattern that applies to any ARM64 image problem:
ImagePullBackOff— no ARM64 manifest exists. The registry has no image for your architecture. Find a different image.- Pod reaches Running,
exec format error— the image pulled (there is an ARM64 manifest) but the binary inside is wrong architecture. The manifest lied, or the tag is mislabelled. Check the manifest directly:docker manifest inspect <image>:<tag>showsARCHper layer. Find a different image or tag. - Pod reaches Running, binary executes, returns 0 results — the image and binary are correct, but the container lacks access to what it needs (wrong mount, missing privilege, wrong device path). This is a configuration problem, not an image problem.
For smartctl-exporter-linux-arm64:master, checking the manifest on quay.io confirms ARCH=amd64 — the name is wrong, the binary is x86. That is why exec format error appeared despite the pod being healthy.
Two things to know about the matusnovak image
Different metric prefix. The official exporter uses smartctl_ as the metric prefix. matusnovak/prometheus-smartctl uses smartprom_. Every query and alert rule referencing SMART metrics needs to use smartprom_, not smartctl_.
Different port. The official exporter listens on port 9633. The matusnovak image listens on port 9902. The scrape job needs to match.
Adding the scrape job
With the pods running, the next step was adding the Prometheus scrape job. The job uses Kubernetes pod discovery to find the smartctl pods and scrape them.
A detail worth checking before writing the relabel rule: what labels does the chart actually put on the pods?
kubectl -n monitoring get pods -l app.kubernetes.io/name=prometheus-smartctl-exporter -o yaml \
  | grep "app.kubernetes.io/name"
# app.kubernetes.io/name: prometheus-smartctl-exporter
No plain app label — only app.kubernetes.io/name. Prometheus converts label names to meta labels by replacing . and / with _, so the source label is __meta_kubernetes_pod_label_app_kubernetes_io_name. In relabel_configs, Prometheus implicitly anchors regexes (^...$), so partial matches like smartctl-exporter do not match prometheus-smartctl-exporter.
The correct scrape job in prometheus-values.yaml:
extraScrapeConfigs: |
  - job_name: longhorn
    # ... existing longhorn job unchanged ...

  - job_name: smartctl
    kubernetes_sd_configs:
      - role: pod
    relabel_configs:
      - source_labels: [__meta_kubernetes_pod_label_app_kubernetes_io_name]
        action: keep
        regex: prometheus-smartctl-exporter
      - source_labels: [__meta_kubernetes_pod_ip]
        target_label: __address__
        replacement: '$1:9902'
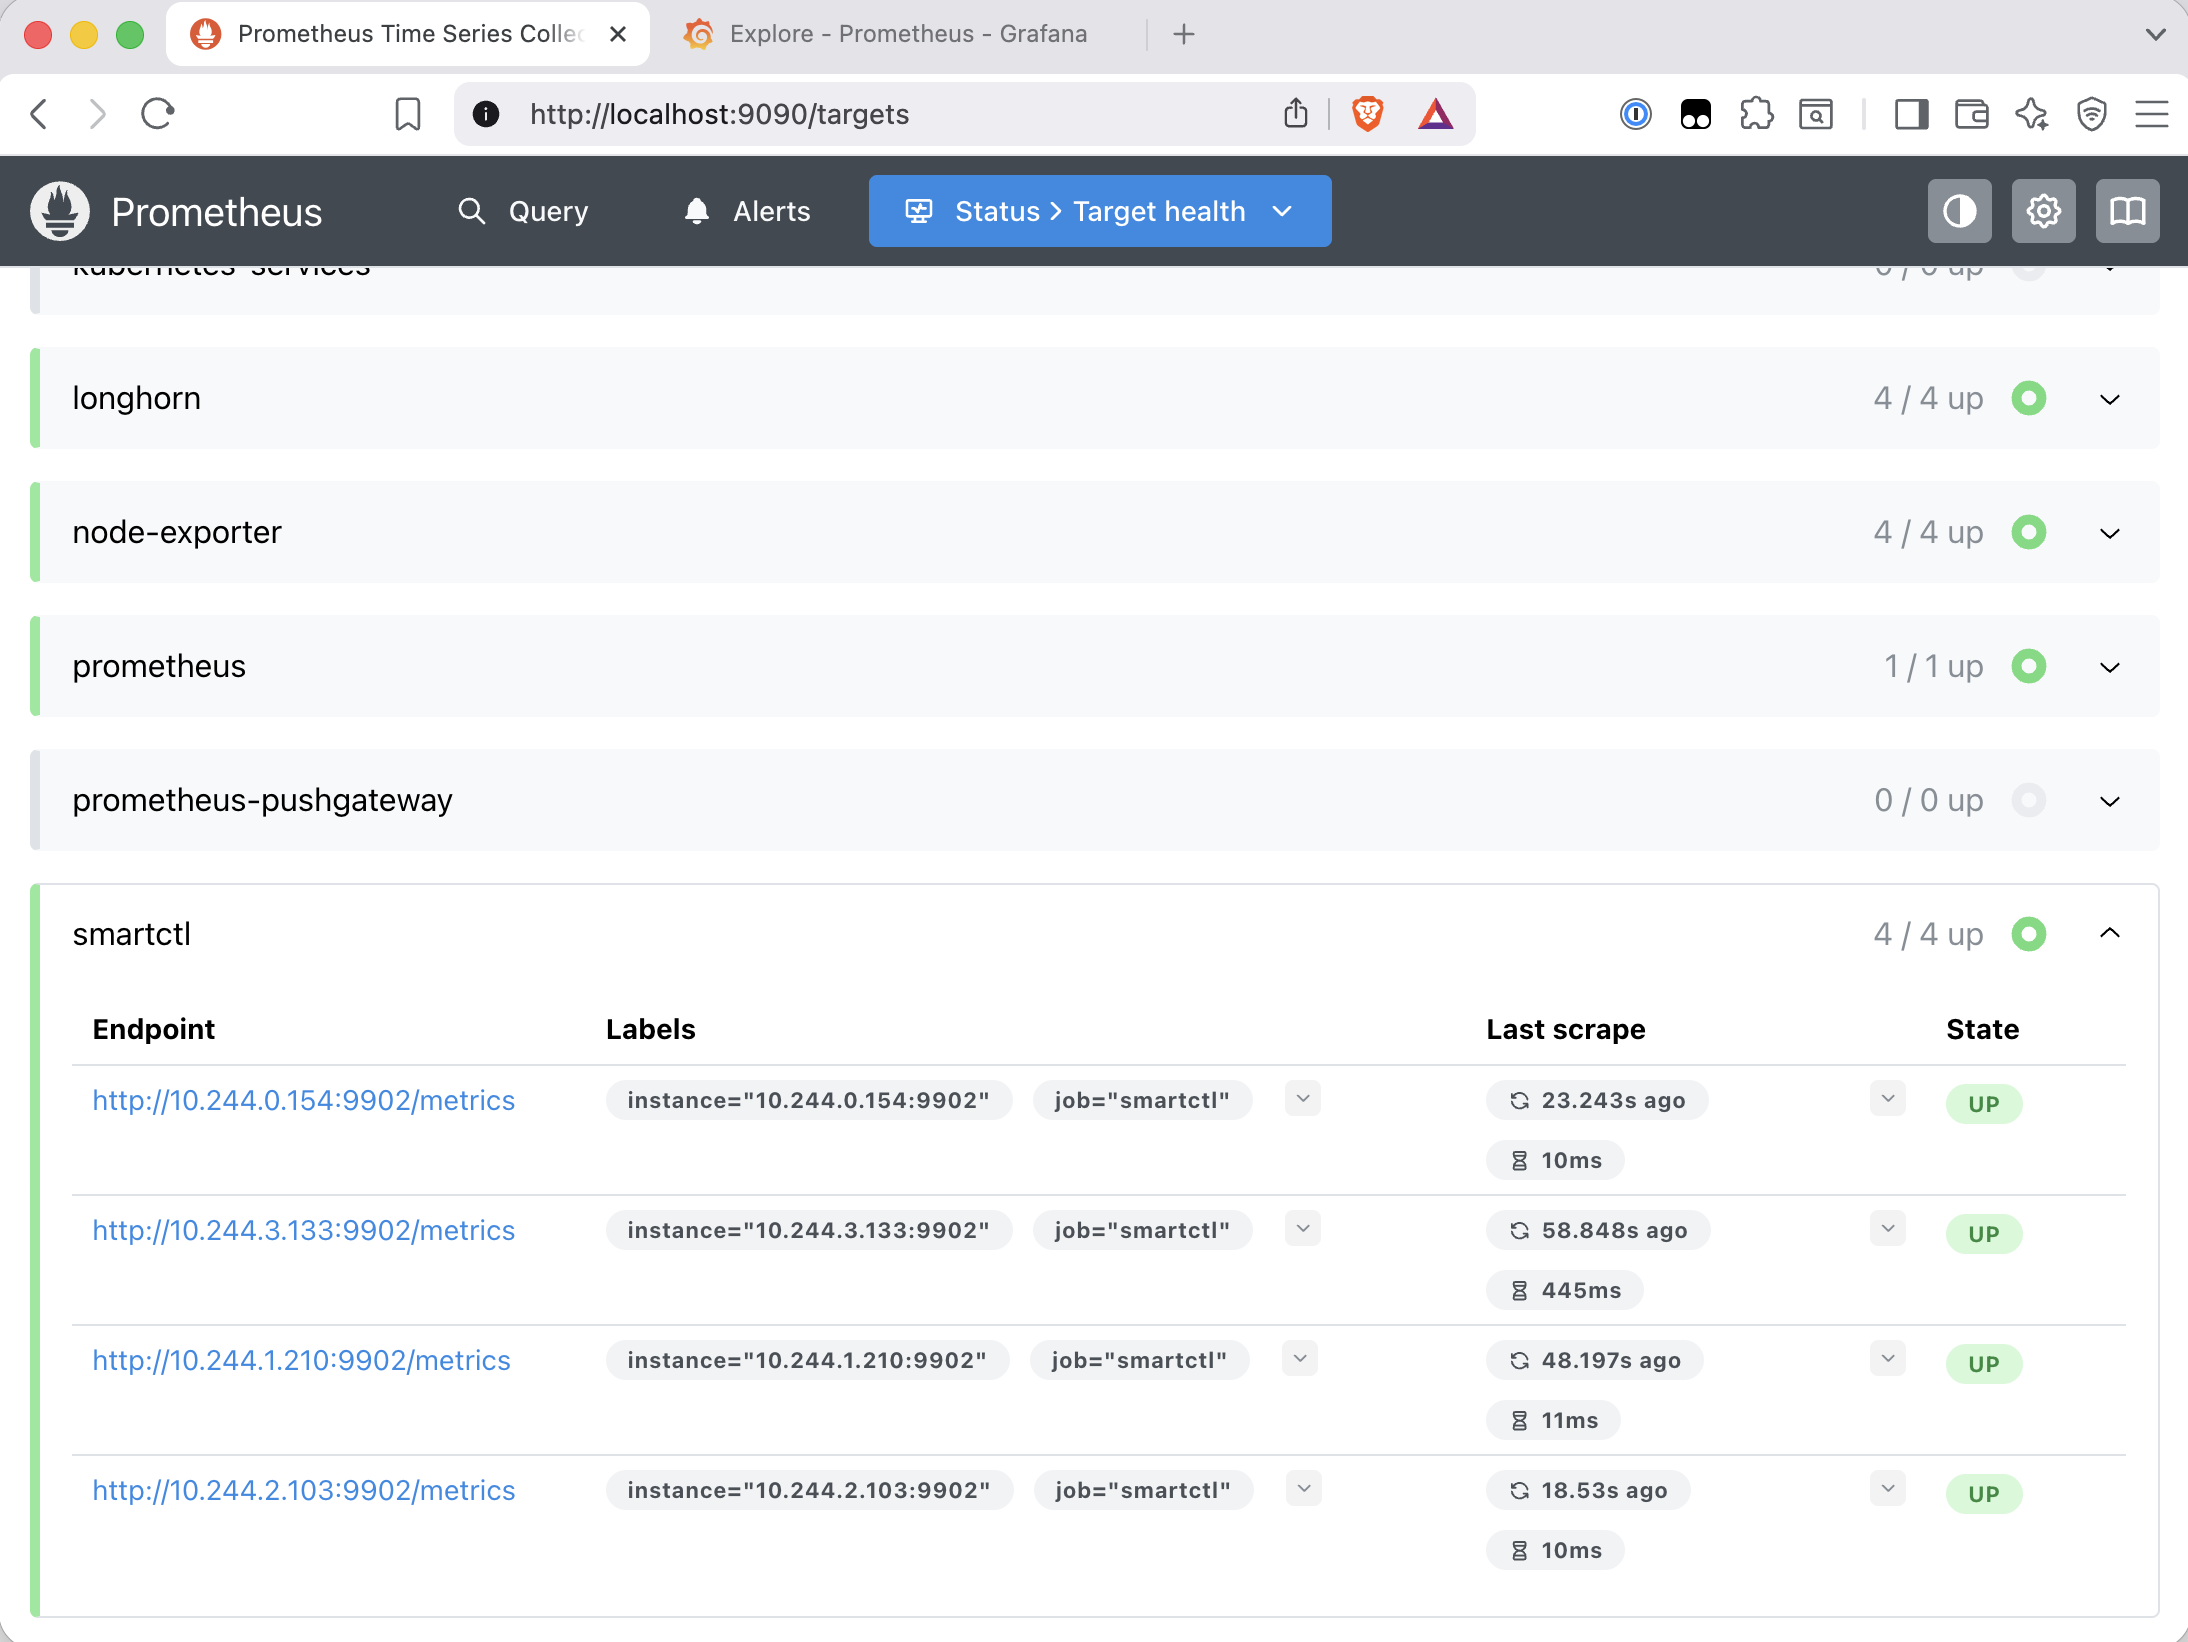
Applied with helm upgrade. Checked the targets page:
The virtual device noise
With metrics flowing, smartprom_smart_passed shows results for more devices than expected — real drives plus a set of scsi type devices with serial numbers beaf11, beaf21, beaf31 appearing across multiple nodes.
These are virtual block devices — TuringPi BMC virtual storage or Longhorn block devices. They pass SMART checks but are not real physical drives and should be excluded from health alerting. The type label distinguishes them: real drives have type="nvme" or type="sat", virtual devices on Bletchley have type="scsi". Alert rules in Part 6 will filter with type!="scsi".
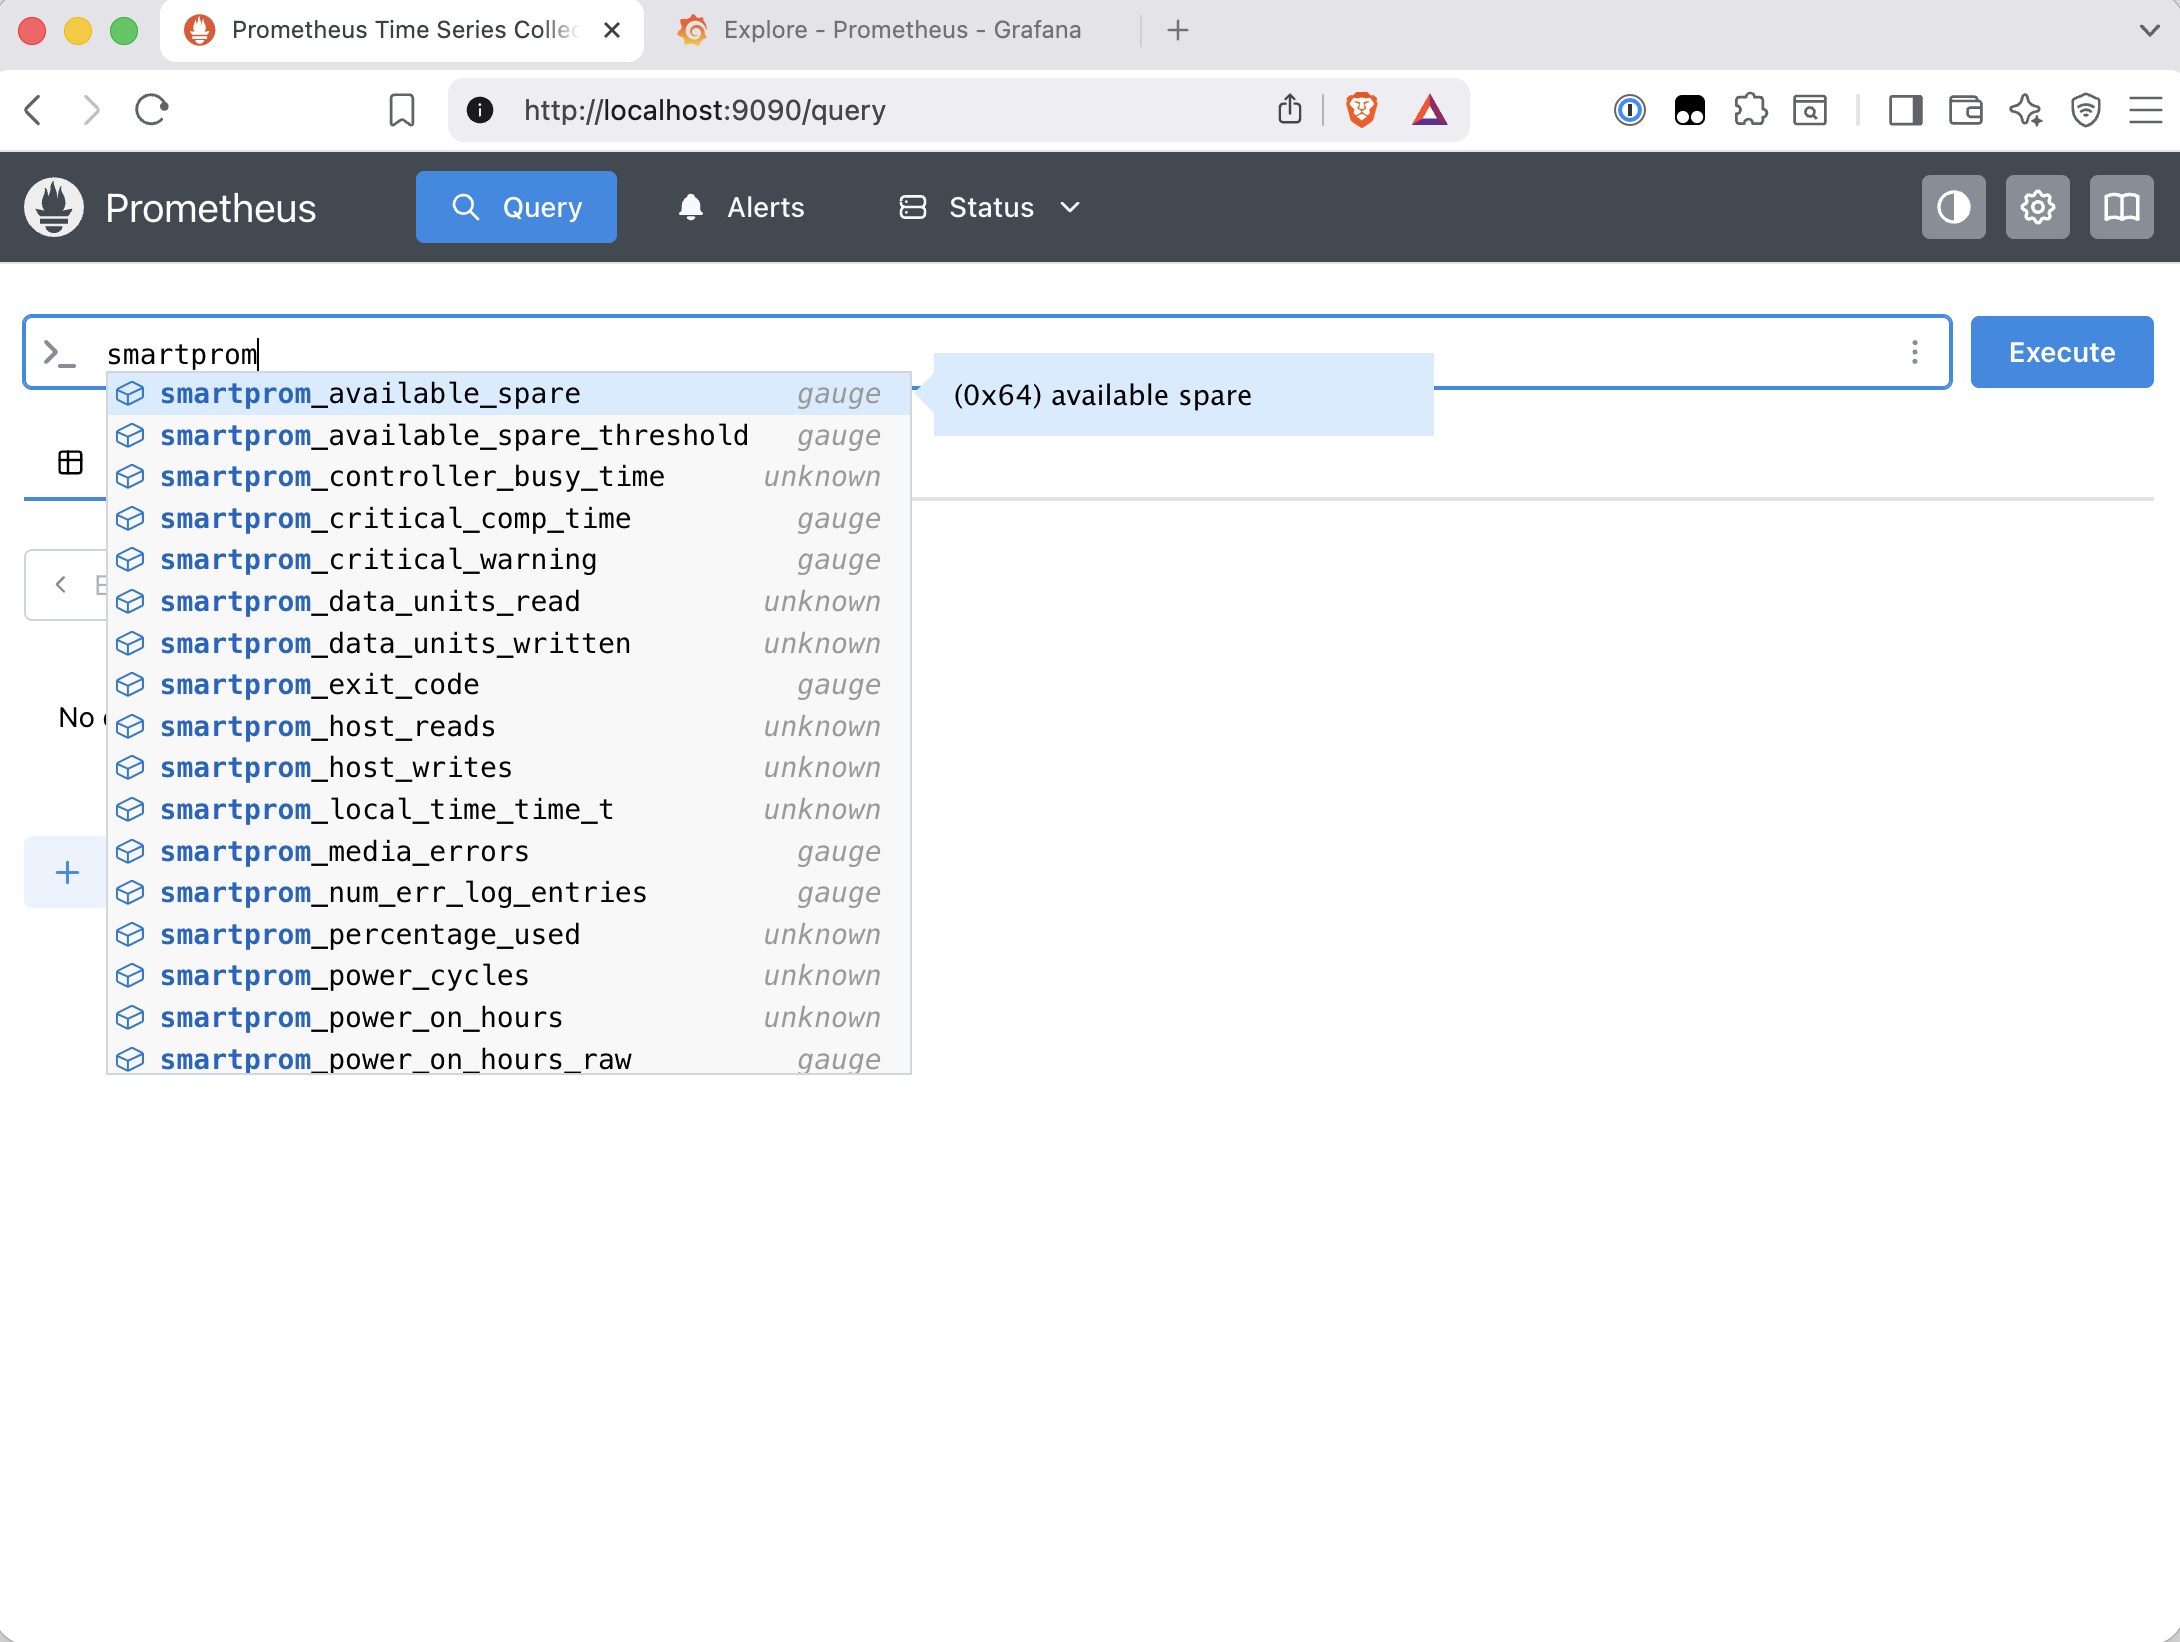
The real drives all report smartprom_smart_passed=1:
Adding the Garage Scrape Job
Not all metrics come from exporters — some systems expose Prometheus endpoints directly, making integration much simpler. Garage exposes a Prometheus-compatible metrics endpoint on port 3903. Adding a scrape job is a straightforward config change — no new component needed.
extraScrapeConfigs: |
  # ... existing jobs ...

  - job_name: garage
    static_configs:
      - targets: ['garage.garage.svc.cluster.local:3903']
Note: use the garage headless service, not garage-s3. The garage-s3 service only exposes port 3900 (the S3 API).
After helm upgrade, the Garage metrics visible in Prometheus are:
garage_build_info— version and build metadatagarage_local_disk_avail— available disk space on the Garage data volumegarage_local_disk_total— total disk capacitygarage_replication_factor— current replication factor
Per-bucket usage metrics are not available — Garage exposes aggregate node-level disk stats, not per-bucket breakdowns via this endpoint. The quota alerting in Part 6 will use garage_local_disk_avail and garage_local_disk_total rather than a per-bucket metric.
What's Working Now
- ✅ Node Exporter ZFS collector active —
node_zfs_*metrics on rock3, silent no-op on other nodes - ✅ Node Exporter hwmon collector active —
node_hwmon_temp_celsiusreporting RK3588 thermal zones on all nodes - ✅
smartctl_exporterrunning as DaemonSet on all 4 nodes (matusnovak/prometheus-smartctl:v2.5.0) - ✅ SMART metrics (
smartprom_*) in Prometheus — Kingston NVMe on all nodes, 960GB SATA on rock3 - ✅ All real drives reporting
smartprom_smart_passed=1 - ✅ Garage scrape job UP — disk availability and capacity metrics in Prometheus
- ⚠️ Virtual SCSI devices (
beafserial numbers) appear in SMART results — filter withtype!="scsi"in alert rules - ⚠️ Instance labels on smartctl metrics are pod IPs, not node hostnames — address in Part 6
Lessons Learned
- Check defaults before assuming a flag is needed — both
--collector.zfsand--collector.hwmonare enabled by default in Node Exporter v1.10.2, but only produce metrics when the underlying kernel interfaces are present. The absence of a flag from the args list does not mean the collector is off. Always verify with--help | grep <flag>. - ARM64 image issues are not always obvious — the
linux-arm64image tag pulled successfully and the pod reached Running, but the binary inside was x86.exec format erroronly appeared when trying to execute something. A healthy pod is not proof the image is correct for your architecture. - Prometheus regex is anchored —
smartctl-exporterdoes not matchprometheus-smartctl-exporter. Always check the actual label values on the pods before writing a relabel rule. - Check pod labels before writing a scrape job — chart authors make different choices. Some use a plain
applabel, some useapp.kubernetes.io/name. The meta label name follows from the actual label, with.and/replaced by_. - Read the values file before installing — the port and metric prefix in the matusnovak image differ from the official exporter. Surprises like this are in the defaults if you look.
What's Next
With the collectors running, the data is in Prometheus but not yet visible at a glance or wired to alerts. Part 6 imports the community dashboards for SMART and ZFS health and writes the alerting rules — pool degradation, disk failures, NVMe wear, temperature thresholds, and Garage capacity. One thing to keep in mind going into that: NVMe and SATA drives expose different SMART attributes, so thresholds and metric names differ per device type. A rule written for NVMe percentage used does not apply to SATA drives, which use a different set of vendor-specific attributes. Part 6 handles that distinction when writing the rules.
← Previous: stern: Log Tailing
Questions or suggestions? Leave a comment below or reach out at igor@vluwte.nl.