Cluster Observability Part 4: Alerting with Prometheus and Alertmanager
Enabling Alertmanager on the Bletchley cluster: alerting rules, SMTP delivery, end-to-end testing, and two Talos-specific surprises.
Introduction
Dashboards show you what's happening when you're looking. Alerts tell you when you're not.
Parts 1 through 3 of this series built out the visibility layer: Prometheus collecting metrics from all four nodes, Node Exporter scraping hardware and filesystem data, and Grafana dashboards for Longhorn storage, Kubernetes health, and network usage. It's a solid foundation. But a cluster you have to actively watch is not a monitored cluster. A filesystem at 95% capacity might go unnoticed for days and a pod in CrashLoopBackOff will restart every few minutes without intervention.
Alertmanager is the missing piece. It receives firing alerts from Prometheus and routes them to notification channels - in this case, email. Combined with a set of well-chosen alerting rules, it means the cluster tells you when something is wrong rather than waiting to be checked. This post walks through enabling Alertmanager, writing the first alerting rules, and verifying end-to-end delivery through a structured set of tests.
There were a few surprises along the way - including a Talos-specific limitation around filesystem metrics and a wrong metric name in the Longhorn documentation - both of which are worth understanding before writing your own rules.
🏠 This is part of the Homelab Journey series - building a production Kubernetes cluster from scratch.
- Cluster Observability Part 3
- Cluster Observability Part 4: Alerting with Prometheus and Alertmanager (you are here)
This post assumes Prometheus and Grafana are already running on the cluster. If you're starting from scratch, check out Cluster Observability Part 1 first.
Why Dashboards Alone Aren't Enough
The Grafana dashboards from Part 3 are useful reference points. When you're actively investigating something - checking why a node is slow, looking at Longhorn replication lag, reviewing network throughput - they're exactly what you want. But they're reactive by nature. You have to be looking.
Most real problems don't announce themselves at a convenient moment. A volume filling up, a node exporter going silent, a deployment slowly failing - these happen in the background. Without alerting, the feedback loop is manual: check the dashboards, notice the problem, respond. With alerting, the cluster tells you.
The good news is that everything needed to implement alerting is already in place. Prometheus has been collecting the right metrics since Part 1. Alertmanager is included in the prometheus-community/prometheus Helm chart - it just needs to be enabled. No new exporters, no new data sources. This is configuration work on top of an existing foundation.
Enabling Alertmanager
Alertmanager ships disabled in the Helm chart. Enabling it requires updating prometheus-values.yaml and running helm upgrade.
The configuration covers four things: enabling the component, giving it persistent storage, telling it how to deliver notifications, and - as discovered during testing - making sure the config is in the right place in the values file.
The Values File
alertmanager:
  enabled: true
  persistence:
    enabled: true
    storageClass: longhorn
    size: 2Gi
    labels:
      backup.vluwte.nl/enabled: "true"
      backup.vluwte.nl/retain: "default"
      backup.vluwte.nl/full-backup-interval: "default"
      backup.vluwte.nl/concurrency: "default"
  config:
    global:
      smtp_smarthost: 'smtp.luwte.net:25'
      smtp_from: 'alerts@vluwte.nl'
      smtp_require_tls: false
    route:
      receiver: email
      group_by: ['alertname', 'instance']
      group_wait: 30s
      group_interval: 5m
      repeat_interval: 3h
    receivers:
      - name: email
        email_configs:
          - to: 'igor@vluwte.nl'
  extraArgs:
    web.external-url: "https://alertmanager.bletchley.vluwte.nl"
A few things worth explaining here.
The PVC labels follow the cluster's backup labelling convention (backup.vluwte.nl/*). This is consistent with every other Longhorn-backed PVC on the cluster - the backup automation uses these labels to drive scheduled backups. Even a small 2Gi volume gets labelled correctly from the start.
The SMTP config uses smtp.luwte.net, the internal mail relay. The Bletchley nodes are whitelisted on this relay, so no credentials are needed. smtp_require_tls: false is appropriate here - this is an internal relay on a trusted VLAN, not an authenticated submission to an external provider. When authenticated SMTP is needed for a future service, the credentials will need to be stored as a Kubernetes Secret - Sealed Secrets is the right solution for that, and it's on the roadmap.
Alert grouping controls how Alertmanager batches notifications. Without explicit grouping, all firing alerts are collected into a single group and delivered together. Grouping by alertname and instance means each alert type per node gets its own notification - a FilesystemAlmostFull on rock3 and a NodeDown on rock1 arrive as separate emails rather than one combined message. group_wait: 30s gives related alerts time to arrive before the first notification is sent. group_interval: 5m controls how long to wait before sending a follow-up if new alerts join an existing group. repeat_interval: 3h resends a still-firing alert every three hours as a reminder.
alertmanager.config - not alertmanagerFiles. This is the part that caused a problem during setup. The planning notes referenced alertmanagerFiles as the config location, which is correct for the older bundled Alertmanager approach. The current chart version uses a standalone Alertmanager subchart (alertmanager-1.33.1), and that subchart expects the configuration under alertmanager.config. Using alertmanagerFiles silently results in Alertmanager starting with a default empty config - no SMTP, no routes, nothing delivered. The configmap confirms what actually got applied; checking it early would have saved time.
extraArgs.web.external-url sets the URL that Alertmanager embeds in notification emails. Without it, the "View in Alertmanager" button in the email points to http://prometheus-alertmanager-0:9093 - the internal pod hostname, which is unreachable from a browser. Setting the external URL requires an ingress to exist, which is covered below.
Applying the Change
helm upgrade prometheus prometheus-community/prometheus \
  --namespace monitoring \
  --version 28.12.0 \
  --values ~/talos-cluster/bletchley/apps/monitoring/prometheus/prometheus-values.yaml
The upgrade produces PodSecurity warnings for both the Prometheus server and the Alertmanager container:
Warning: would violate PodSecurity "restricted:latest": allowPrivilegeEscalation != false
(container "alertmanager" must set securityContext.allowPrivilegeEscalation=false)...
These are warnings, not errors. The monitoring namespace has the restricted PodSecurity policy set to warn mode, not enforce. The pods run. This is a pre-existing condition - the Prometheus server had the same warnings before Alertmanager was added. It's a known gap: the Helm chart controls the security context, and fixing it properly would require either relaxing the namespace policy to baseline or overriding the securityContext in the values file. Neither is urgent for a single-operator homelab, but it's documented here for completeness.
Verifying the Pod
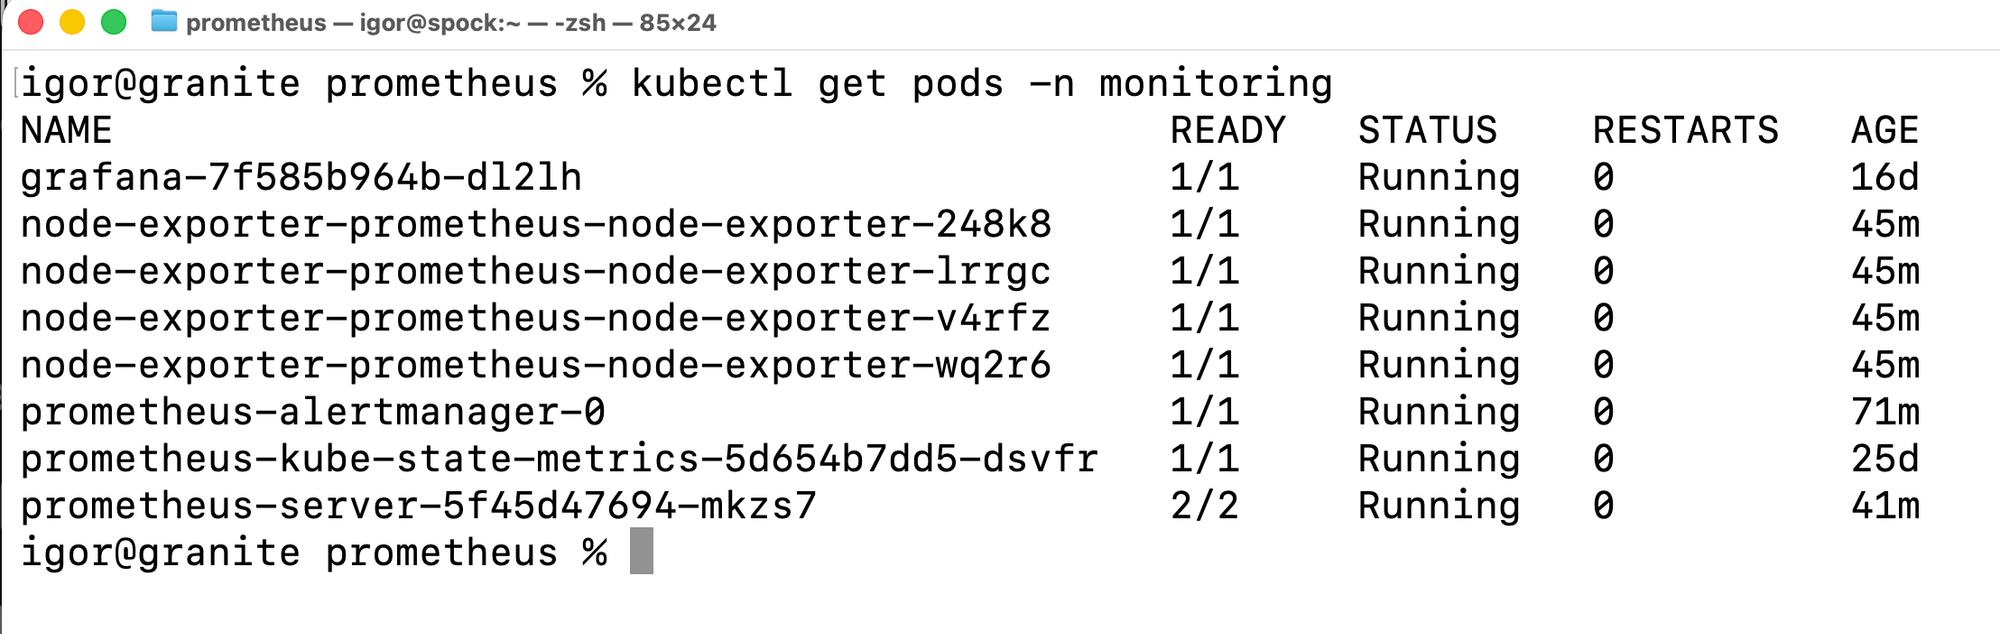
After the upgrade, the full monitoring namespace looks like this:
Verifying Alertmanager is Connected
The quickest way to verify that Prometheus has discovered and connected to Alertmanager is the alertmanagers API endpoint:
http://localhost:9090/api/v1/alertmanagers
A successful response looks like this (abbreviated):
{
  "status": "success",
  "data": {
    "activeAlertmanagers": [
      {"url": "http://10.244.0.104:9093/api/v2/alerts"}
    ],
    "droppedAlertmanagers": [...]
  }
}
One entry in activeAlertmanagers is what you want. The droppedAlertmanagers list will be long - Prometheus discovers Alertmanager instances via Kubernetes service discovery and relabeling. The droppedAlertmanagers list shows targets generated during discovery that were filtered out because they do not match the Alertmanager configuration.
The Alertmanager Ingress
Alertmanager needs an ingress for two reasons: to make the UI accessible from the browser, and to give it a real external URL for email notifications.
The ingress follows the same pattern as other cluster management services, including the Authelia ForwardAuth middleware that protects Longhorn and the Traefik dashboard:
apiVersion: networking.k8s.io/v1
kind: Ingress
metadata:
  name: alertmanager
  namespace: monitoring
  annotations:
    traefik.ingress.kubernetes.io/router.entrypoints: websecure
    cert-manager.io/cluster-issuer: letsencrypt-production
    traefik.ingress.kubernetes.io/router.middlewares: traefik-redirect-to-https@kubernetescrd,traefik-authelia@kubernetescrd
spec:
  ingressClassName: traefik
  rules:
    - host: alertmanager.bletchley.vluwte.nl
      http:
        paths:
          - path: /
            pathType: Prefix
            backend:
              service:
                name: prometheus-alertmanager
                port:
                  number: 9093
  tls:
    - hosts:
        - alertmanager.bletchley.vluwte.nl
      secretName: alertmanager-tls
The hostname follows the service.bletchley.vluwte.nl convention used for cluster management interfaces. cert-manager handles the TLS certificate via DNS-01 challenge as with all other cluster services. The certificate was ready within minutes of applying the ingress.
Writing the Alerting Rules
Alerting rules live in Prometheus under serverFiles.alerting_rules.yml in the values file. Prometheus loads them automatically alongside prometheus.yml - no explicit reference needed.
The Rule Set
Eleven rules across two groups - node for infrastructure and Kubernetes concerns, longhorn for storage:
serverFiles:
  alerting_rules.yml:
    groups:

      - name: node
        rules:

          - alert: FilesystemAlmostFull
            expr: |
              (node_filesystem_avail_bytes{fstype!~"tmpfs|overlay"}
              / node_filesystem_size_bytes{fstype!~"tmpfs|overlay"}) < 0.2
            for: 5m
            labels:
              severity: warning
            annotations:
              summary: "Filesystem {{ $labels.mountpoint }} on {{ $labels.instance }} is over 80% full"

          - alert: FilesystemCriticallyFull
            expr: |
              (node_filesystem_avail_bytes{fstype!~"tmpfs|overlay"}
              / node_filesystem_size_bytes{fstype!~"tmpfs|overlay"}) < 0.1
            for: 5m
            labels:
              severity: critical
            annotations:
              summary: "Filesystem {{ $labels.mountpoint }} on {{ $labels.instance }} is over 90% full"

          - alert: NodeDown
            expr: |
              up{job="node-exporter"} == 0
              or absent(up{job="node-exporter"})
            for: 5m
            labels:
              severity: critical
            annotations:
              summary: "Node {{ $labels.instance }} is unreachable"

          - alert: PodRestartingTooOften
            expr: |
              increase(kube_pod_container_status_restarts_total[1h]) > 5
            for: 5m
            labels:
              severity: warning
            annotations:
              summary: "Pod {{ $labels.namespace }}/{{ $labels.pod }} has restarted {{ $value | printf \"%.0f\" }} times in the last hour"

          - alert: NetworkSaturationRx
            expr: |
              rate(node_network_receive_bytes_total{device!~"lo|flannel.*|cni.*"}[5m]) > 100000000
            for: 5m
            labels:
              severity: warning
              direction: receive
            annotations:
              summary: "Network receive saturation on {{ $labels.instance }} device {{ $labels.device }} exceeds 800Mbps"

          - alert: NetworkSaturationTx
            expr: |
              rate(node_network_transmit_bytes_total{device!~"lo|flannel.*|cni.*"}[5m]) > 100000000
            for: 5m
            labels:
              severity: warning
              direction: transmit
            annotations:
              summary: "Network transmit saturation on {{ $labels.instance }} device {{ $labels.device }} exceeds 800Mbps"

          - alert: DeploymentReplicasUnavailable
            expr: |
              kube_deployment_status_replicas_unavailable > 0
            for: 5m
            labels:
              severity: warning
            annotations:
              summary: "Deployment {{ $labels.namespace }}/{{ $labels.deployment }} has {{ $value | printf \"%.0f\" }} unavailable replicas"

      - name: longhorn
        rules:

          - alert: LonghornVolumeAlmostFull
            expr: |
              (longhorn_volume_actual_size_bytes / longhorn_volume_capacity_bytes) > 0.8
            for: 5m
            labels:
              severity: warning
            annotations:
              summary: "Longhorn volume {{ $labels.pvc }} ({{ $labels.pvc_namespace }}) is over 80% full"

          - alert: LonghornVolumeCriticallyFull
            expr: |
              (longhorn_volume_actual_size_bytes / longhorn_volume_capacity_bytes) > 0.9
            for: 5m
            labels:
              severity: critical
            annotations:
              summary: "Longhorn volume {{ $labels.pvc }} ({{ $labels.pvc_namespace }}) is over 90% full"

          - alert: LonghornVolumeDegraded
            expr: longhorn_volume_robustness == 2
            for: 5m
            labels:
              severity: warning
            annotations:
              summary: "Longhorn volume {{ $labels.pvc }} ({{ $labels.pvc_namespace }}) is degraded"

          - alert: LonghornVolumeFaulted
            expr: longhorn_volume_robustness == 3
            for: 1m
            labels:
              severity: critical
            annotations:
              summary: "Longhorn volume {{ $labels.pvc }} ({{ $labels.pvc_namespace }}) is faulted"
A Note on Selected Rules
NodeDown uses up{job="node-exporter"} == 0 or absent(up{job="node-exporter"}) rather than the simpler == 0 alone. The first condition fires when a scrape target exists but returns a failure. The second covers the case where the target disappears entirely - as happens when node-exporter pods are stopped. Using both ensures the alert fires in either scenario. When the target is present but down, $labels.instance is populated in the notification. When the target is absent, the label is empty - a known limitation of absent().
NetworkSaturationRx and NetworkSaturationTx are two separate rules that alert when receive or transmit traffic on an interface exceeds 800Mbps - 80% of the cluster's 1Gb uplink. Splitting them into separate rules rather than combining the directions means the alert name and summary message identify which direction is saturated, which matters for diagnosis: Longhorn replication is primarily transmit, rclone backups are primarily receive. Measuring each direction independently is also correct for a full-duplex link, where each direction can use the full 1Gbps simultaneously. The device filter device!~"lo|flannel.*|cni.*" excludes loopback and CNI overlay interfaces but still matches veth pairs and other virtual interfaces that don't fit the pattern. In a more refined setup, additional exclusions - veth.*, docker.*, cali.* - would limit alerts to physical uplinks only. For this cluster the current filter is sufficient.
Severity levels are intentionally limited to warning and critical. The current Alertmanager routing sends all alerts to the same email receiver regardless of severity, so additional levels would have no effect yet. If routing is extended later - separate receivers for critical vs warning, or paging for critical only - the severity labels are already in place to drive that.
A Note on Filesystem Alerts and Talos Linux
The FilesystemAlmostFull and FilesystemCriticallyFull rules use Node Exporter metrics - and on Talos Linux, this has an important limitation.
Node Exporter sees host-level filesystem mounts: the NVMe disk (/var/mnt/longhorn), the eMMC (/var), ZFS datasets on rock3. What it does not see are Longhorn volumes mounted inside pods. On a standard Linux distribution, those mounts appear under /var/lib/kubelet/pods/... and Node Exporter picks them up. On Talos, these pod volume mount paths are not visible to Node Exporter running on the host - likely due to differences in how filesystem namespaces are exposed and isolated in Talos' immutable OS design.
Querying node_filesystem_avail_bytes confirms this - there are no pod volume mountpoints in the results, only host-level filesystems.
This means the filesystem rules are valuable for node-level health (a full NVMe or eMMC is a serious problem) but will never fire for an individual PVC filling up inside a pod. For per-PVC monitoring, the Longhorn metrics are the correct approach - which is why the LonghornVolumeAlmostFull and LonghornVolumeCriticallyFull rules exist.
The Correct Longhorn Metric Name
The planning notes referenced longhorn_volume_usage_bytes as the metric for volume fill percentage. That metric does not exist. The correct name is longhorn_volume_actual_size_bytes.
The distinction matters: longhorn_volume_actual_size_bytes reports how many bytes Longhorn has actually written to the volume (the physical footprint), while longhorn_volume_capacity_bytes is the provisioned size. Dividing one by the other gives the fill ratio. Verifying metric names against what Prometheus is actually scraping - rather than trusting documentation - is always the right approach:
{__name__=~"longhorn_volume.*", pvc_namespace="your-namespace"}
The annotations also use $labels.pvc and $labels.pvc_namespace rather than $labels.volume. This gives readable alert summaries like "Longhorn volume Grafana (monitoring) is over 80% full" rather than a UUID.
YAML Syntax
Two issues appeared during the initial apply that are worth documenting. First, a truncated labels block - a copy-paste that ended at severity with no value - produced:
yaml: unmarshal errors: line 78: cannot unmarshal !!str `severity` into map[string]string
Second, the alertmanager config used alertmanagerFiles instead of alertmanager.config, which resulted in Alertmanager starting with an empty default config. Both were identified by checking the Prometheus logs and the configmap directly rather than guessing.
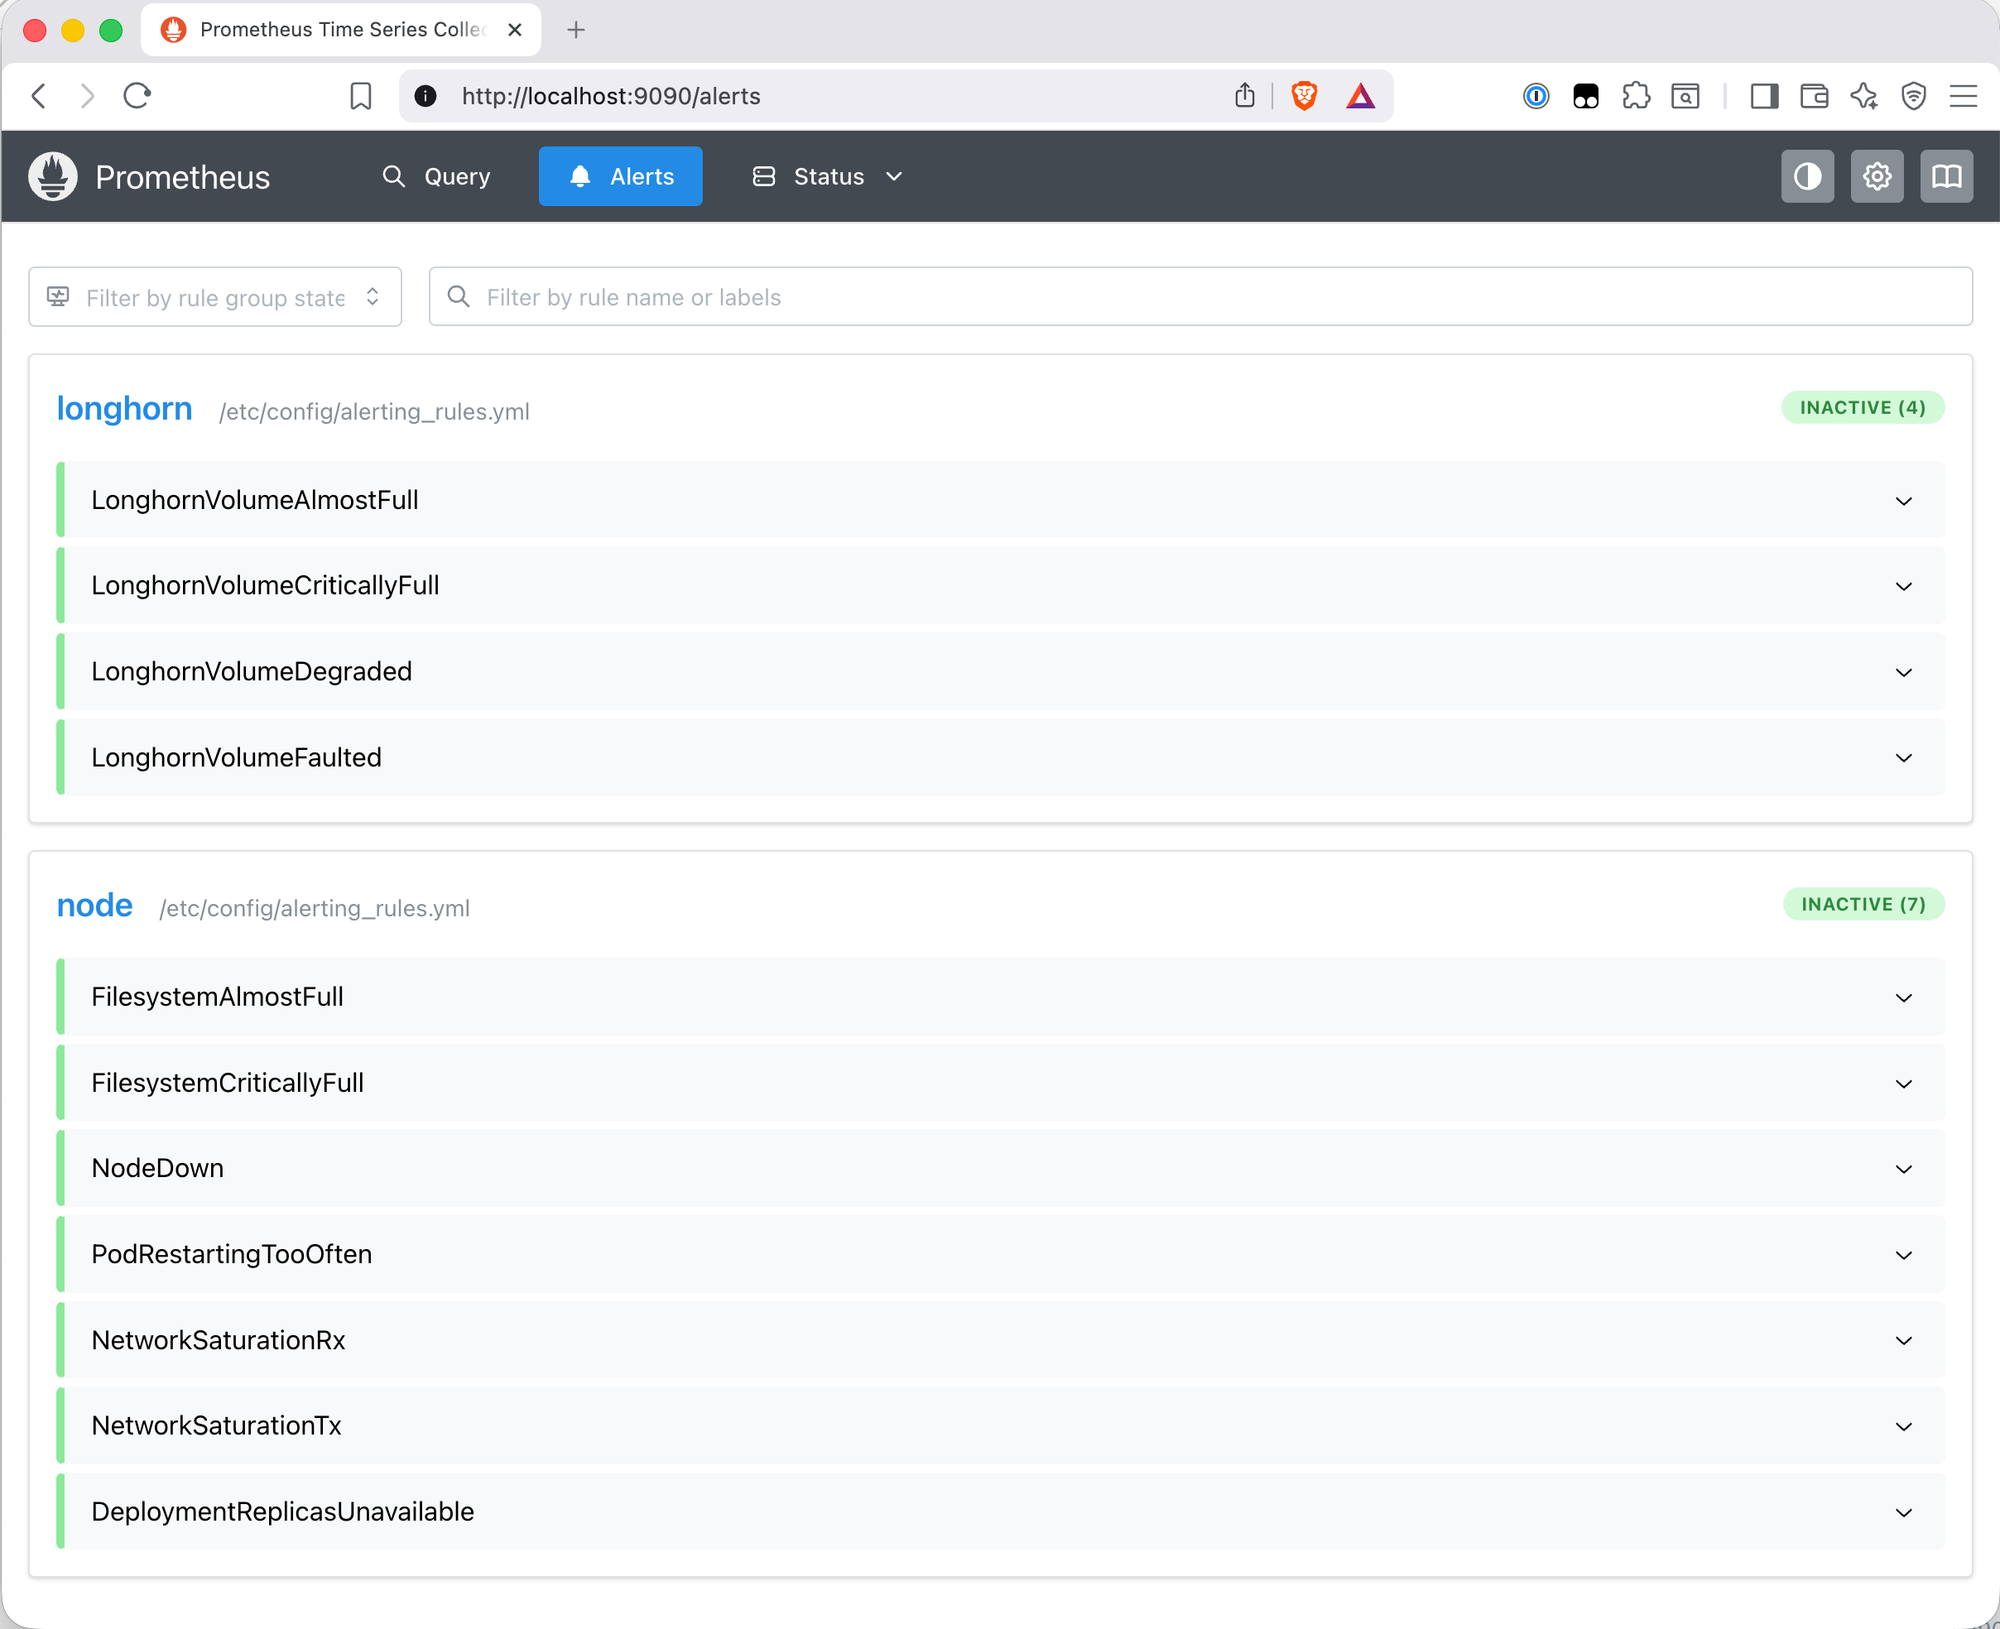
All Rules Loaded
After applying the rules and confirming the configuration reloaded successfully, the Prometheus Alerts page shows all eleven rules loaded and inactive:
Testing
Rather than waiting for a real incident to validate the alerting chain, a structured set of tests was run. Each test targets a specific rule, verifies the alert appears in both Prometheus and Alertmanager, and confirms email delivery. A dedicated namespace and PVC were created for the tests and cleaned up afterwards.
Test Setup
apiVersion: v1
kind: Namespace
metadata:
  name: alert-test
---
apiVersion: v1
kind: PersistentVolumeClaim
metadata:
  name: alert-test-pvc
  namespace: alert-test
  labels:
    backup.vluwte.nl/enabled: "false"
spec:
  accessModes:
    - ReadWriteOnce
  storageClassName: longhorn
  resources:
    requests:
      storage: 500Mi
---
apiVersion: v1
kind: Pod
metadata:
  name: alert-test
  namespace: alert-test
spec:
  containers:
    - name: alert-test
      image: debian:stable-slim
      command: ["sleep", "infinity"]
      volumeMounts:
        - name: data
          mountPath: /data
  volumes:
    - name: data
      persistentVolumeClaim:
        claimName: alert-test-pvc
Longhorn Volume Fill Tests
Filling the volume with zeros using dd if=/dev/zero and with random data using dd if=/dev/urandom both showed the volume filling as expected. Longhorn reports logical usage - the amount written to the volume from the guest's perspective - so writing zeros still counts toward used capacity regardless of whether the underlying storage handles it more efficiently. The longhorn_volume_actual_size_bytes metric reflects this logical usage, which is what matters for capacity alerting.
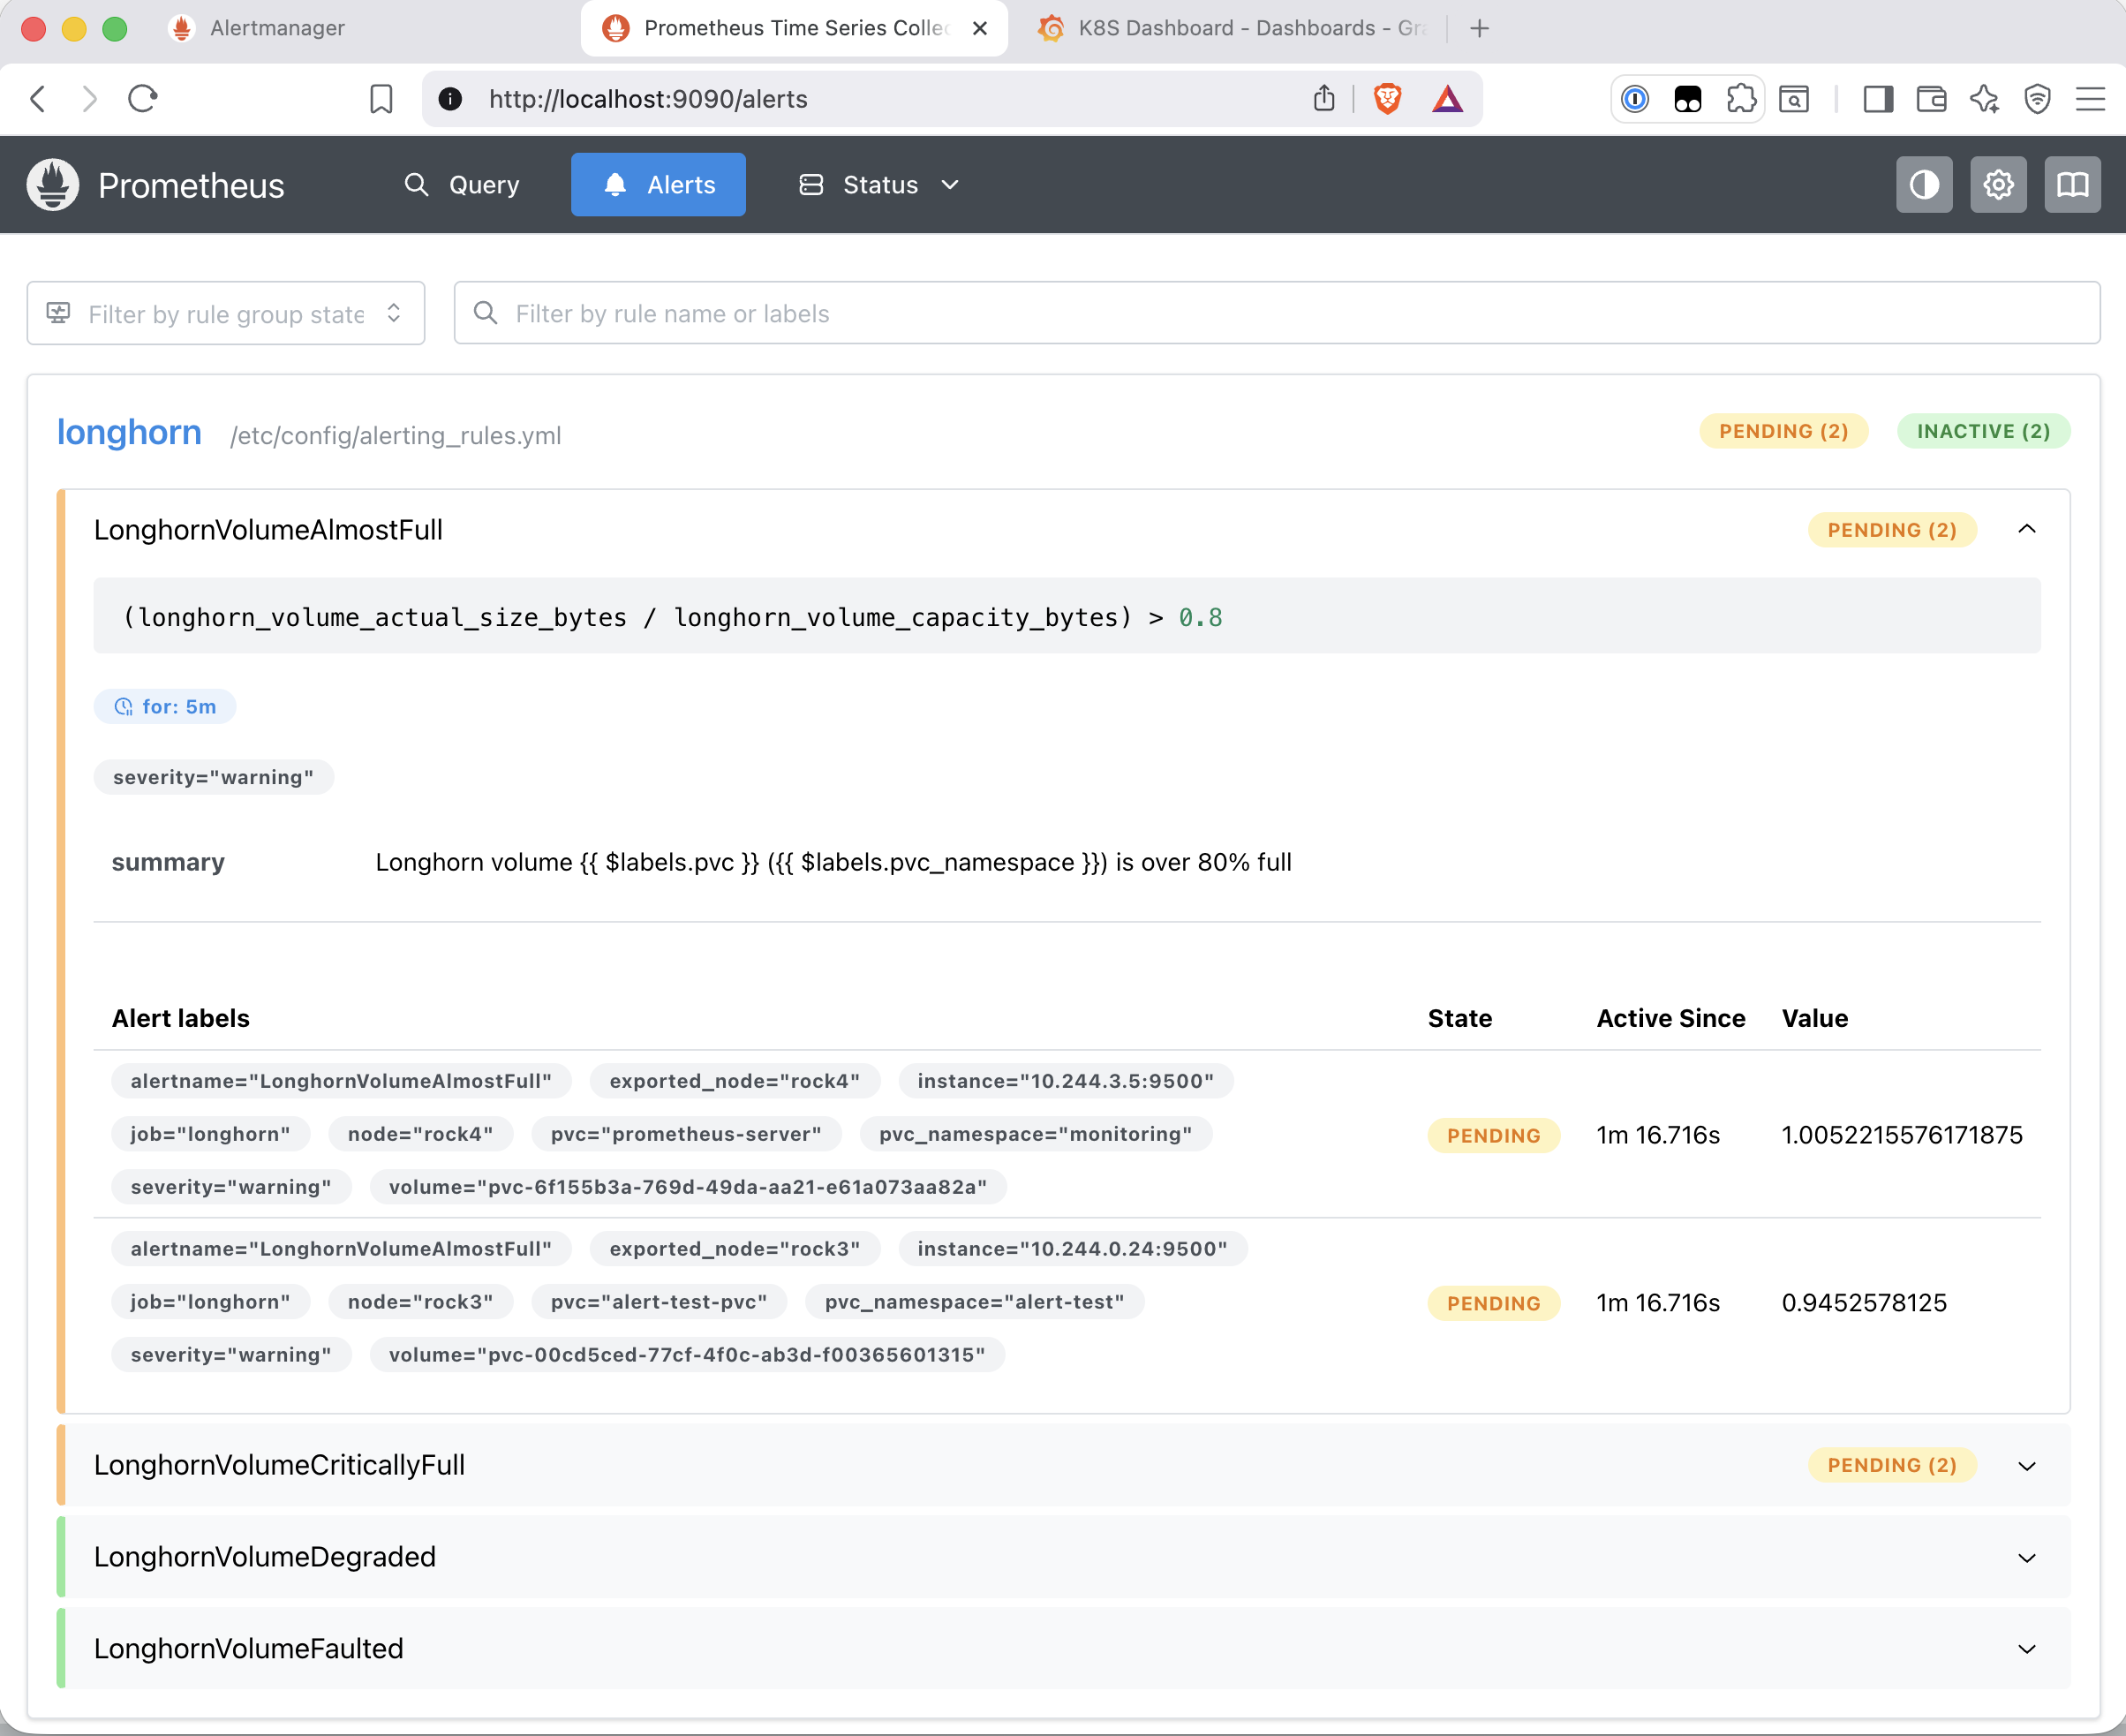
The Longhorn dashboard showed the volume jumping to ~85% capacity within seconds of the fill completing. After 5 minutes (the for: duration on the rules), both LonghornVolumeAlmostFull and LonghornVolumeCriticallyFull appeared in Prometheus:
for: duration before firing.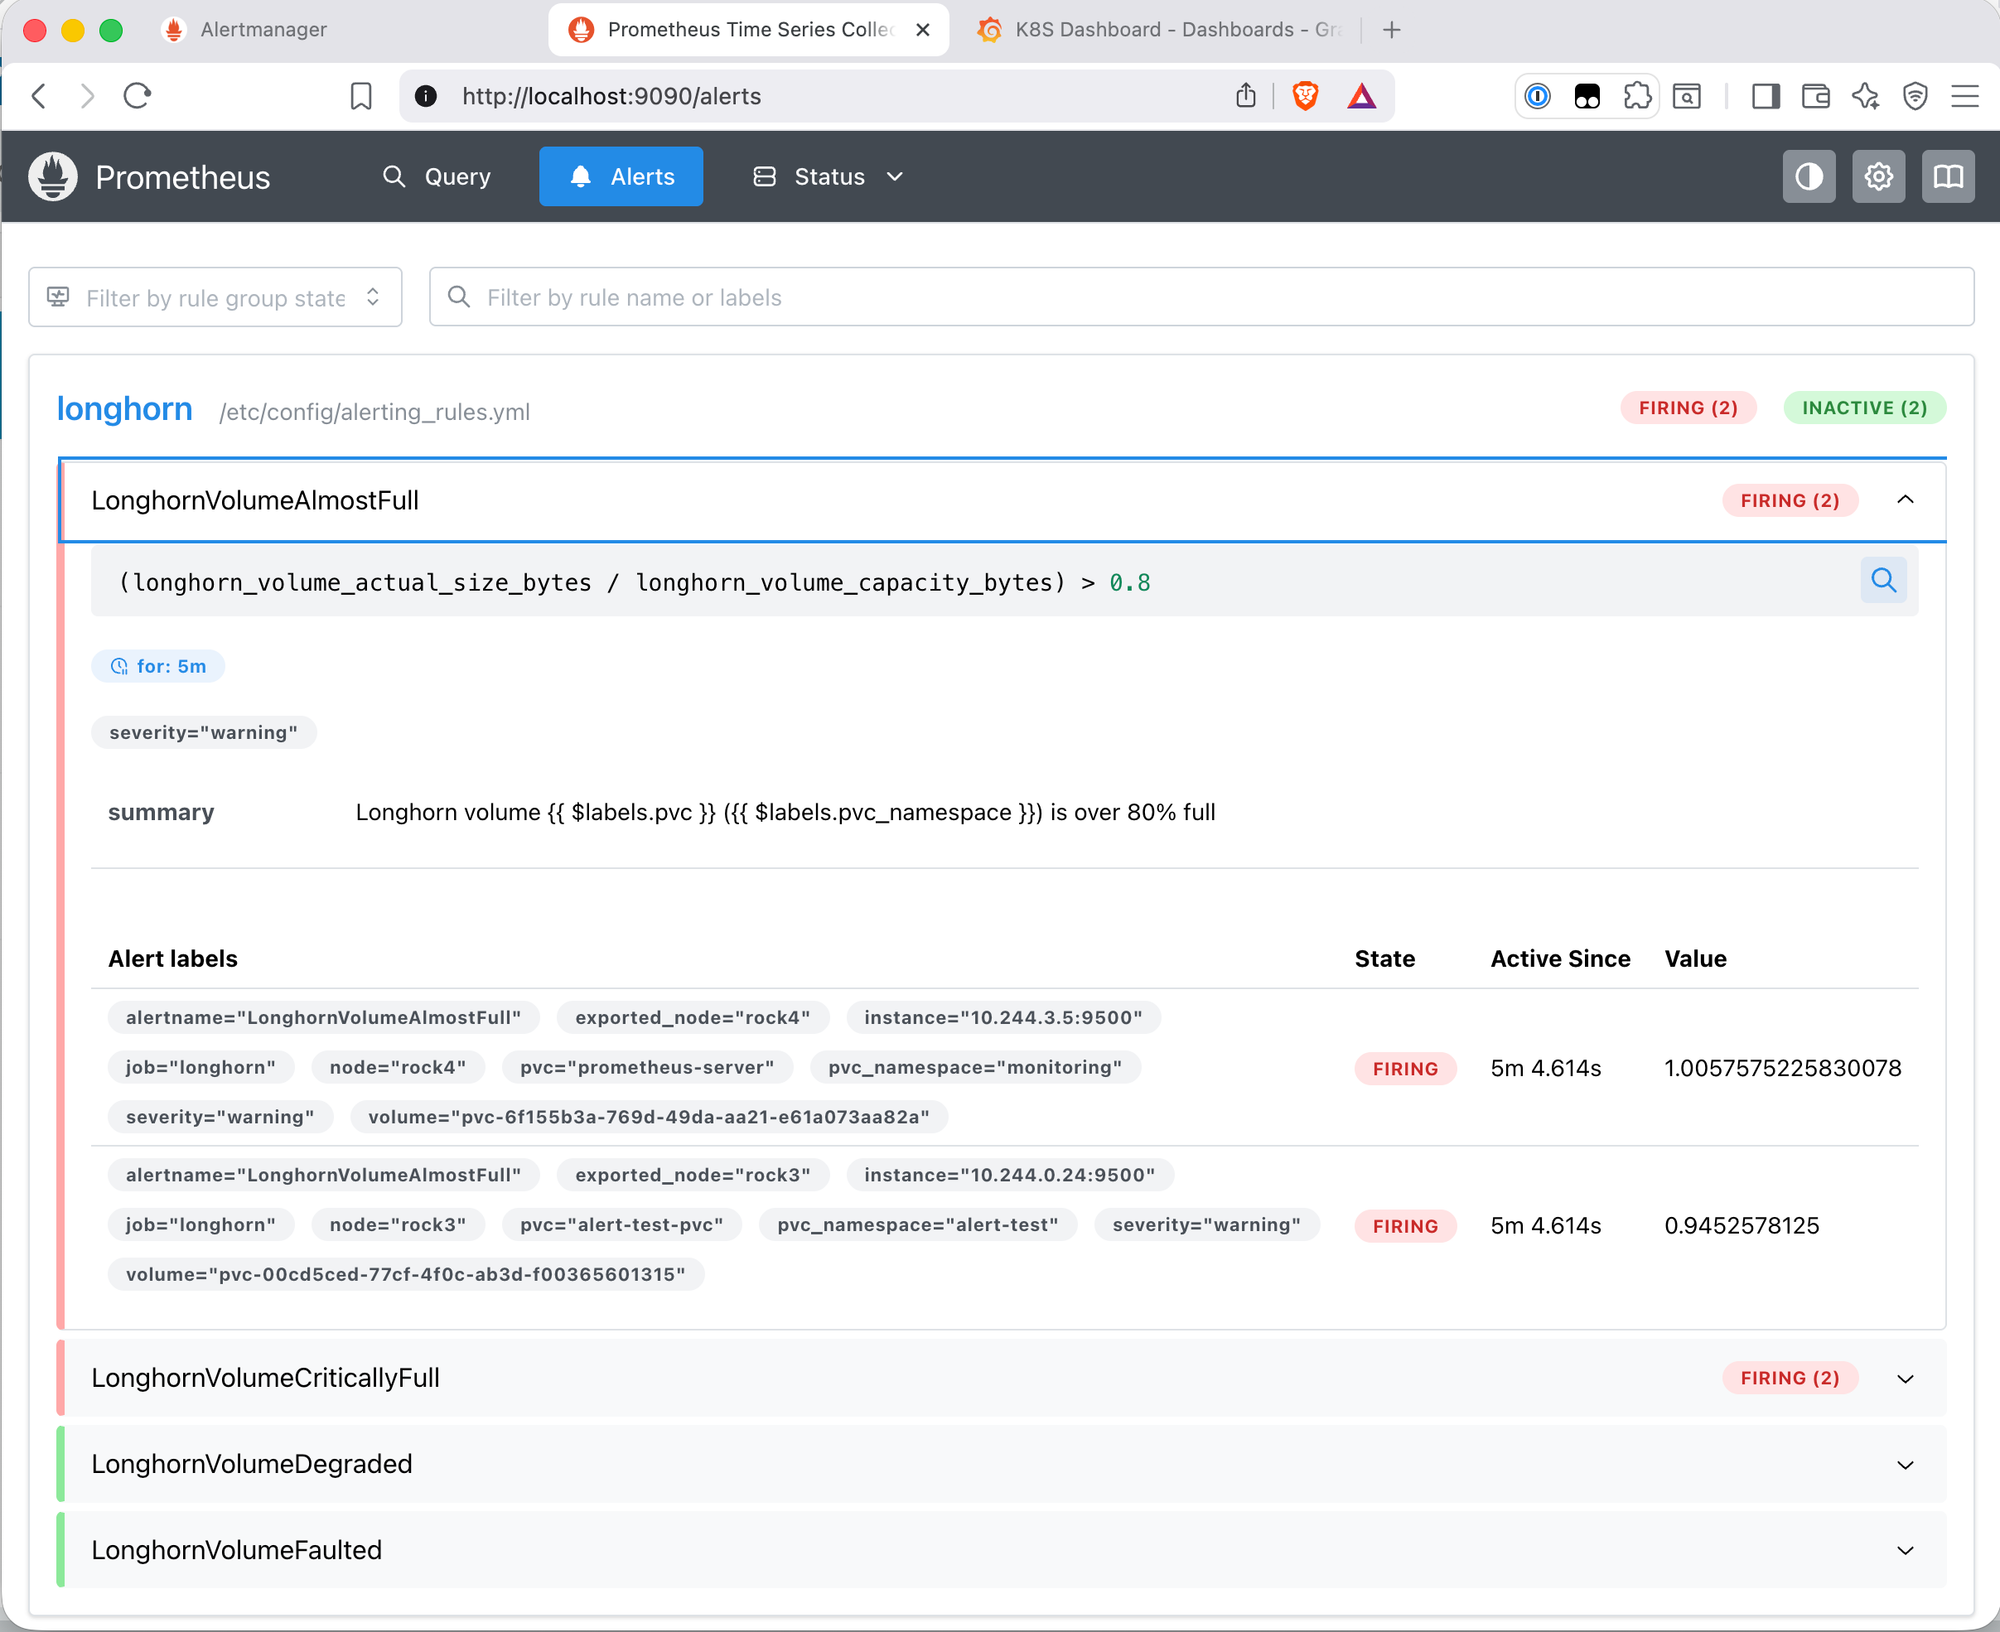
The prometheus-server alert was not a test artefact - the Prometheus PVC was genuinely full at 96.5% of its 10Gi capacity after 15 days of data. This was addressed by expanding the PVC to 30Gi and extending retention to 30 days, both via helm upgrade. Longhorn resized the volume online without downtime. At approximately 667MB of metrics data per day, 30Gi provides comfortable headroom at 30-day retention.
After cleanup, Longhorn volumes that have had files deleted need a trim before the space is reclaimed. fstrim from inside the pod requires elevated privileges that Talos doesn't grant. The trim can be run from the Longhorn UI: Volumes → select volume → menu → Trim Filesystem.
Alertmanager UI and Email Delivery
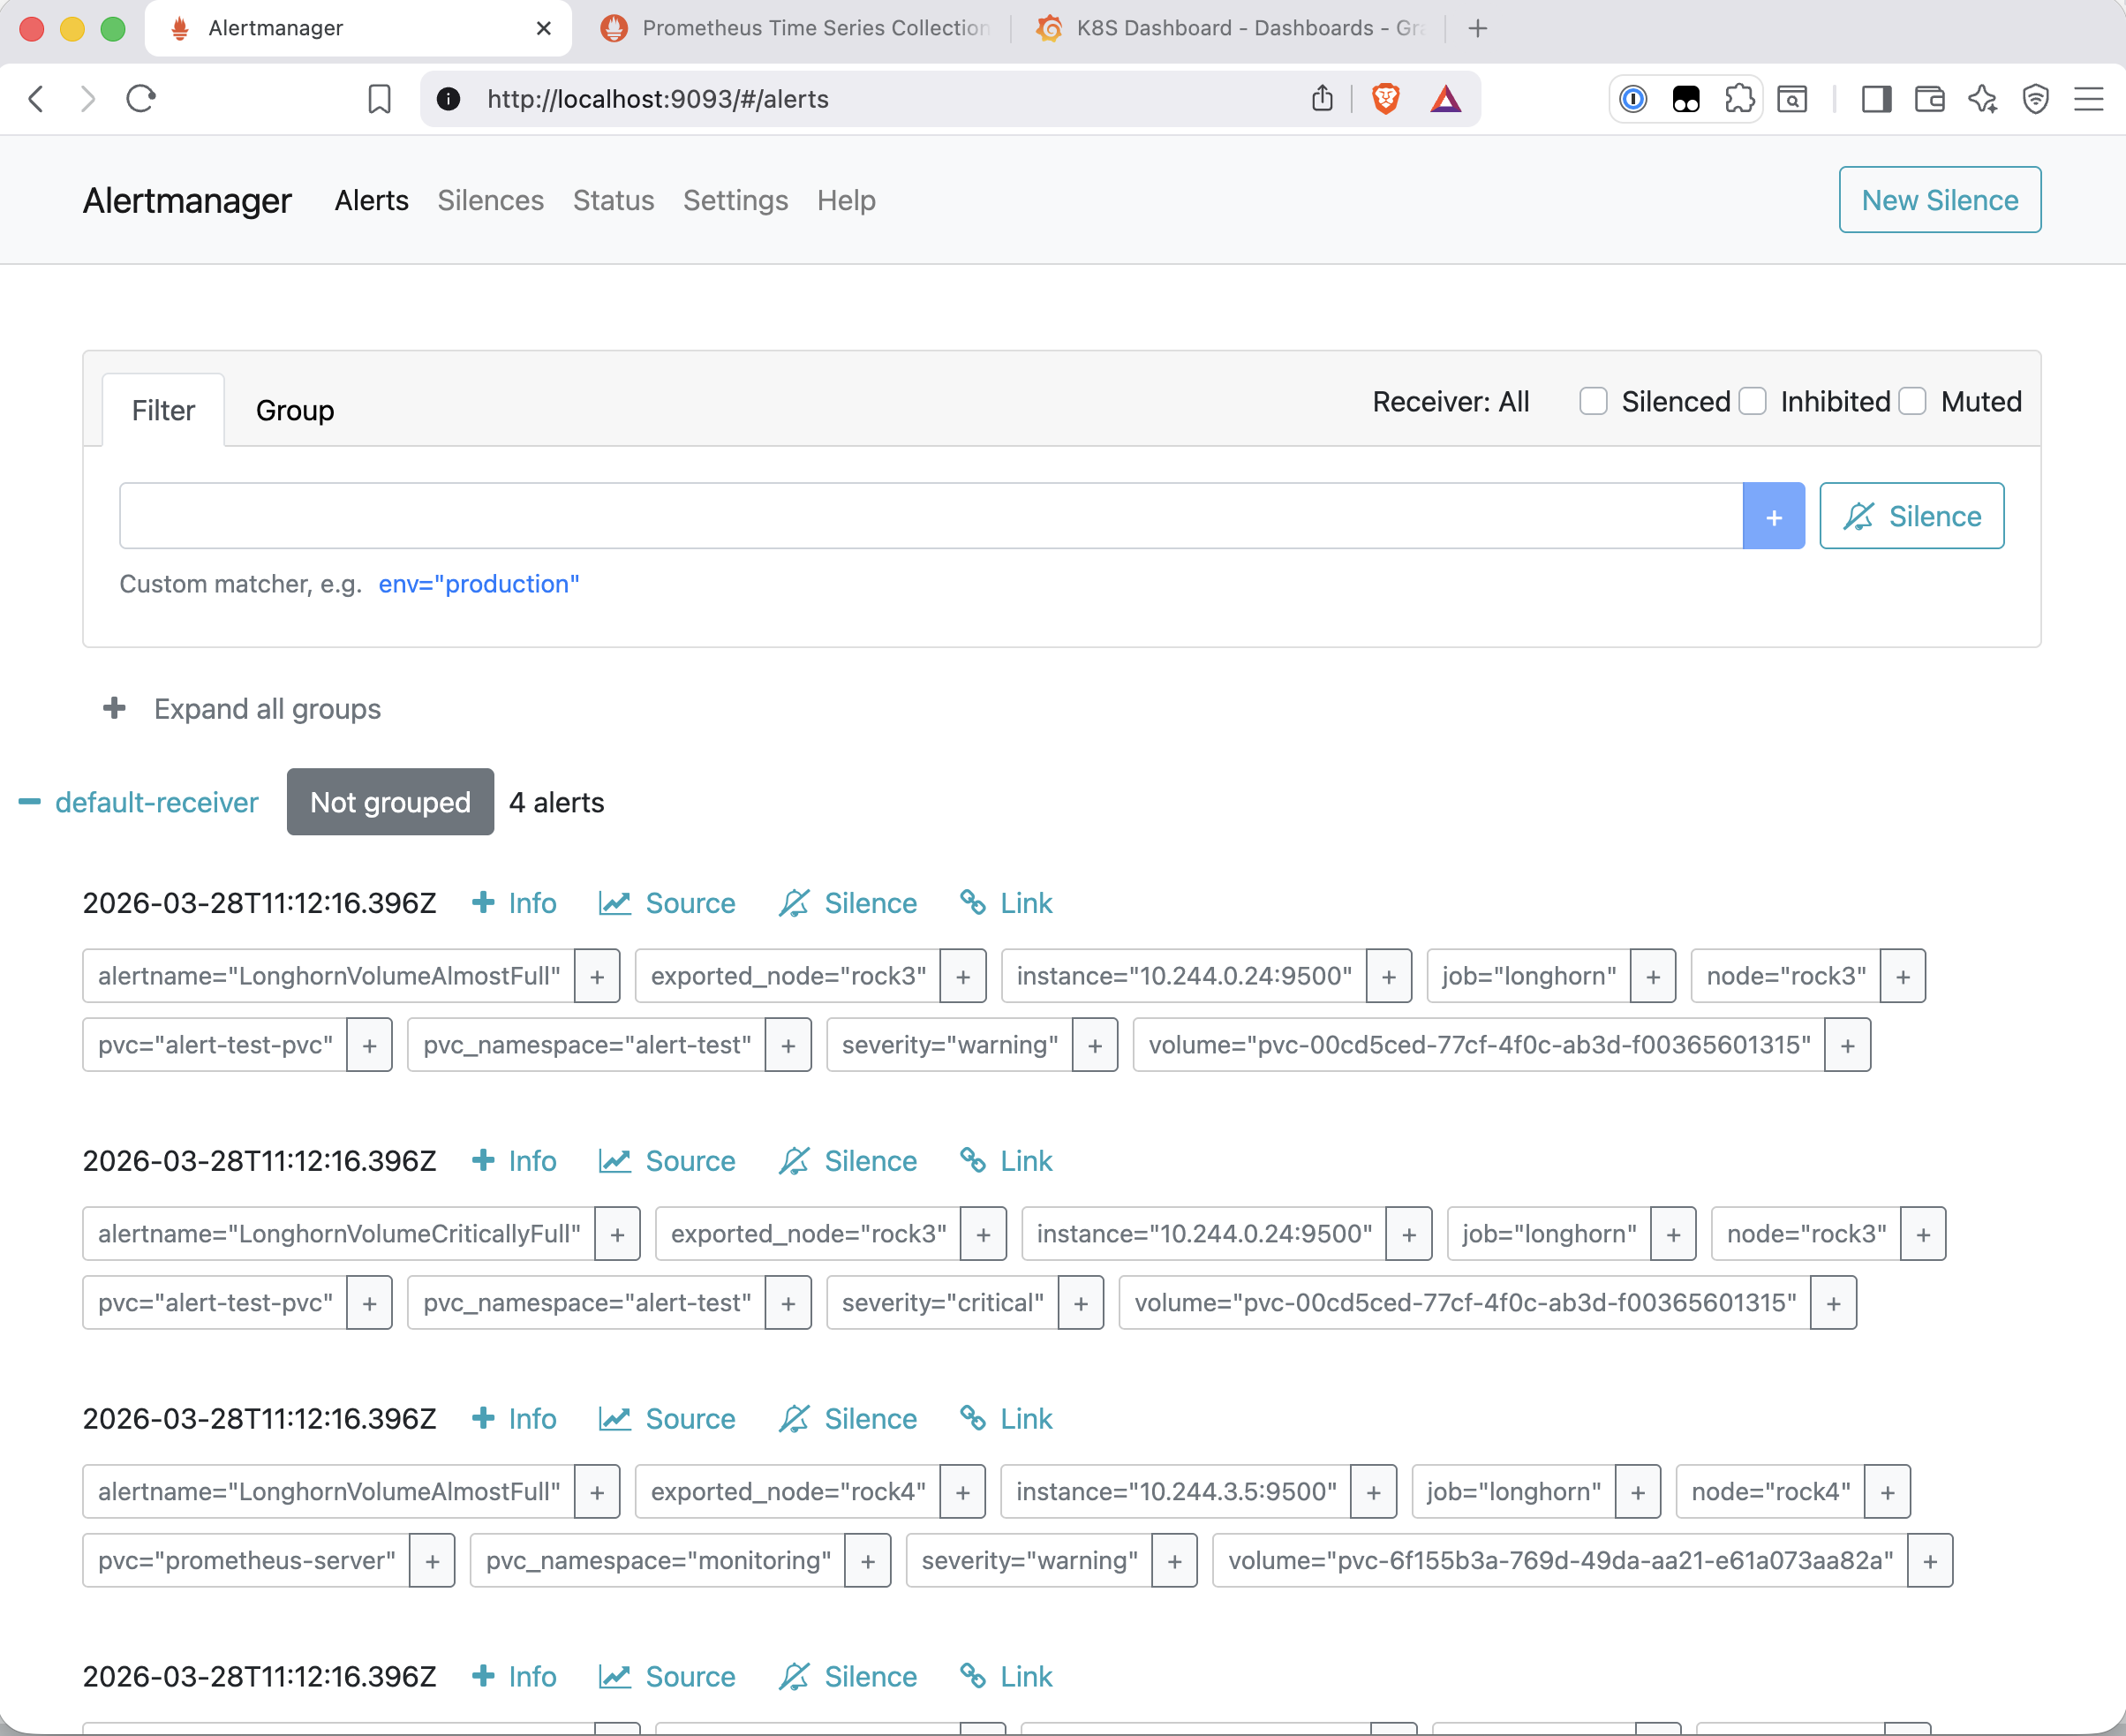
The Alertmanager UI showed the same four alerts, routed correctly to the email receiver:
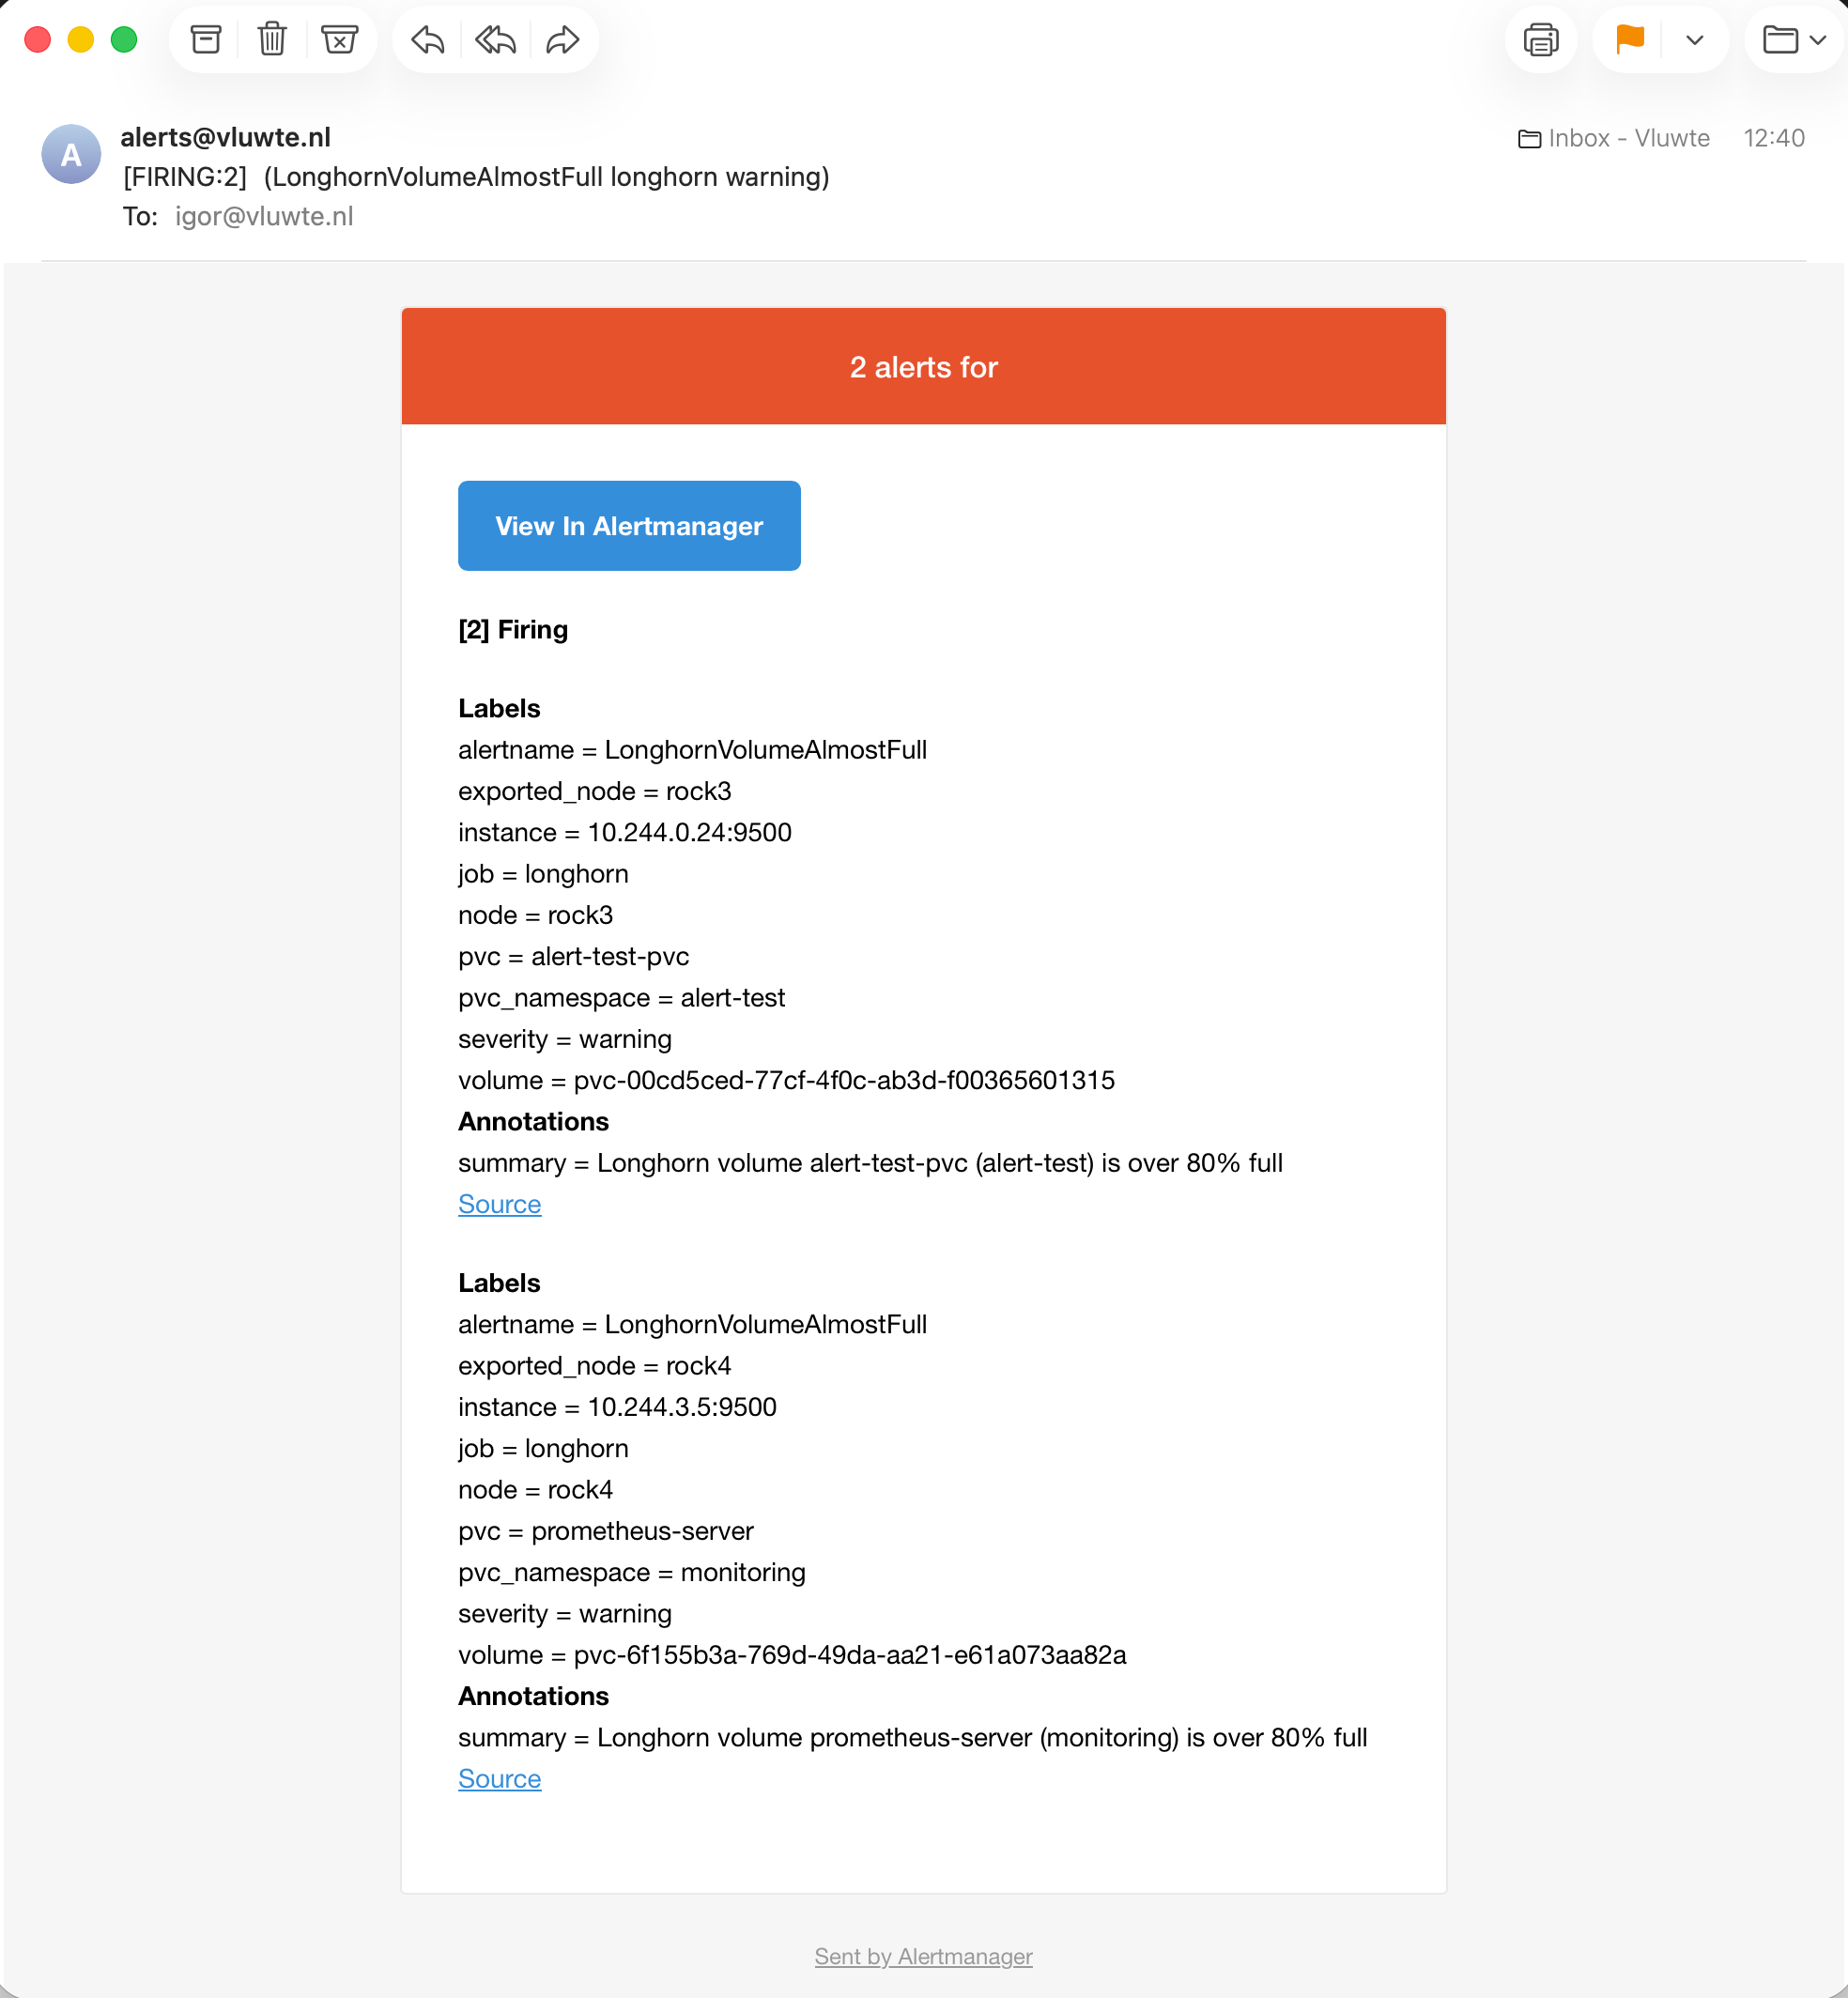
The email arrived within seconds of the alerts appearing in Alertmanager:
The server-side mail log confirmed delivery through the internal relay:
Mar 28 12:40:19 sulu postfix/smtpd[1061354]: connect from rock3.vluwte.nl[10.0.140.13]
Mar 28 12:40:19 sulu postfix/pipe[1061359]: 8C74221688: to=<igor@vluwte.nl>,
  relay=virtualprocmail, delay=0.41, dsn=2.0.0, status=sent
SpamAssassin scored the email at -0.2/5.0 - clean, no surprises.
Pod Restart Test
A pod that exits immediately with code 1 triggers Kubernetes restarts. A separate crashloop pod was deployed for this test rather than modifying the existing alert-test pod:
apiVersion: v1
kind: Pod
metadata:
  name: crashloop-test
  namespace: alert-test
spec:
  containers:
    - name: crashloop
      image: debian:stable-slim
      command: ["sh", "-c", "exit 1"]
kubectl apply -f crashloop-test.yaml
kubectl get pod crashloop-test -n alert-test -w
Kubernetes restarts the container each time it exits, but applies exponential backoff - the delay between restarts grows with each cycle. This means the six restarts needed to cross the threshold take longer than they would if all restarts happened immediately. Progress can be tracked in real time:
increase(kube_pod_container_status_restarts_total{namespace="alert-test"}[1h])
After the counter crossed 5 and the for: 5m duration elapsed, PodRestartingTooOften fired and the email arrived. Deleting the crashloop pod resolved the condition and the alert cleared.
kubectl delete pod crashloop-test -n alert-test
Network Saturation Test
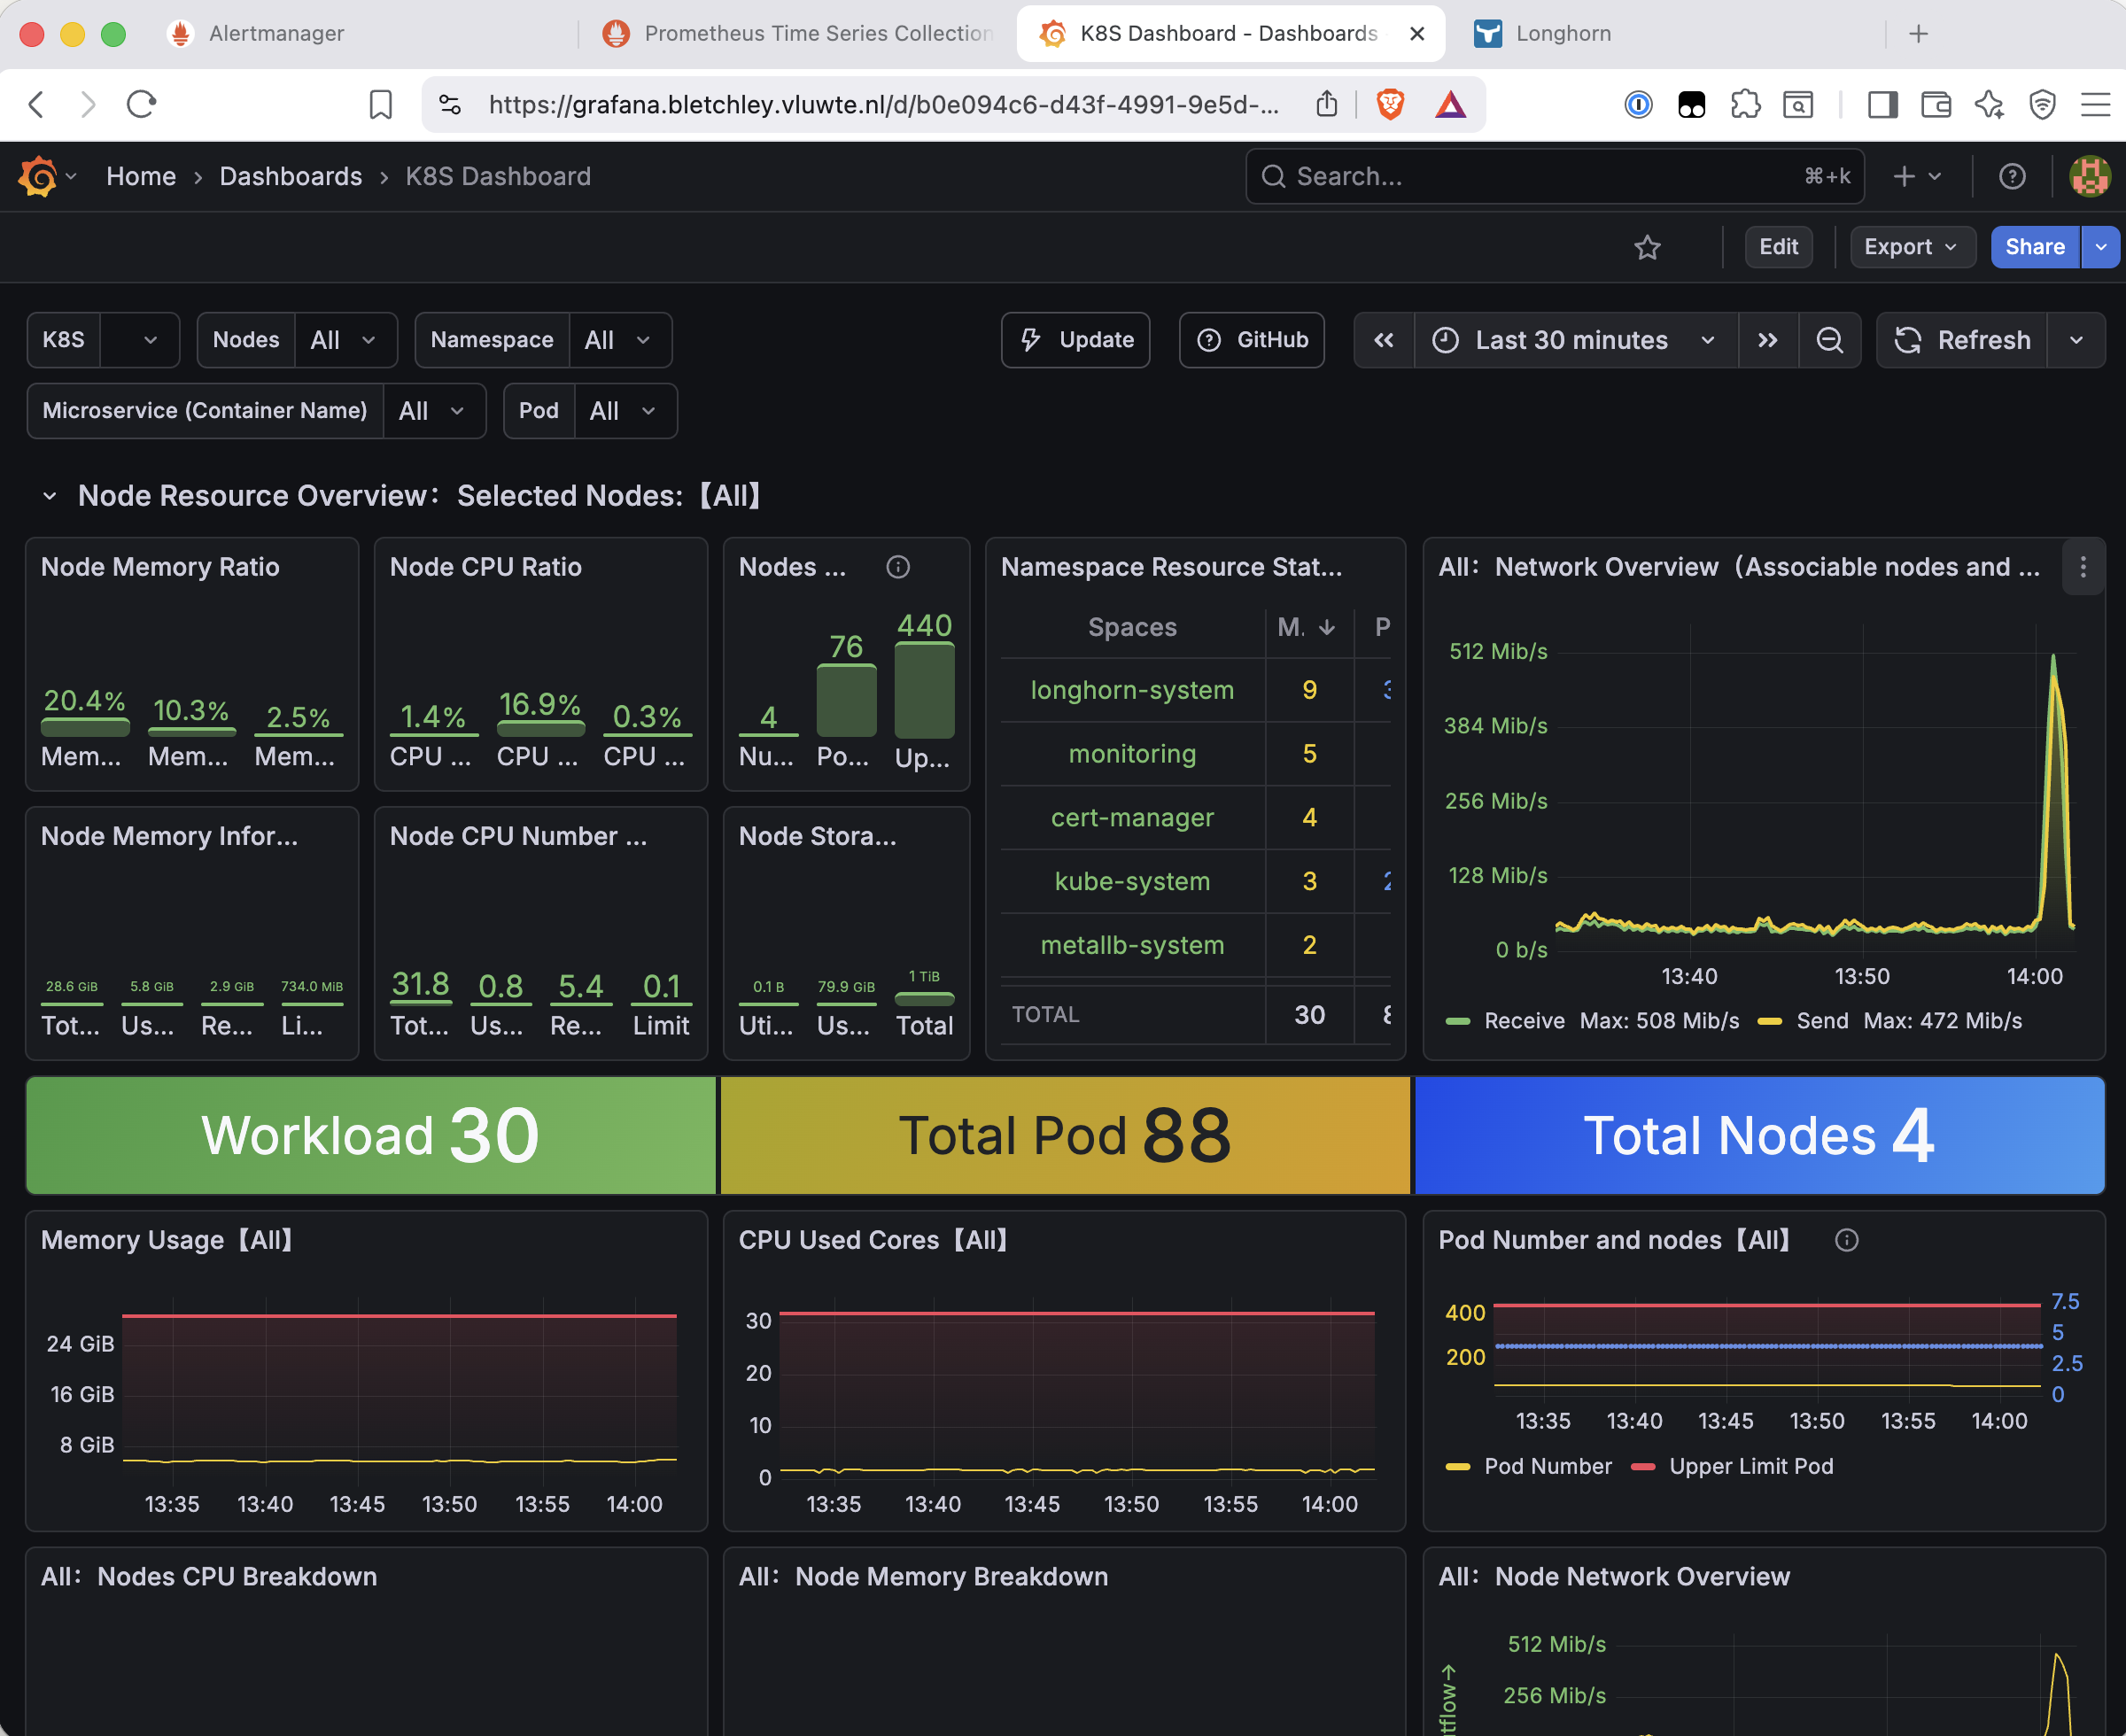
The threshold was temporarily lowered to > 1000 bytes/second to trigger on any traffic, then the Synology rclone backup job was run. The network dashboard showed the spike clearly - 508 Mib/s receive and 472 Mib/s send at the moment of the backup:
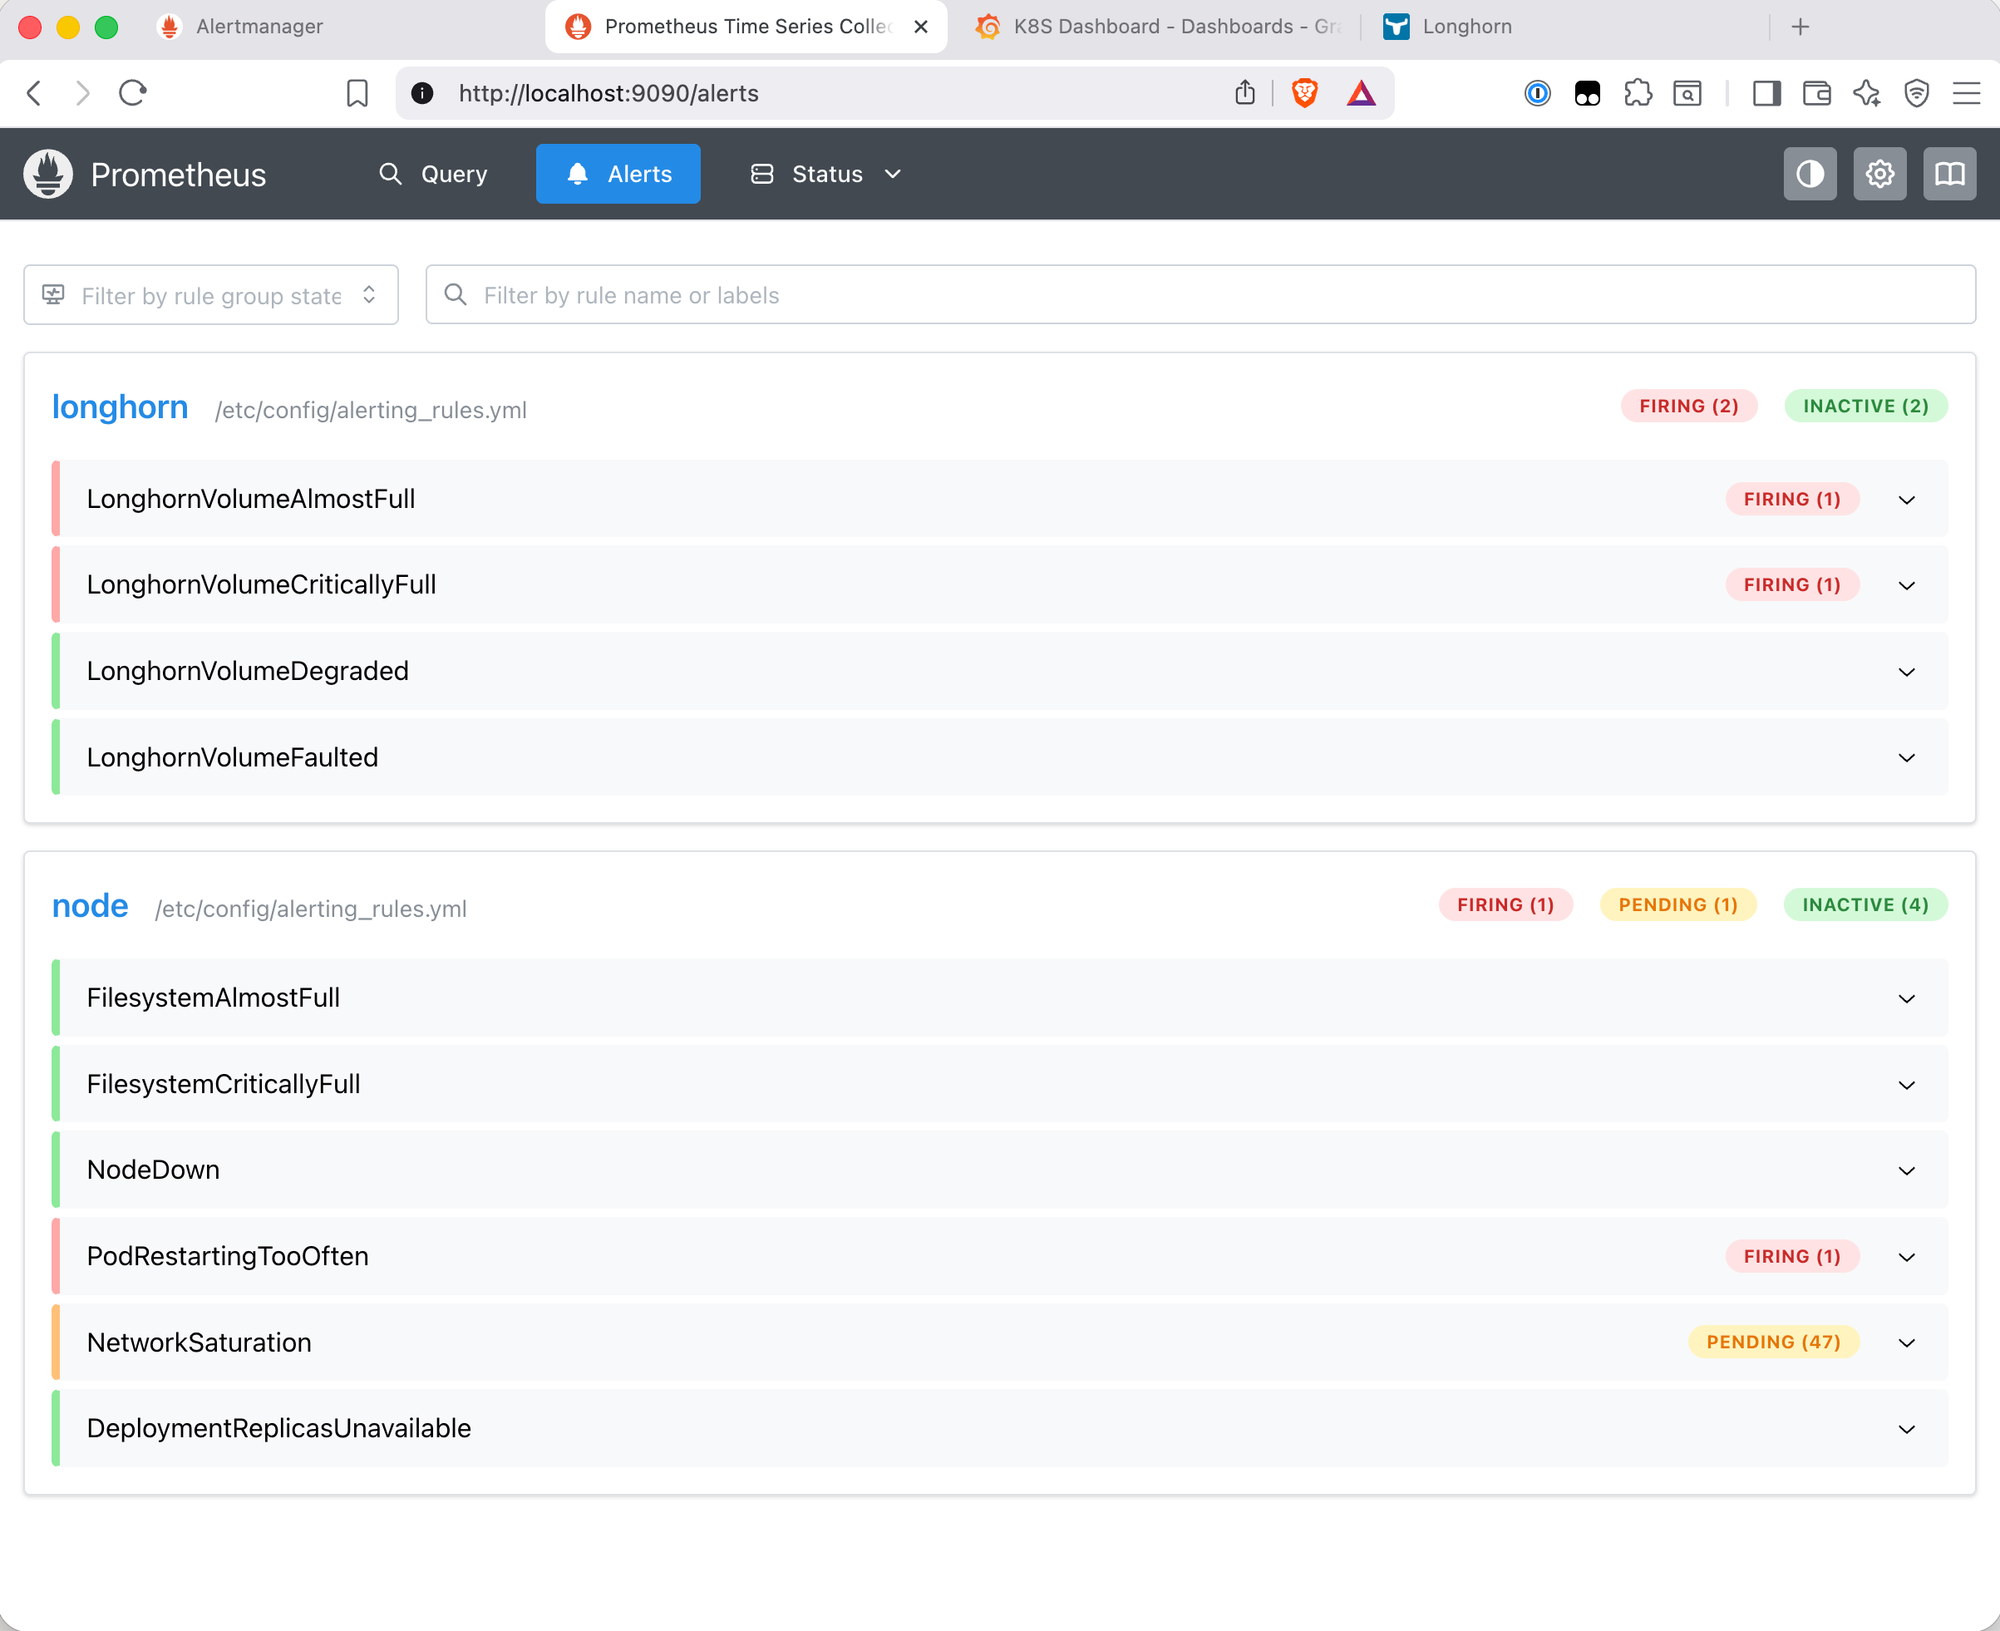
The alert appeared in Prometheus as 47 pending instances - one per matched network interface across all four nodes. This is expected behaviour at the lowered threshold: the device filter excludes loopback (lo) and Flannel/CNI overlay interfaces, but veth pairs created for each pod and other virtual interfaces still match. At the real threshold of 800Mbps, only interfaces carrying sustained high physical traffic would trigger this in practice. The threshold was restored after the test.
NodeDown Test
Stopping all node-exporter pods was done via a DaemonSet nodeSelector patch rather than kubectl scale (DaemonSets do not support the scale subresource):
# Stop node-exporter
kubectl patch daemonset node-exporter-prometheus-node-exporter -n monitoring \
  -p '{"spec":{"template":{"spec":{"nodeSelector":{"non-existing":"true"}}}}}'

# Restore node-exporter
kubectl patch daemonset node-exporter-prometheus-node-exporter -n monitoring \
  --type json \
  -p='[{"op":"remove","path":"/spec/template/spec/nodeSelector/non-existing"}]'
After 5 minutes, NodeDown fired for all four nodes. After restoring, the alerts resolved and pods were back within seconds.
DeploymentReplicasUnavailable Test
Patching the Grafana deployment with an invalid image tag forced a failed rollout:
kubectl set image deployment/grafana grafana=grafana/grafana:invalid-tag-test -n monitoring
The new pod stayed in Init:0/1 state. After 5 minutes, DeploymentReplicasUnavailable fired. Rolled back with kubectl rollout undo deployment/grafana -n monitoring.
Tests Not Run
LonghornVolumeDegraded and LonghornVolumeFaulted were not tested in practice. Triggering a degraded volume requires losing a Longhorn replica - which means either cordoning a node or deliberately killing a replica process. On a four-node cluster where Longhorn is storing real data, the risk is disproportionate to the testing value. The rules are verified by inspection: robustness value 2 for degraded, 3 for faulted. These are the values Longhorn uses in its own UI.
What's Working Now
✅ Alertmanager running with a Longhorn-backed 2Gi PVC and correct backup labels
✅ SMTP delivery via internal relay - no credentials required
✅ Eleven alerting rules loaded across two groups (node, longhorn)
✅ All rules tested and verified end-to-end
✅ Alertmanager accessible at https://alertmanager.bletchley.vluwte.nl with TLS and Authelia authentication
✅ Email notifications with working "View in Alertmanager" link
✅ Prometheus PVC expanded to 30Gi with 30-day retention
Lessons Learned
alertmanager.config, notalertmanagerFiles- the newer standalone Alertmanager subchart expects configuration underalertmanager.config. Using the oldalertmanagerFileskey results in Alertmanager starting with a default empty config and silently delivering nothing. Check the configmap to verify what was actually applied.- Verify metric names against what Prometheus is actually scraping -
longhorn_volume_usage_bytesdoes not exist. The correct metric islonghorn_volume_actual_size_bytes. Running{__name__=~"longhorn_volume.*"}in the Prometheus query interface is the reliable way to find the exact names before writing rules. - Talos Linux hides pod filesystem mounts from Node Exporter - on a standard Linux node, Longhorn volumes mounted inside pods appear under
/var/lib/kubelet/pods/...and Node Exporter picks them up. On Talos, this path isn't exposed. The filesystem rules only fire for host-level mounts (NVMe, eMMC, ZFS). Per-PVC fill monitoring must use Longhorn metrics. - Longhorn doesn't reclaim space automatically after file deletion - after deleting a large fill file from a Longhorn volume, the space reported by Longhorn doesn't reduce until a filesystem trim is run.
fstrimfrom inside a pod requires elevated privileges that Talos doesn't grant. Use the Longhorn UI: Volumes → select volume → Trim Filesystem. - DaemonSets don't support
kubectl scale- to stop all node-exporter pods for the NodeDown test, a nodeSelector patch is the correct approach. Adding a non-matching label (non-existing: "true") causes all pods to be evicted. Removing the label key with a JSON Patch restores them. - The
for:duration means you wait - every alert hasfor: 5m, which means the condition must be sustained for 5 minutes before the alert fires. During testing, the natural instinct is to clean up too quickly. Wait for the alert to appear in Prometheus before cleaning up the test condition.
What's Next
Step 1 of the observability plan is complete. Prometheus collects, Grafana displays, and Alertmanager notifies. The next steps build on this foundation with hardware-level visibility - ZFS pool health, SMART disk data, and thermal monitoring - using dedicated exporters that don't yet exist on the cluster.
Future Alerting Improvements
The current rule set covers the highest-value thresholds for a four-node homelab cluster. Several areas are not yet covered and are worth adding as the cluster matures:
Resource pressure - CPU saturation and memory pressure rules are missing. A node running at sustained 90%+ CPU or with heavy memory pressure and active swap is worth knowing about, even if it isn't immediately critical.
Disk I/O latency - the current storage rules cover capacity (volume fill) and availability (degraded/faulted). They don't cover performance. High I/O latency on a Longhorn volume can indicate a degrading disk before it fails outright. Node Exporter exposes node_disk_io_time_seconds_total which can be used to derive a latency alert.
API server availability - the Kubernetes API server is currently unmonitored. If it becomes unreachable the cluster effectively stops working, but nothing alerts. kube_apiserver_request_total with error rate thresholds is the standard approach.
etcd health - etcd is the backing store for all cluster state. Latency spikes, leader elections, and disk fsync times are meaningful early warning signals. The etcd metrics endpoint is available but not yet scraped.
These are deferred rather than forgotten - the hardware health posts (Parts 5 and 6) come first, followed by log aggregation. Alerting improvements will be revisited once the full observability stack is in place.
← Previous: IT-Tools on Bletchley
→ Next: k9s
Questions or suggestions? Leave a comment below or reach out at igor@vluwte.nl.