The Alert That Named a Pod
A Prometheus alert named a pod IP, not a machine. The 'broken' label turned out to have logged every cluster-wide reboot for three months.
Introduction
One morning in early September an Alertmanager email arrived: NVMeWearHigh, a drive at 82% used life. It carried ten labels, the drive's model and its serial number. The field that is supposed to say where, instance, said 10.244.1.2:9902. That is a pod IP. Bletchley has seven machines, and nothing in the alert told me which one to open.
The fix is two relabel rules, and the correct version of them was already sitting in the same Prometheus config, in a different scrape job. That part is quick to tell.
The part that surprised me came from looking backwards before fixing it. Ninety days of the broken label, exported and laid side by side, turned out to be recording something nobody had asked it to record: every moment the whole cluster went down. A label that could not name a machine had quietly been keeping a reboot log.
Whether 82% means what it says is a different question, and a different post. This one is about identity: why a DaemonSet's metrics can lose track of which node they came from, how to recover that history when it looks unrecoverable, what the churn was accidentally recording, and how to prove the fix using the exact event that used to break it.
🔬 This is part of the Technical Deep Dives series - technical concepts explained in depth, one real problem at a time.
- CloudNativePG Part 1
- The Alert That Named a Pod (you are here)
This post builds on the smartctl exporter from Cluster Observability Part 5 and the SMART alert rules from Part 6.
The Alert: Ten Labels and No Machine
![Alertmanager email from alerts@vluwte.nl with subject "[FIRING:1] NVMeWearHigh 10.244.1.2:9902 (/dev/nvme0 smartctl Unknown KINGSTON SNVS250G 50026B768…". The body lists labels alertname NVMeWearHigh, drive /dev/nvme0, instance 10.244.1.2:9902, job smartctl, model_family Unknown, model_name KINGSTON SNVS250G, serial_number 50026B76852581A8, severity warning, type nvme and user_capacity 250059350016, with the description "Drive /dev/nvme0 is at 82% used life." and the summary "NVMe wear indicator high on 10.244.1.2:9902".](https://vluwte.nl/content/images/2026/09/01-alert-email.png)
Read the labels as someone who has to act on them. drive=/dev/nvme0 is true on all seven nodes. model_name=KINGSTON SNVS250G narrows it to four. serial_number=50026B76852581A8 identifies the drive exactly, but only if I already know which machine it is in, which is the question I am trying to answer. The subject line even manages to include the model and most of the serial, and still no machine.
That leaves instance, and instance is 10.244.1.2:9902: the address of the exporter pod that happened to be scraping this drive at the time.
I had seen this before. When I tested the SMART alerts in Part 6, the second batch of test emails carried a pod IP too, and I wrote it down as a known limitation to fix later. It stayed a known limitation right up until the first alert I actually needed to act on.
Why instance Is a Pod IP
The scrape job for the exporter is hand-written, in the extraScrapeConfigs block of my Prometheus values file:
# apps/monitoring/prometheus/prometheus-values.yaml (extraScrapeConfigs), before
- job_name: smartctl
  kubernetes_sd_configs:
    - role: pod
  relabel_configs:
    - source_labels: [__meta_kubernetes_pod_label_app_kubernetes_io_name]
      action: keep
      regex: prometheus-smartctl-exporter
    - source_labels: [__meta_kubernetes_pod_ip]
      target_label: __address__
      replacement: '$1:9902'
role: pod makes every pod in the cluster a candidate target. The first rule keeps only the exporter's pods. The second points the scrape at the pod's IP on port 9902, where this exporter listens. That is the whole job.
What it never does is say where the pod is running. And when nothing in relabel_configs sets instance, Prometheus fills it in from __address__ after relabelling. So instance becomes <pod-ip>:9902, and that is what every alert, every legend and every email prints.
A pod IP is a bad name for a machine because it does not survive a restart. The address belongs to the pod's network sandbox, not to the pod object, and a node reboot gives the pod a new sandbox with a new address. The pod does not even have to be replaced: rock7's exporter pod was 83 days old on 5 September and had held four different addresses in that time.
To Prometheus a new instance value is a new time series. Same physical drive, same serial number in the labels, and every incarnation is treated as unrelated: a new colour in the legend, one line stopping, another starting somewhere else. Seven drives that never move, and a metric that cannot say so.
The Tell: More Series Than Drives
Once you know to look for it, the symptom is everywhere. This is the legend of the smartprom_percentage_used panel over 90 days:
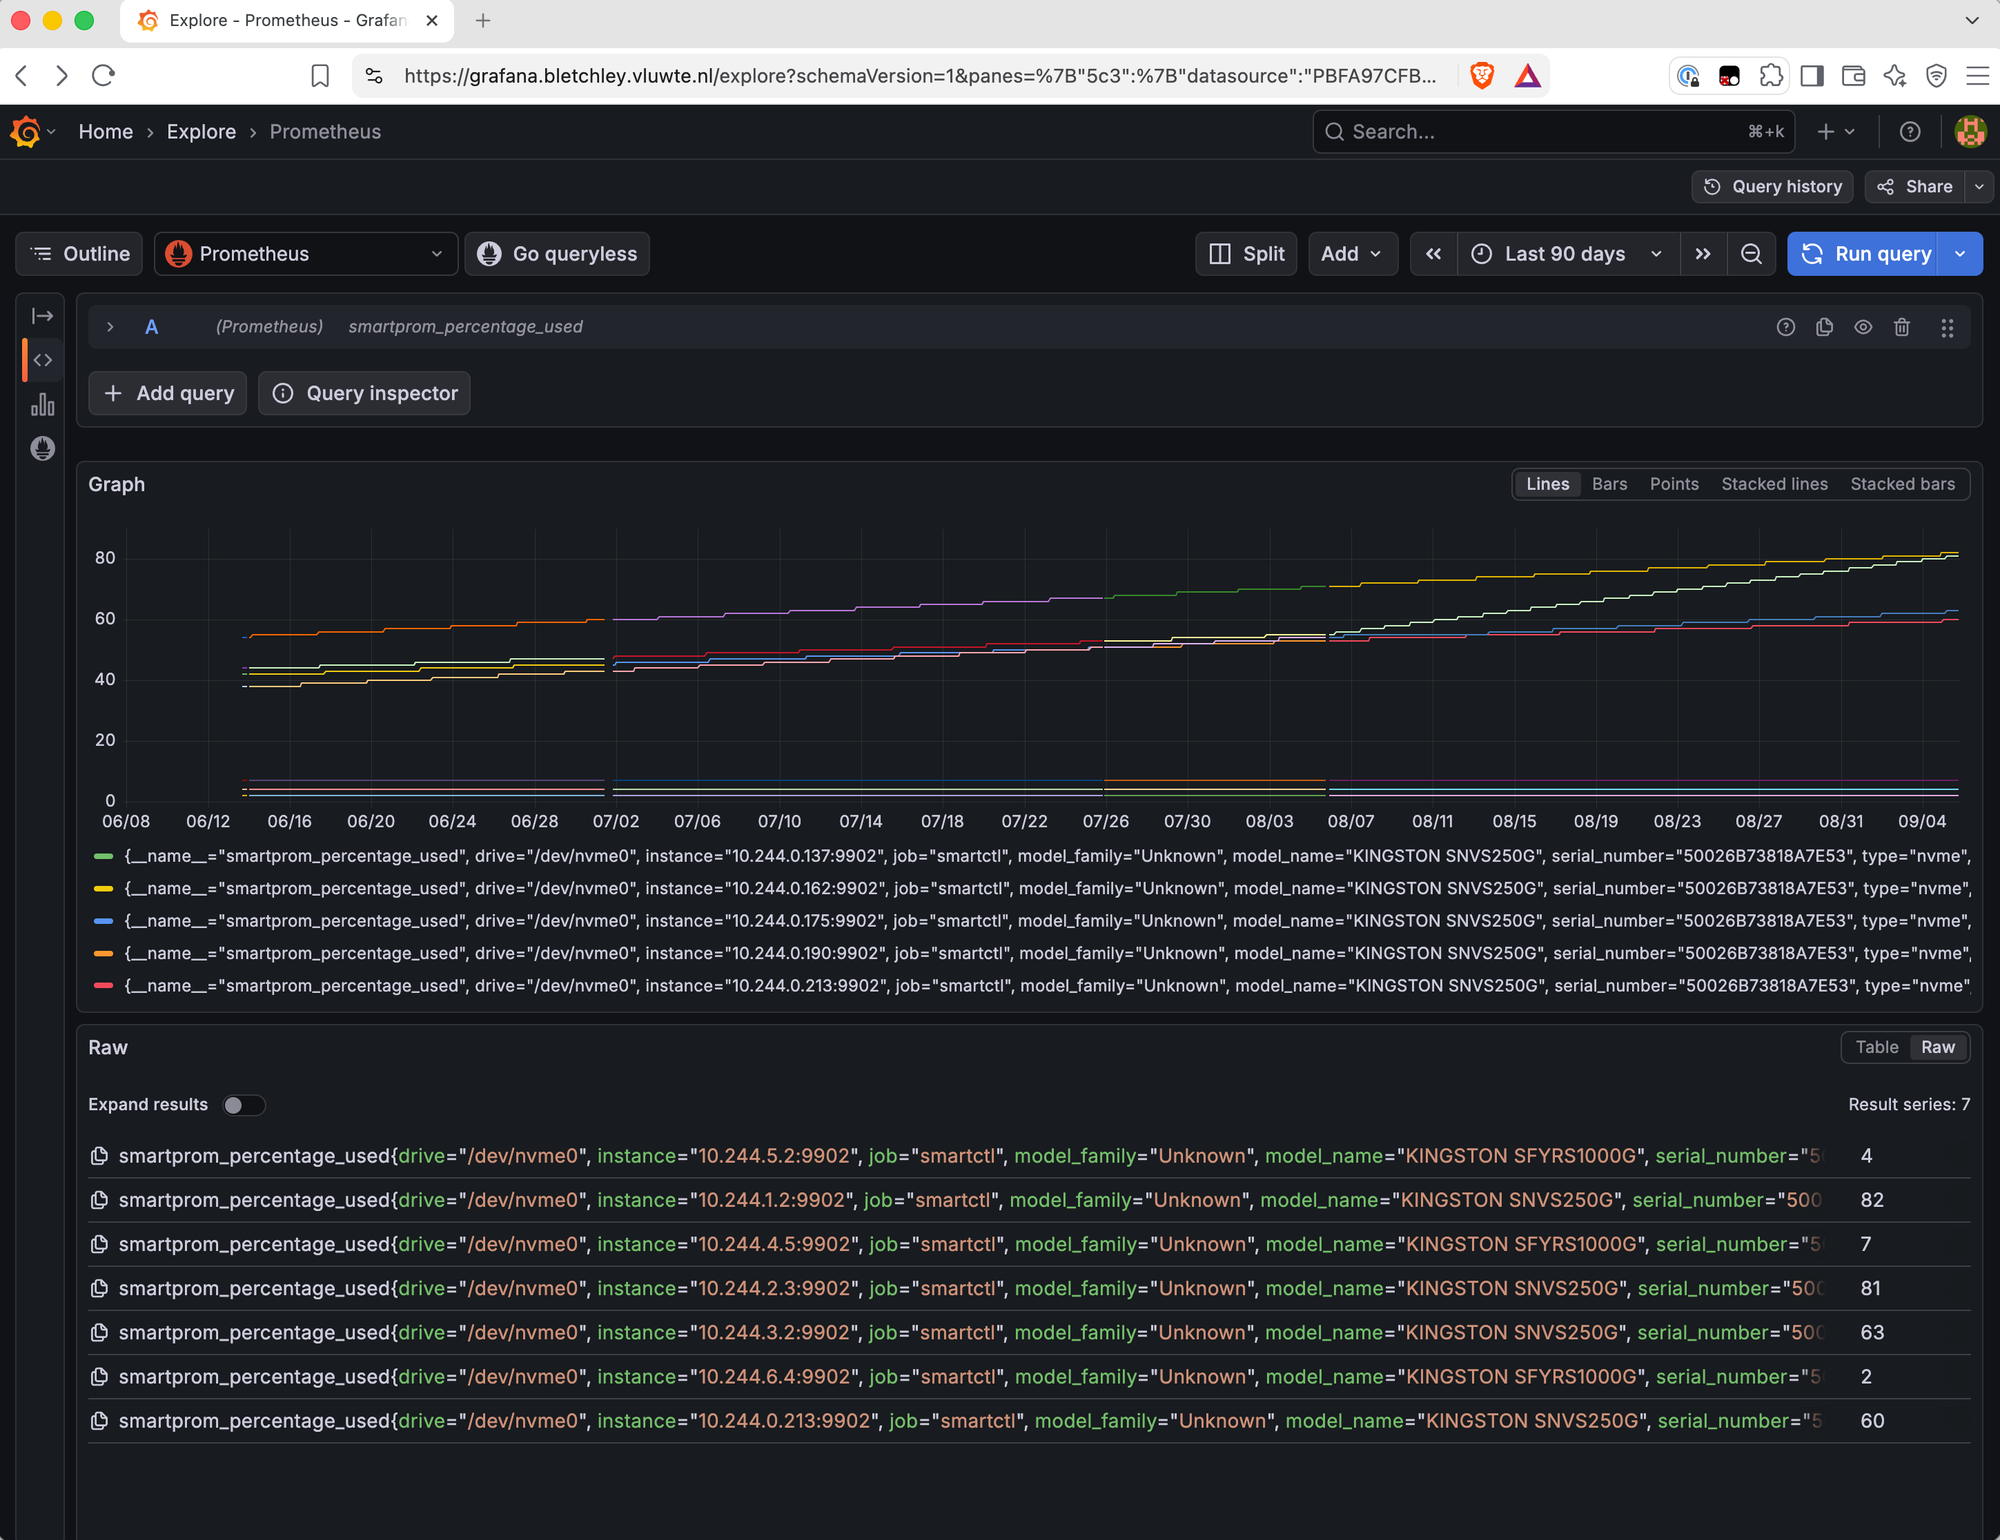
Five different instance values, all carrying serial 50026B73818A7E53. That is not five drives. It is one drive, seen through five pods.
The count shows up on the derivative of the same metric, where Grafana gives up drawing them all:
![Grafana Explore graph of deriv(smartprom_percentage_used[30d]) * 86400 over the last 90 days, with a warning badge reading "Showing only 20 series" and a button "Show all 35". The graph shows sharp spikes near 14 June and 2 July on otherwise flat lines. The Raw panel below reports "Result series: 7", with one row per drive including values of 0.2133, 0.3522, 0.8377 and 0.2871 for the four Kingston SNVS250G drives and 0 for the three SFYRS1000G drives.](https://vluwte.nl/content/images/2026/09/03-deriv-wear-rate.png)
Two numbers on that screenshot look like they disagree. The badge says 35; the Raw panel says 7. Both are right. The Raw panel shows the instant query: one series per drive, the ones being scraped at this moment. The graph shows the range, and over 90 days those same seven drives have been scraped under 35 different identities. The spikes on the graph are artifacts too: deriv fits a slope across the point where one series stops and another starts.
The write-rate query makes the churn even more visible, and even easier to misread:
![Grafana Explore graph of delta(smartprom_data_units_written[30d]) * 512000 / 30 over the last 90 days, showing overlapping triangular shapes: each line rises linearly, holds a flat plateau, then falls linearly back to zero, with peaks between roughly 2 and 10.5 billion bytes per day. The Raw panel lists seven current series with distinct serial numbers, four KINGSTON SNVS250G and three KINGSTON SFYRS1000G.](https://vluwte.nl/content/images/2026/09/04-delta-writes-triangles.png)
Every line is a triangle, and none of the triangles means anything happened to a drive. A 30-day delta over a series that lived for 18 days climbs for 18 days while the series is alive, holds flat while its whole lifetime fits inside the window, then falls for 18 days as the window slides off its start. The shapes are the lifetimes of the series, not the writes.
One more detail: the first screenshot I took that day said "Show all 34". A few hours later it said 35. The churn was live, and I watched it happen inside a single working session.
Whether the number is 34, 35 or something else depends on how and when you count. The defect is not the number. It is that there are more series than drives, and none of them join up.
The Fix Was Already in the File
The chart's own default job, kubernetes-service-endpoints, the one I first met in Cluster Observability Part 2, sits in the same ConfigMap, about forty lines away, and ends with exactly the rule the smartctl job is missing:
- action: replace
  source_labels: [__meta_kubernetes_pod_node_name]
  target_label: node
Kubernetes service discovery already knows which node every pod is on. It hands that to relabelling as __meta_kubernetes_pod_node_name, and all a job has to do is copy it into a label.
Side by side, the three jobs in that config that ought to carry a node label:
| Job | How it sets node |
|---|---|
kubernetes-service-endpoints (chart default) |
__meta_kubernetes_pod_node_name → node |
node-exporter (hand-written) |
regex on __address__ (rock1.vluwte.nl:9100 → rock1) |
smartctl (hand-written) |
nothing |
The node-exporter job is the one I rebuilt in the Prometheus storage overhead post, precisely because a static job does not get a node label for free. So I knew how to do this, and had done it twice, two different ways. The smartctl job is one omission in one job. It just happened to be the job behind the one alert I could not act on.
That is a more useful conclusion than "the config was sloppy", because it points at a concrete habit: every hand-written scrape job should be checked against what the chart's defaults do.
Recovering the Node From a Flannel /24
Fixing the label only helps from now on. The 90 days already in Prometheus are labelled by pod IPs that, in most cases, no longer exist. It looked as though the history was simply unattributable.
It isn't, because of how Flannel hands out addresses. Each node gets its own /24 out of 10.244.0.0/16, and every pod on that node gets an address from it. So the third octet of any pod IP names its node permanently, including for pods long gone. Kubernetes records the allocation on the node object:
kubectl get nodes -o custom-columns='NODE:.metadata.name,CIDR:.spec.podCIDR'
| Pod CIDR | Node | Pod CIDR | Node | |
|---|---|---|---|---|
| 10.244.0.0/24 | rock3 | 10.244.4.0/24 | rock5 | |
| 10.244.1.0/24 | rock1 | 10.244.5.0/24 | rock6 | |
| 10.244.2.0/24 | rock2 | 10.244.6.0/24 | rock7 | |
| 10.244.3.0/24 | rock4 |
The ranges are not in name order, so you need the table rather than a guess. With it, 10.244.1.2:9902 in the alert is rock1, and the five 10.244.0.x identities in the legend above are all rock3.
For reading old data in Grafana, label_replace can pull the octet out into its own label, so series can at least be grouped by it:
label_replace(smartprom_percentage_used, "node_cidr", "$1", "instance", "10\\.244\\.(\\d+)\\..*")
This is a reading aid for history, not a fix. It holds only while each node keeps its pod CIDR; a rebuilt node can be handed a different /24.
The reused-IP trap
There is one catch, and it is worse than an obvious break. Pod IPs are reused. rock2's exporter had 10.244.2.3 in June, lost it at the next reboot, and got the very same address back five weeks later.
To Prometheus that is the same series coming back. A graph keyed on instance shows one legend entry, one colour, a value of 47 before a five-week gap and 55 after it, and invites you to draw a line between them. Every other drive has an obvious seam where its identity changed. rock2 has a false continuity instead, which is much easier to believe.
The Twist: A Reboot Log Nobody Asked For
To get the history out of Prometheus in a form I could actually work with, I exported 90 days of smartprom_percentage_used to a wide CSV: one column per series, each column header carrying both the instance and the serial number. Laid out that way the churn becomes a staircase, and plotting each column's lifetime makes the pattern impossible to miss:
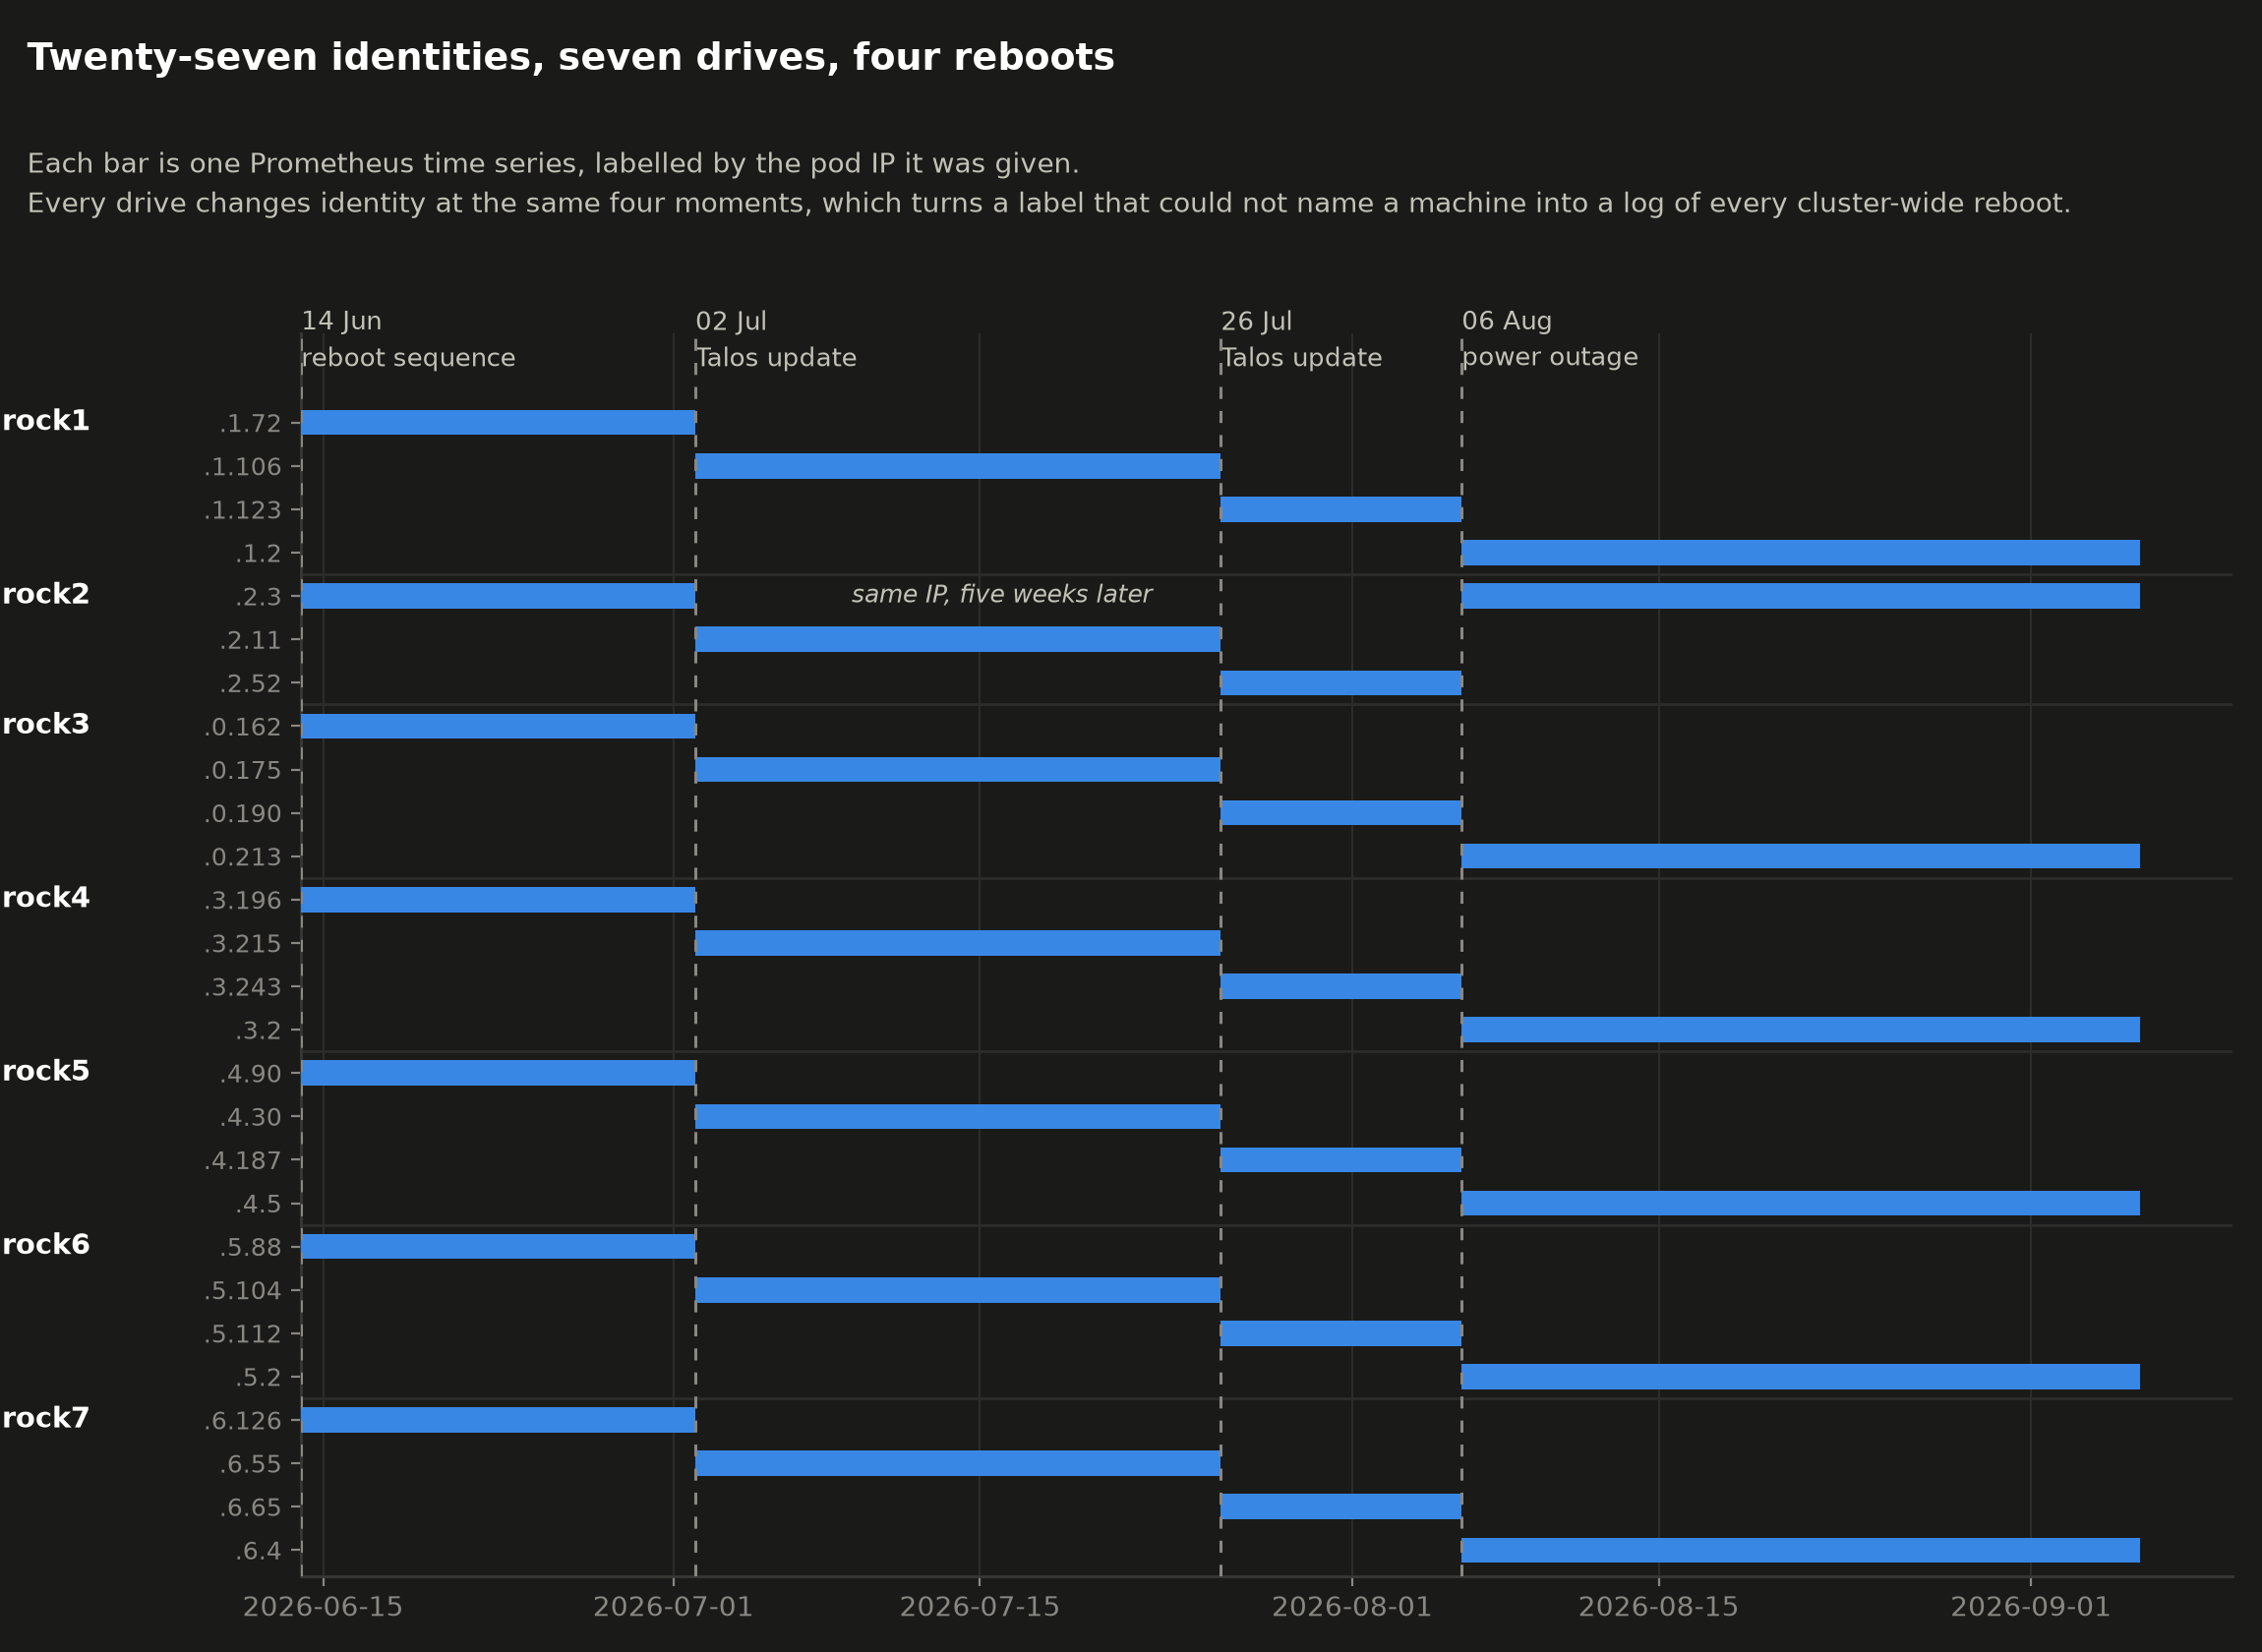
The columns do not switch on and off at random. All seven drives change identity on exactly the same four dates:
| Generation | Window | Days | Cause | Kind |
|---|---|---|---|---|
| 1 | 2026-06-14 → 07-01 | 18 | reboot sequence (the one that broke Garage) | graceful |
| 2 | 2026-07-02 → 07-25 | 24 | Talos / Kubernetes update | graceful |
| 3 | 2026-07-26 → 08-05 | 11 | Talos / Kubernetes update | graceful |
| 4 | 2026-08-06 → 09-10 | 36 | power outage: a short circuit in the house (ended by the fix) | unclean |
A DaemonSet pod gets a new address when its node reboots. One node rebooting changes one drive's identity. All seven changing on the same day only happens when every node reboots: a rolling Talos update, or the power going out. The label that could not name a machine is a complete record of every cluster-wide reboot in the retention window. Nobody designed it, and nobody would have thought to ask it.
The same finding in one line of PromQL
The Gantt chart comes from an exported CSV and a script I wrote, which is two places for a mistake to hide. Prometheus can reproduce it on its own by counting how many series each serial number has carried:
count by (serial_number) (count_over_time(smartprom_percentage_used[90d]))
![Grafana Explore range query of count by (serial_number) (count_over_time(smartprom_percentage_used[90d])) over 90 days. The lines form a staircase: starting at 1, stepping to 2 around 14 June, 3 around 2 July, 4 around 26 July, then on 6 August splitting three ways: one line to 6, most lines to 5, and one line staying at 4. The Raw panel lists seven serial numbers with values 6 (50026B73818A7E53), 5 (50026B76852581A8), 4 (50026B76852581A0), 5 (50026B73818A7CB5), 5 (50026B768634B64E), 5 (50026B768634B6DF) and 5 (50026B76864C4D13).](https://vluwte.nl/content/images/2026/09/13-series-count-per-serial.png)
Graphed as a range query it is a staircase, one step per reboot. The final counts are 6, 5, 4, 5, 5, 5 and 5: 35 in total, the same 35 as the "Show all 35" badge, arrived at by a completely different route.
Five per drive is four reboots plus the identity each drive already had when the retained history begins. Two drives break the pattern, and both are explained by the story above:
- rock3's drive (
…7E53) has six. It picked up two identities on the day of the outage, one of them short-lived. - rock2's drive (
…81A0) has four. It rebooted as often as all the others. It simply got10.244.2.3back on 6 August, so Prometheus counted one identity where the other drives got two. Look at the staircase on 6 August: every line steps up except one.
That is the reused-IP trap showing up as a number that does not match its neighbours, which is a lot more convincing than a caveat in prose.
It also explains why the Gantt chart says twenty-seven and not thirty-five. The CSV was exported at a one-day step, and eight short-lived identities never landed on a daily sample, so they dropped out of the export. Thirty-five is the full count; twenty-seven are the ones that lived long enough to matter.
A bug in my own figure
The first version of that Gantt chart drew each series as a single bar from its first sample to its last. That painted rock2's 10.244.2.3 straight through its five-week gap, and erased the reused IP, the one thing the figure most needed to show. It now draws each contiguous run as its own bar. A chart that summarises a series by its endpoints quietly deletes the interesting middle.
Applying the Fix
Two relabel rules
The fix goes in the values file, not in the rendered ConfigMap:
@@ -1068,6 +1068,12 @@ extraScrapeConfigs: |
       - source_labels: [__meta_kubernetes_pod_ip]
         target_label: __address__
         replacement: '$1:9902'
+      # node identity
+      - source_labels: [__meta_kubernetes_pod_node_name]
+        target_label: node
+      # stop the churn: instance becomes the node, stable across pod restarts
+      - source_labels: [__meta_kubernetes_pod_node_name]
+        target_label: instance
Both rules rely on relabelling's defaults (action: replace, regex: (.*), replacement: $1), so the node name is copied across unchanged. And because instance only falls back to __address__ when relabelling has not set it, the second rule sticks.
I kept both labels even though they carry the same value. node is what lets these metrics join against node-exporter's (on(node)), which already has it. instance is what Alertmanager prints in the subject line, and what the NVMeWearHigh summary template uses, so the next time it fires it should say rock1 without my touching the rule. One label serves the dashboards; the other serves the email.
Applied with the usual pinned upgrade:
helm upgrade prometheus prometheus-community/prometheus \
  -n monitoring --version 29.21.0 \
  -f apps/monitoring/prometheus/prometheus-values.yaml
Watching the seam
To see whether the relabel had taken:
group by (node, instance) (up{job="smartctl"})
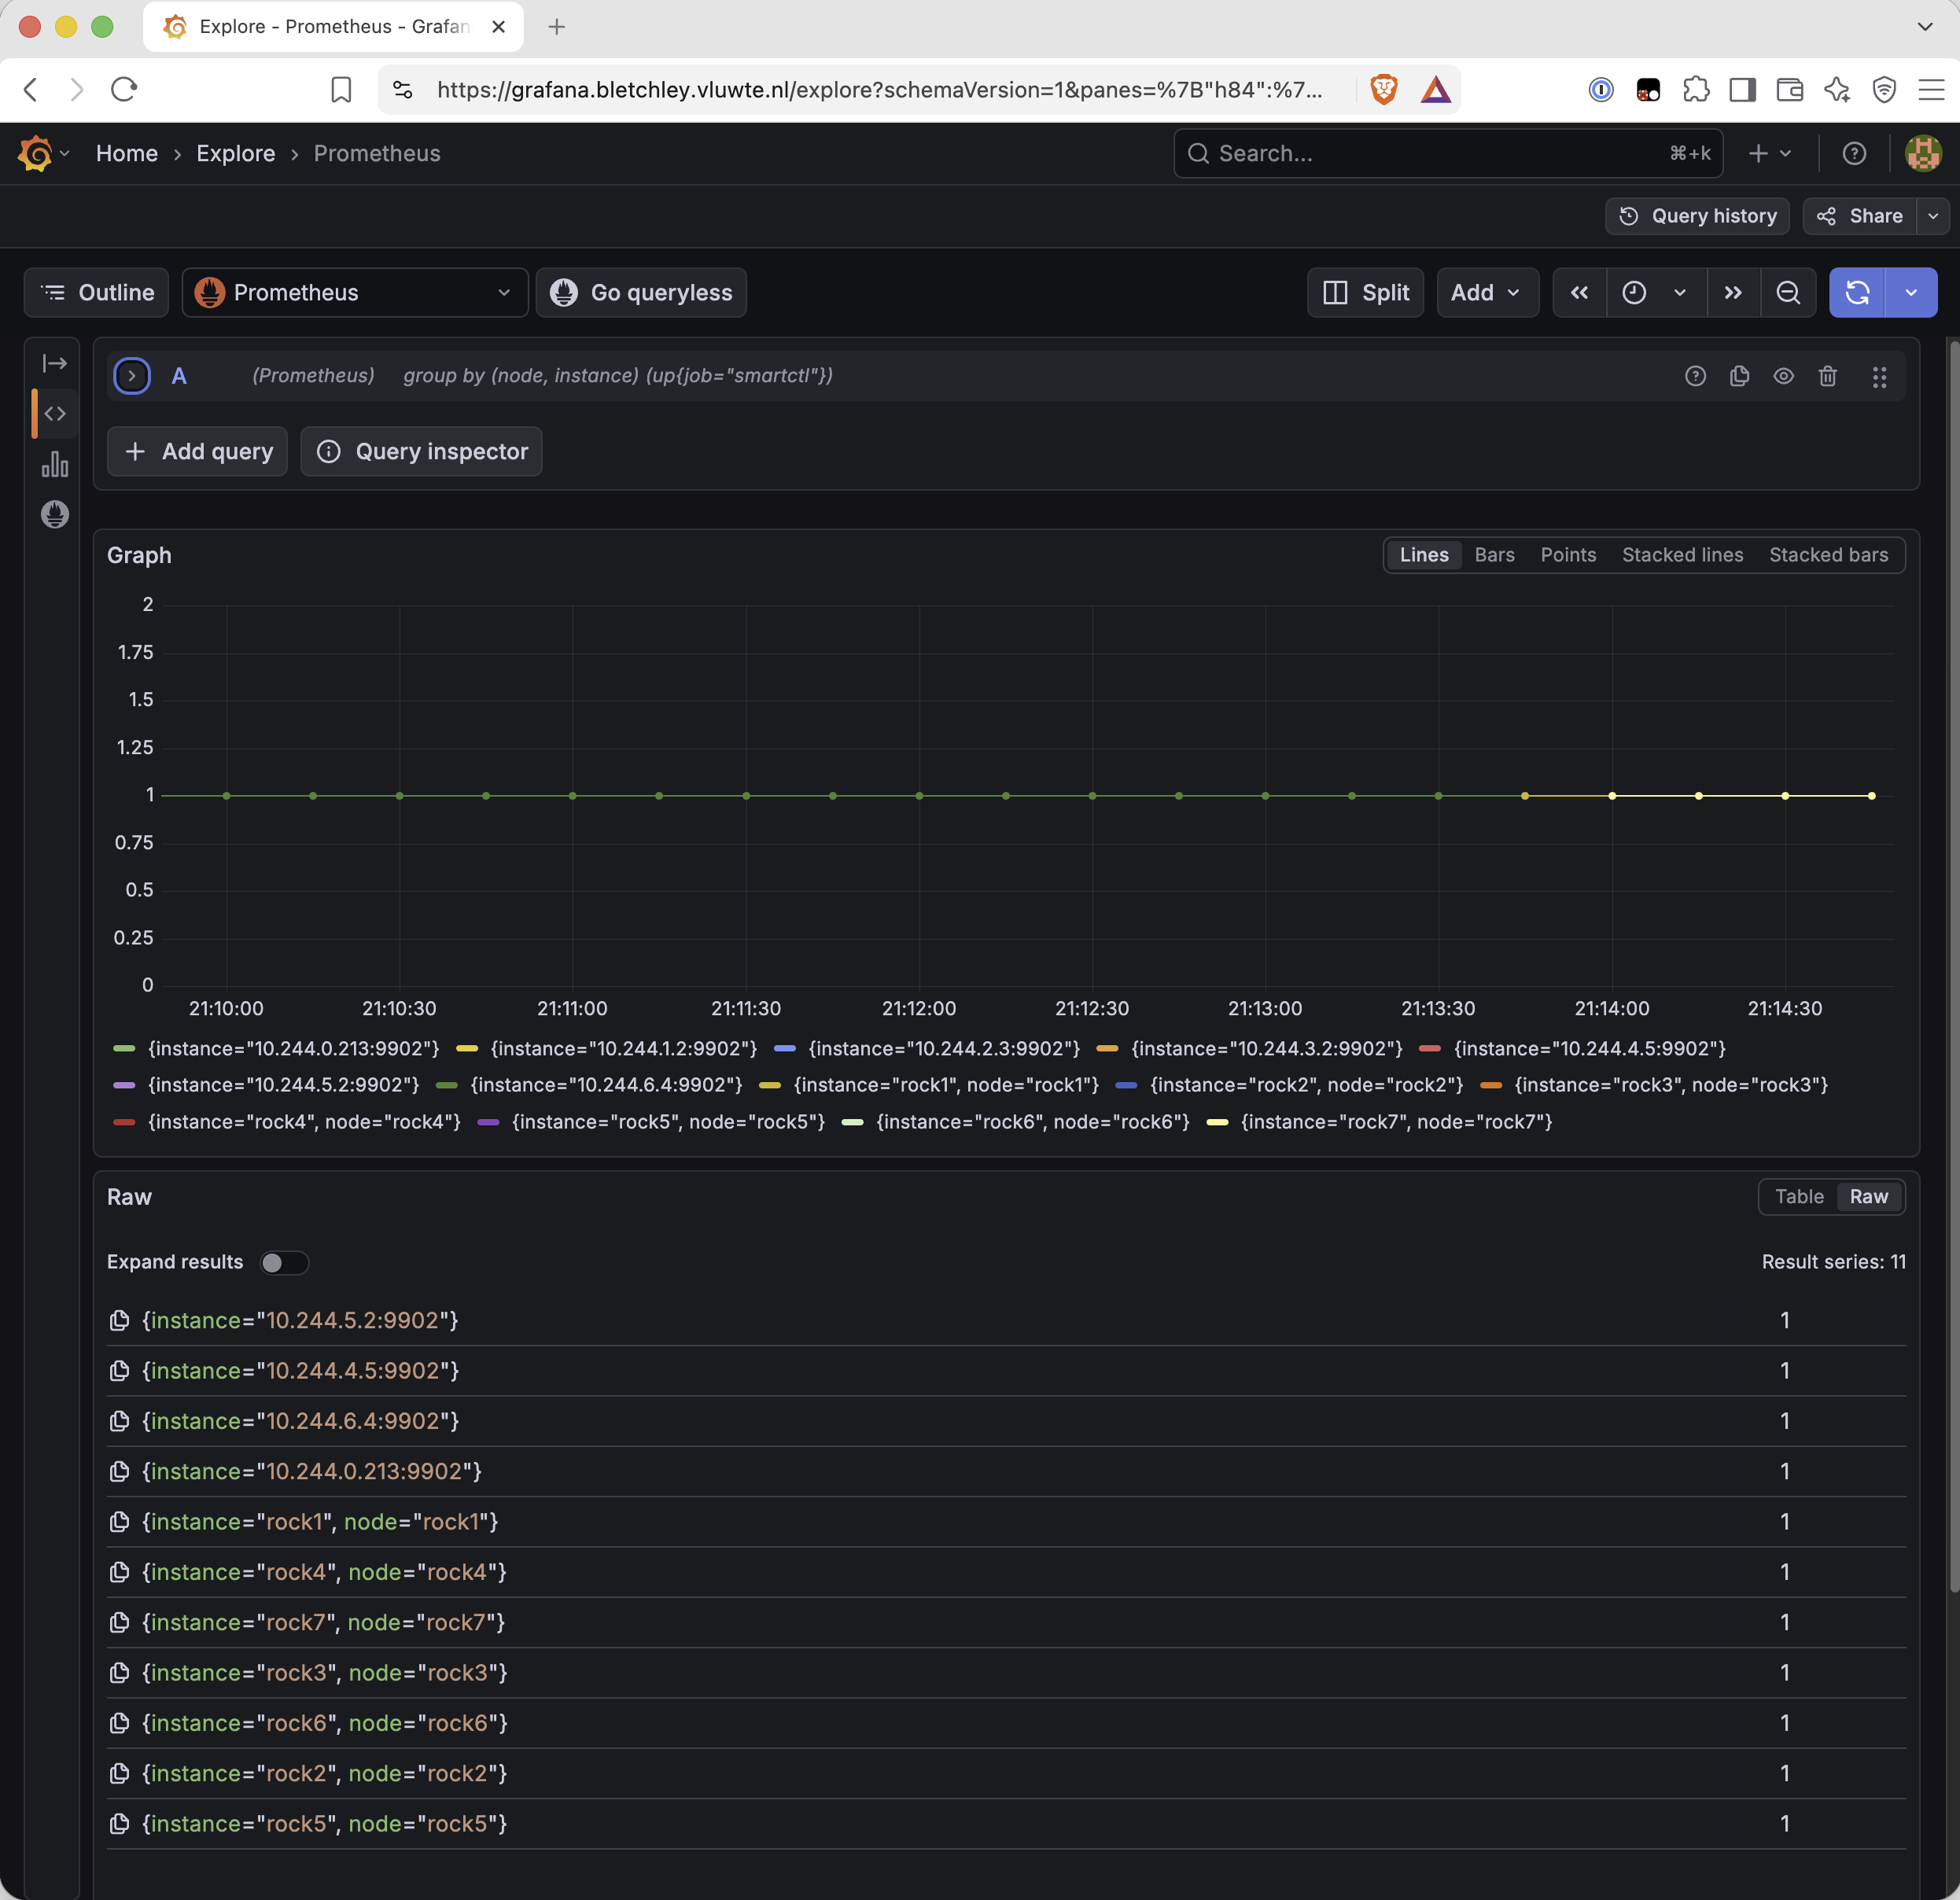
Immediately after the upgrade this returned 11 series rather than 7. That is the changeover itself: seven new node-named series, plus four of the old pod-IP series that had not yet dropped out of the query. Prometheus does not make a series vanish from an instant query the moment its target disappears. Five minutes later it was a clean seven.
Rewriting instance means old and new are different series, so every graph now has a seam. For the record: 10 September 2026, around 21:13 CEST.
Proving it with a restart
Seven series with the right names is a good sign, but it is not proof. The defect was never how the series looked on the day; it was that a restart minted new ones. The test is to cause exactly that event and see what happens.
First, a baseline that only counts the new world. The old series carry no node label, so {node!=""} isolates the post-fix series without waiting for the old ones to age out:
count by (serial_number) (count_over_time(smartprom_percentage_used{node!=""}[15m]))
![Grafana Explore graph of count by (serial_number) (count_over_time(smartprom_percentage_used{node!=""}[15m])) from about 20:57 to 21:27. The line starts at about 21:13 and is flat at 1. The Raw panel shows seven serial numbers, each with value 1.](https://vluwte.nl/content/images/2026/09/09a-restart-before.png)
Flat at 1 for all seven serials. On its own that proves nothing: it reads 1 because there has only been one incarnation so far, not because restarts have stopped minting new ones. So, the restart:
$ date && kubectl -n monitoring rollout restart daemonset smartctl-exporter-prometheus-smartctl-exporter-0
Thu Sep 10 21:30:03 CEST 2026
daemonset.apps/smartctl-exporter-prometheus-smartctl-exporter-0 restarted
The DaemonSet rolled one node at a time and finished around 21:33. Every pod came back with a new address:
| Node | Was | Now |
|---|---|---|
| rock1 | 10.244.1.2 | 10.244.1.188 |
| rock2 | 10.244.2.3 | 10.244.2.80 |
| rock3 | 10.244.0.213 | 10.244.0.238 |
| rock4 | 10.244.3.2 | 10.244.3.24 |
| rock5 | 10.244.4.5 | 10.244.4.85 |
| rock6 | 10.244.5.2 | 10.244.5.131 |
| rock7 | 10.244.6.4 | 10.244.6.166 |
This is precisely the event that used to start a new generation: seven new identities at once, 35 series becoming 42. It also re-demonstrates the Flannel mapping on fresh data: seven new addresses, and every one of them kept its node's third octet.
![Grafana Explore graph of the same query, count by (serial_number) (count_over_time(smartprom_percentage_used{node!=""}[15m])), from about 21:17 to 21:47. The line is flat at 1 across the entire range, with no step at the 21:30 restart. The Raw panel shows the same seven serial numbers, each with value 1.](https://vluwte.nl/content/images/2026/09/09b-restart-after.png)
Flat at 1 straight through the restart. No step, no new series.
The detail that makes this proof rather than a line that happens to be flat is the window. The rollout finished around 21:33 and the graph runs to about 21:47, so its later points each count over a 15-minute window like 21:30–21:45, one that contains the restart and the whole roll. If any pod had minted a new series, those points would read 2. They read 1.
A side note on the restart output: it also printed a long Pod Security warning aboutprivileged,hostPath,runAsUser=0and so on. That is unrelated to the relabel. Themonitoringnamespace carries the restricted Pod Security labels in warn mode, and this exporter needs a privileged container and ahostPathon/devto read SMART data at all (covered in Part 5). It warned and restarted anyway, but the same DaemonSet would fail outright if that namespace were ever switched toenforce.
The Evidence Has an Expiry
Now that identity survives a restart, the reboot log has stopped being written. Every one of those 35 series is finished; nothing will ever be appended to them again. And Prometheus keeps 120 days, which is a hard ceiling. The first generation will be the first to go, and within about four months the whole record will have aged out.
It existed by accident, and it does not keep. That is why I exported it to CSV before applying the fix, and why the same four dates now live in a Cluster Event Log in my cluster-state document. If I want a reboot log, the reliable way to have one is to write it down on purpose.
The Same Alert, Again
At 22:14 that evening, an hour after the seam, the alert fired again:
![Alertmanager email from alerts@vluwte.nl received at 22:14 with subject "[FIRING:1] NVMeWearHigh rock1 (/dev/nvme0 smartctl Unknown KINGSTON SNVS250G rock1 50026B7685258…". The red header reads "1 alert for alertname=NVMeWearHigh instance=rock1". The body lists labels alertname NVMeWearHigh, drive /dev/nvme0, instance rock1, job smartctl, model_family Unknown, model_name KINGSTON SNVS250G, node rock1, serial_number 50026B76852581A8, severity warning, type nvme and user_capacity 250059350016, with the description "Drive /dev/nvme0 is at 84% used life." and the summary "NVMe wear indicator high on rock1".](https://vluwte.nl/content/images/2026/09/16-alert-email-after.png)
Same rule, same drive, same serial number, and not one character of the alert rule or the email template changed. The header now reads instance=rock1, the summary says NVMe wear indicator high on rock1, and node=rock1 sits in the middle of the labels. rock1 even appears twice in the subject line, once for each label. Slightly redundant, and a lot more useful than a pod IP.
It fired again, rather than carrying on from the original alert, because the relabel produced new series. As far as Prometheus is concerned this was a brand-new alert, so it had to sit through the rule's for: 1h from scratch: pending from 21:13, firing at 22:14.
That timing is a second, quieter proof. The rollout restart at 21:30 landed in the middle of that hour and did not reset it. Before the fix, a restart would have created a new series and started the hour over again.
The first email told me what was wrong and not where. This one tells me both. It also says 84% where the first one said 82%, and what that number is really counting is the next post.
Lessons Learned
- A DaemonSet's hand-written scrape job needs a node relabel.
role: podknows which node every pod is on; nothing uses that unless a rule copies it into a label. Check hand-written jobs against what the chart's defaults already do. - Pod IPs name nothing durable, but on Flannel the third octet names a node. History that looks unattributable often isn't.
- Reused IPs are worse than new ones. A new address leaves a visible seam. A reused one produces a false continuity that looks like data.
- Churned labels are information. Series that start and stop together are a record of what restarted them: in this case, every cluster-wide reboot for three months. But it is an accidental record, and it expires.
- Prove a fix with the event that used to break it. A flat line after a config change is a hopeful sign. A flat line through a rollout restart, over a window that contains the whole roll, is proof.
What's Next
The alert now tells me where to go. The next question is whether I need to go there at all. rock1's drive reports 84% used life, and that number does not quite mean what it appears to mean. That is the next deep dive.
Closer to home, the SMART dashboard needs rebuilding around node names now that it has them, and exporting to git this time, rather than living only in Grafana's database.
The pattern underneath this is one I keep running into. helm list for this exporter still reports APP VERSION v0.14.0, for an exporter that is not the one running. The smartctl scrape job named a pod instead of a machine. Both look like identifiers, and neither names the thing you actually need to find.
← Previous: CloudNativePG Part 8
Questions or suggestions? Leave a comment below or reach out at igor@vluwte.nl.