Wear Without Writes
One NVMe's reported wear sped up 4.5× the evening its writes almost stopped. Its spare blocks and error counters say the flash never noticed.
Introduction
At the end of The Wear That Wasn't one drive refused to fit. rock2 has the same model and firmware as rock1, so it should report wear at the same rate. It didn't. For eleven weeks it ran at about half rock1's rate. Then, on the evening a short circuit took the cluster down, it jumped to more than double. On that same evening its writes fell to almost nothing.
More reported wear from a drive that had nearly stopped working needs an explanation. I had one ready, and six more weeks of data ruled it out.
What is left is simpler: nothing on rock2 wore out. Two things are easy to mix up here, so I will keep them apart. Wear is what physically happens to the flash. Reported wear is percentage_used, the number the drive's firmware calculates and reports as used life. rock2's reported wear changed speed at the power cut; its actual wear, as far as anything can measure it, did not. On 27 September its reported wear reached 100%, on a drive that has written 2.7% of the data it is rated for and has never retired a single block.
🔬 This is part of the Technical Deep Dives series - technical concepts explained in depth, independent of the homelab journey.
- The Disk With No S.M.A.R.T.
- Wear Without Writes (you are here)
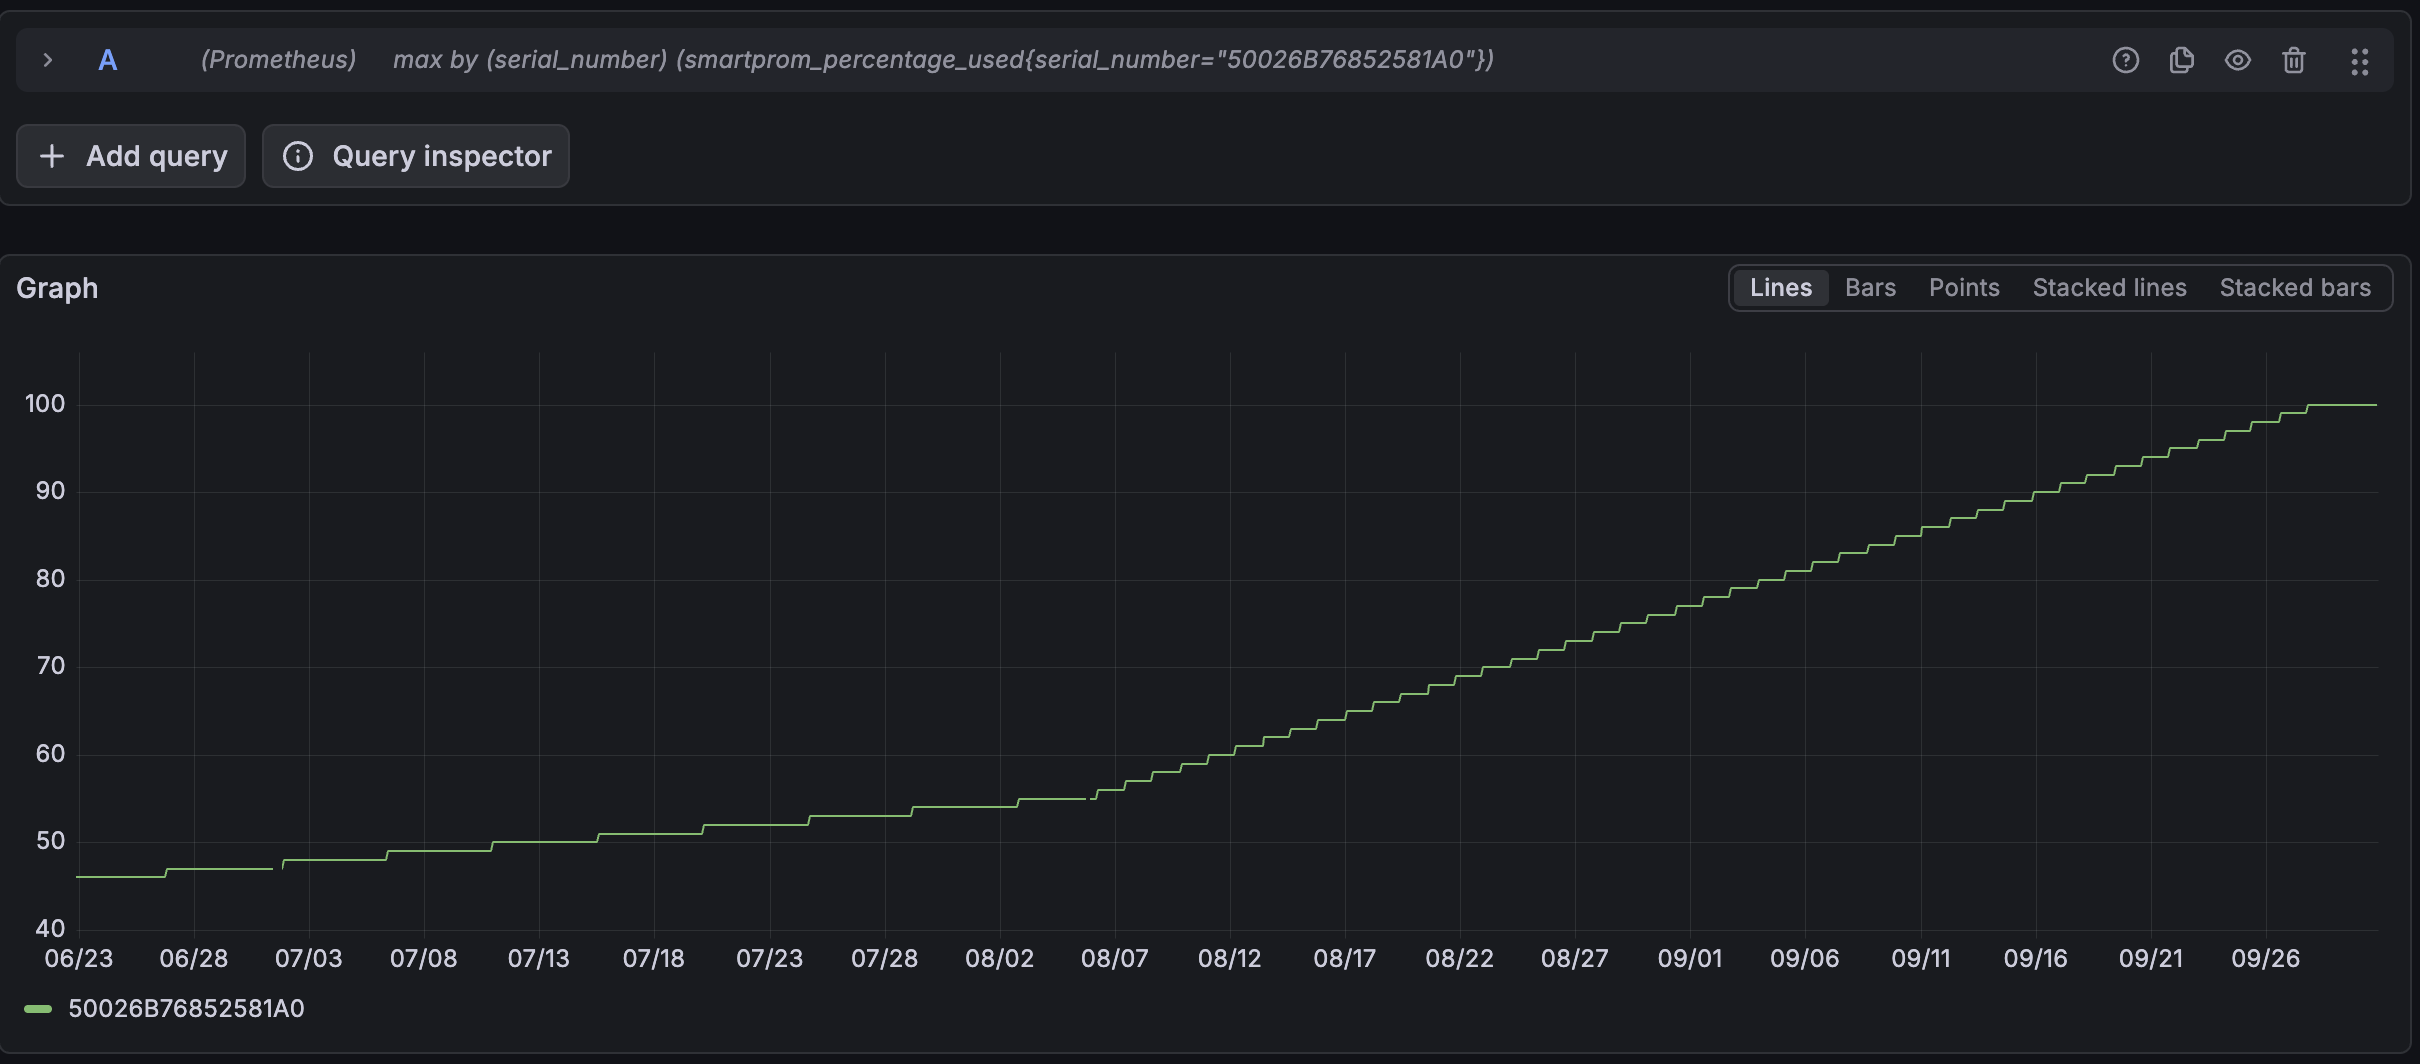
Six more weeks, and no decay
The power cut was on the evening of 5 August. (Last time I dated it 6 August, which is the first full day after.) These are rock2's numbers on either side of it:
| Period | Writes per day | Reported wear per day |
|---|---|---|
| 12 Jun – 5 Aug | ~12.9 GB | ~0.19 points |
| 6 Aug – 19 Sep | ~0.07 GB | ~0.84 points |
| Change | ~190× less | ~4.5× more |
# Reported wear
smartprom_percentage_used{type="nvme",serial_number="50026B76852581A0"}

# Data written, as a percentage of the rated 60 TB
(smartprom_data_units_written{serial_number="50026B76852581A0"} * 512000) / (60 * 1e12) * 100
My first theory involved TRIM. When Longhorn moved the replica off rock2, several gigabytes on the drive became garbage. The nightly TRIM job tells the drive which blocks are free, and the drive then cleans them up in the background by erasing flash, which is actual wear.
Even if that happened, it can only explain a one-off burst: a fixed amount of freed space, cleaned up once. For scale, erasing every block of the 250 GB drive a single time would use about 0.4% of its rated 60 TB. A burst like that would show up as a bump in reported wear that flattens out again. The graph shows a new steady rate instead: a straight line for six weeks, adding 45 points since the power cut, about a hundred times what even a full-drive cleanup could account for.
Both lines also bend at exactly the same moment: writes drop and reported wear speeds up together. Whatever happened, it happened once, on that evening.
Almost nothing, measured twice
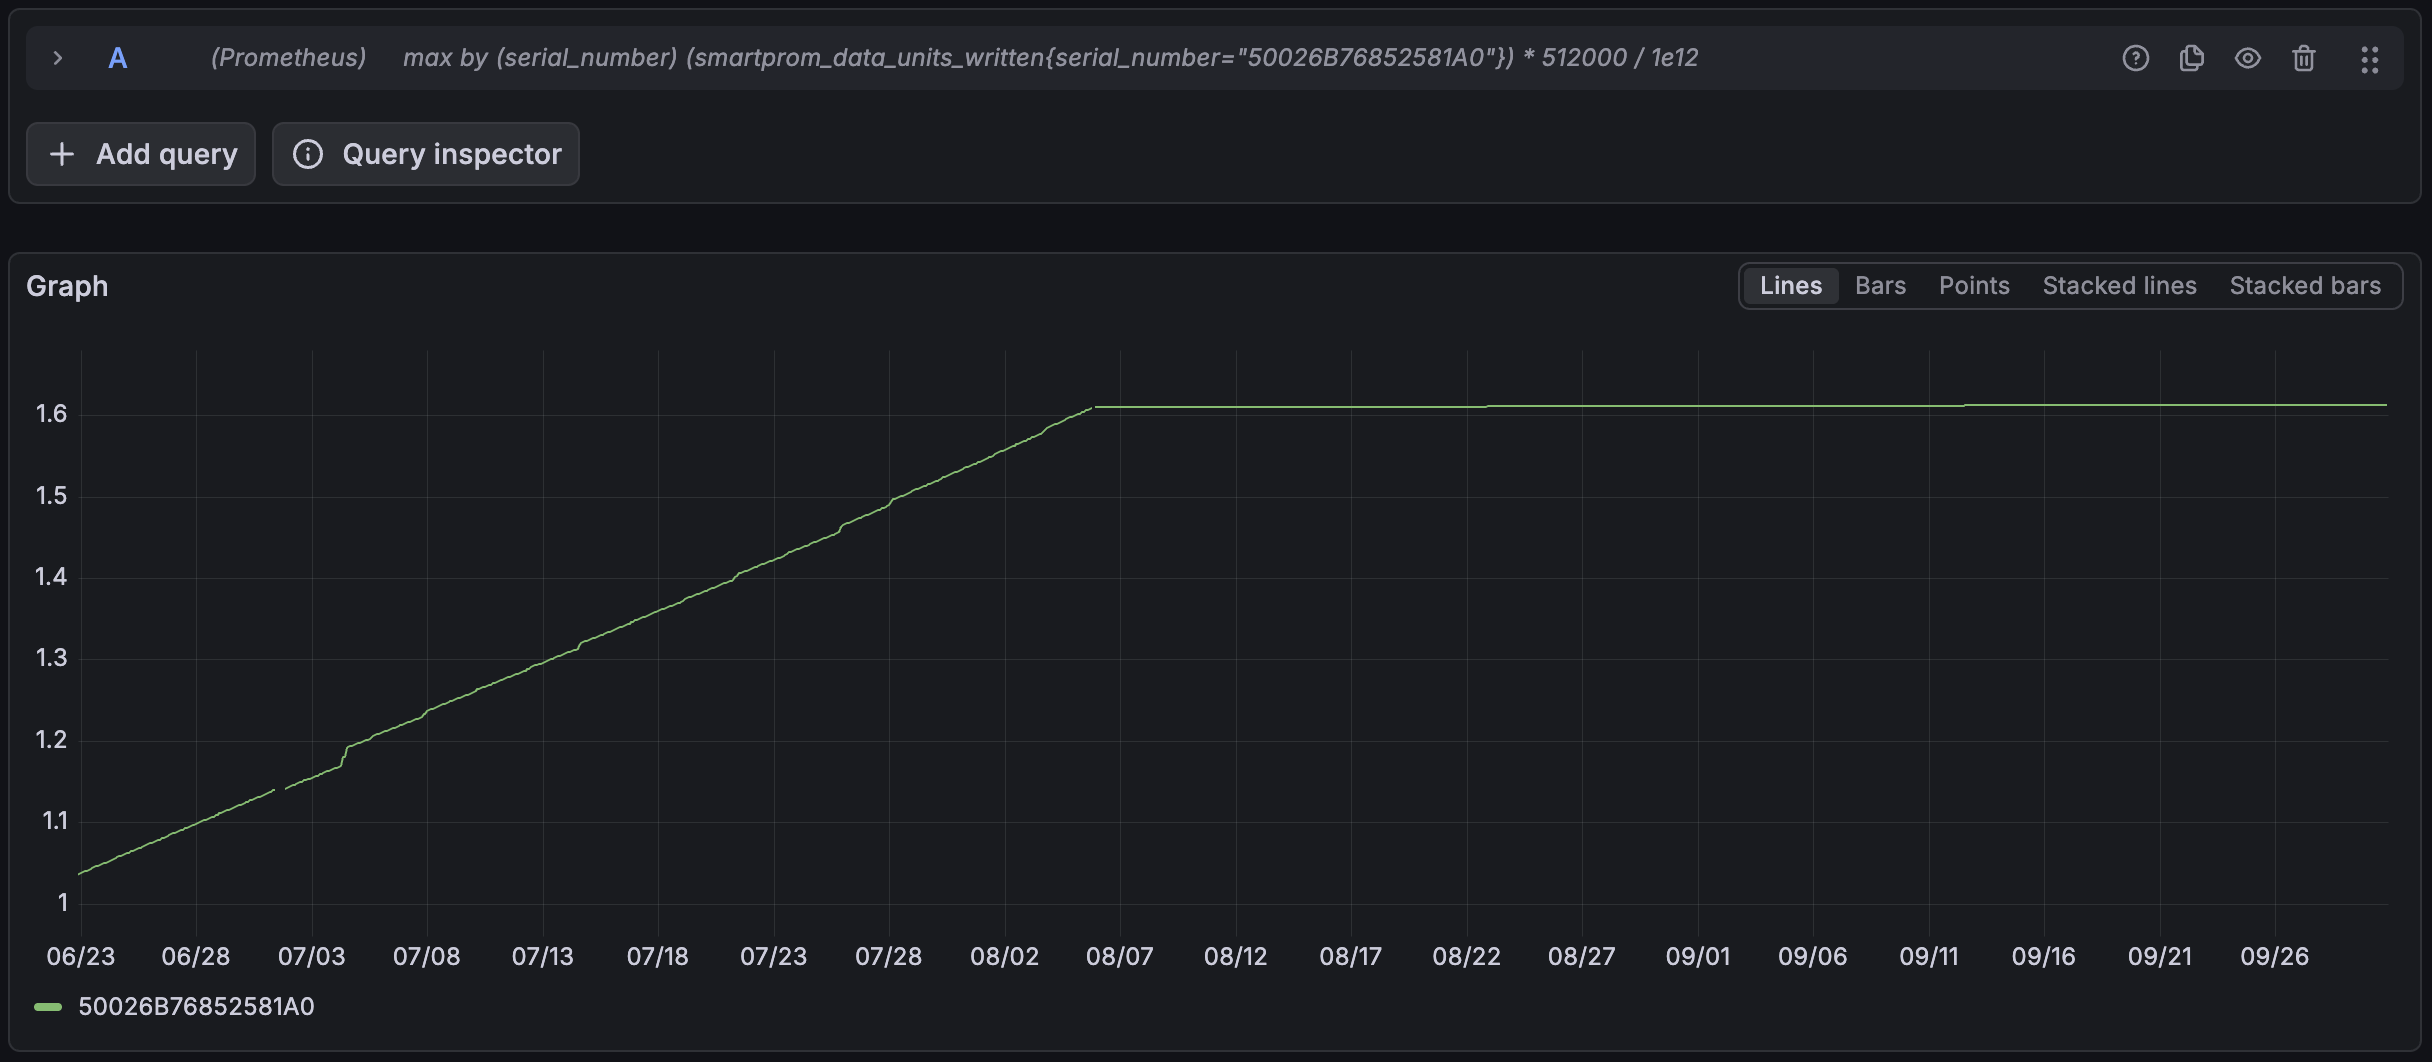
Careful with this graph. After 5 August it looks flat, but it is not zero. The drive's own counter works out at about 70 MB a day, and the operating system, counting from its side, says 55 MB. Either way it is tiny: the other drives on the same board write 7 to 8 GB a day.
Reads were the last place physical wear could hide. Reading the same flash over and over eventually forces the drive to rewrite it, known as read disturb, and that costs endurance without any writes from the host. So I checked the reads too:
deriv(max by (serial_number) (smartprom_data_units_read)[1d:5m]) * 86400 * 512000 / 1e9
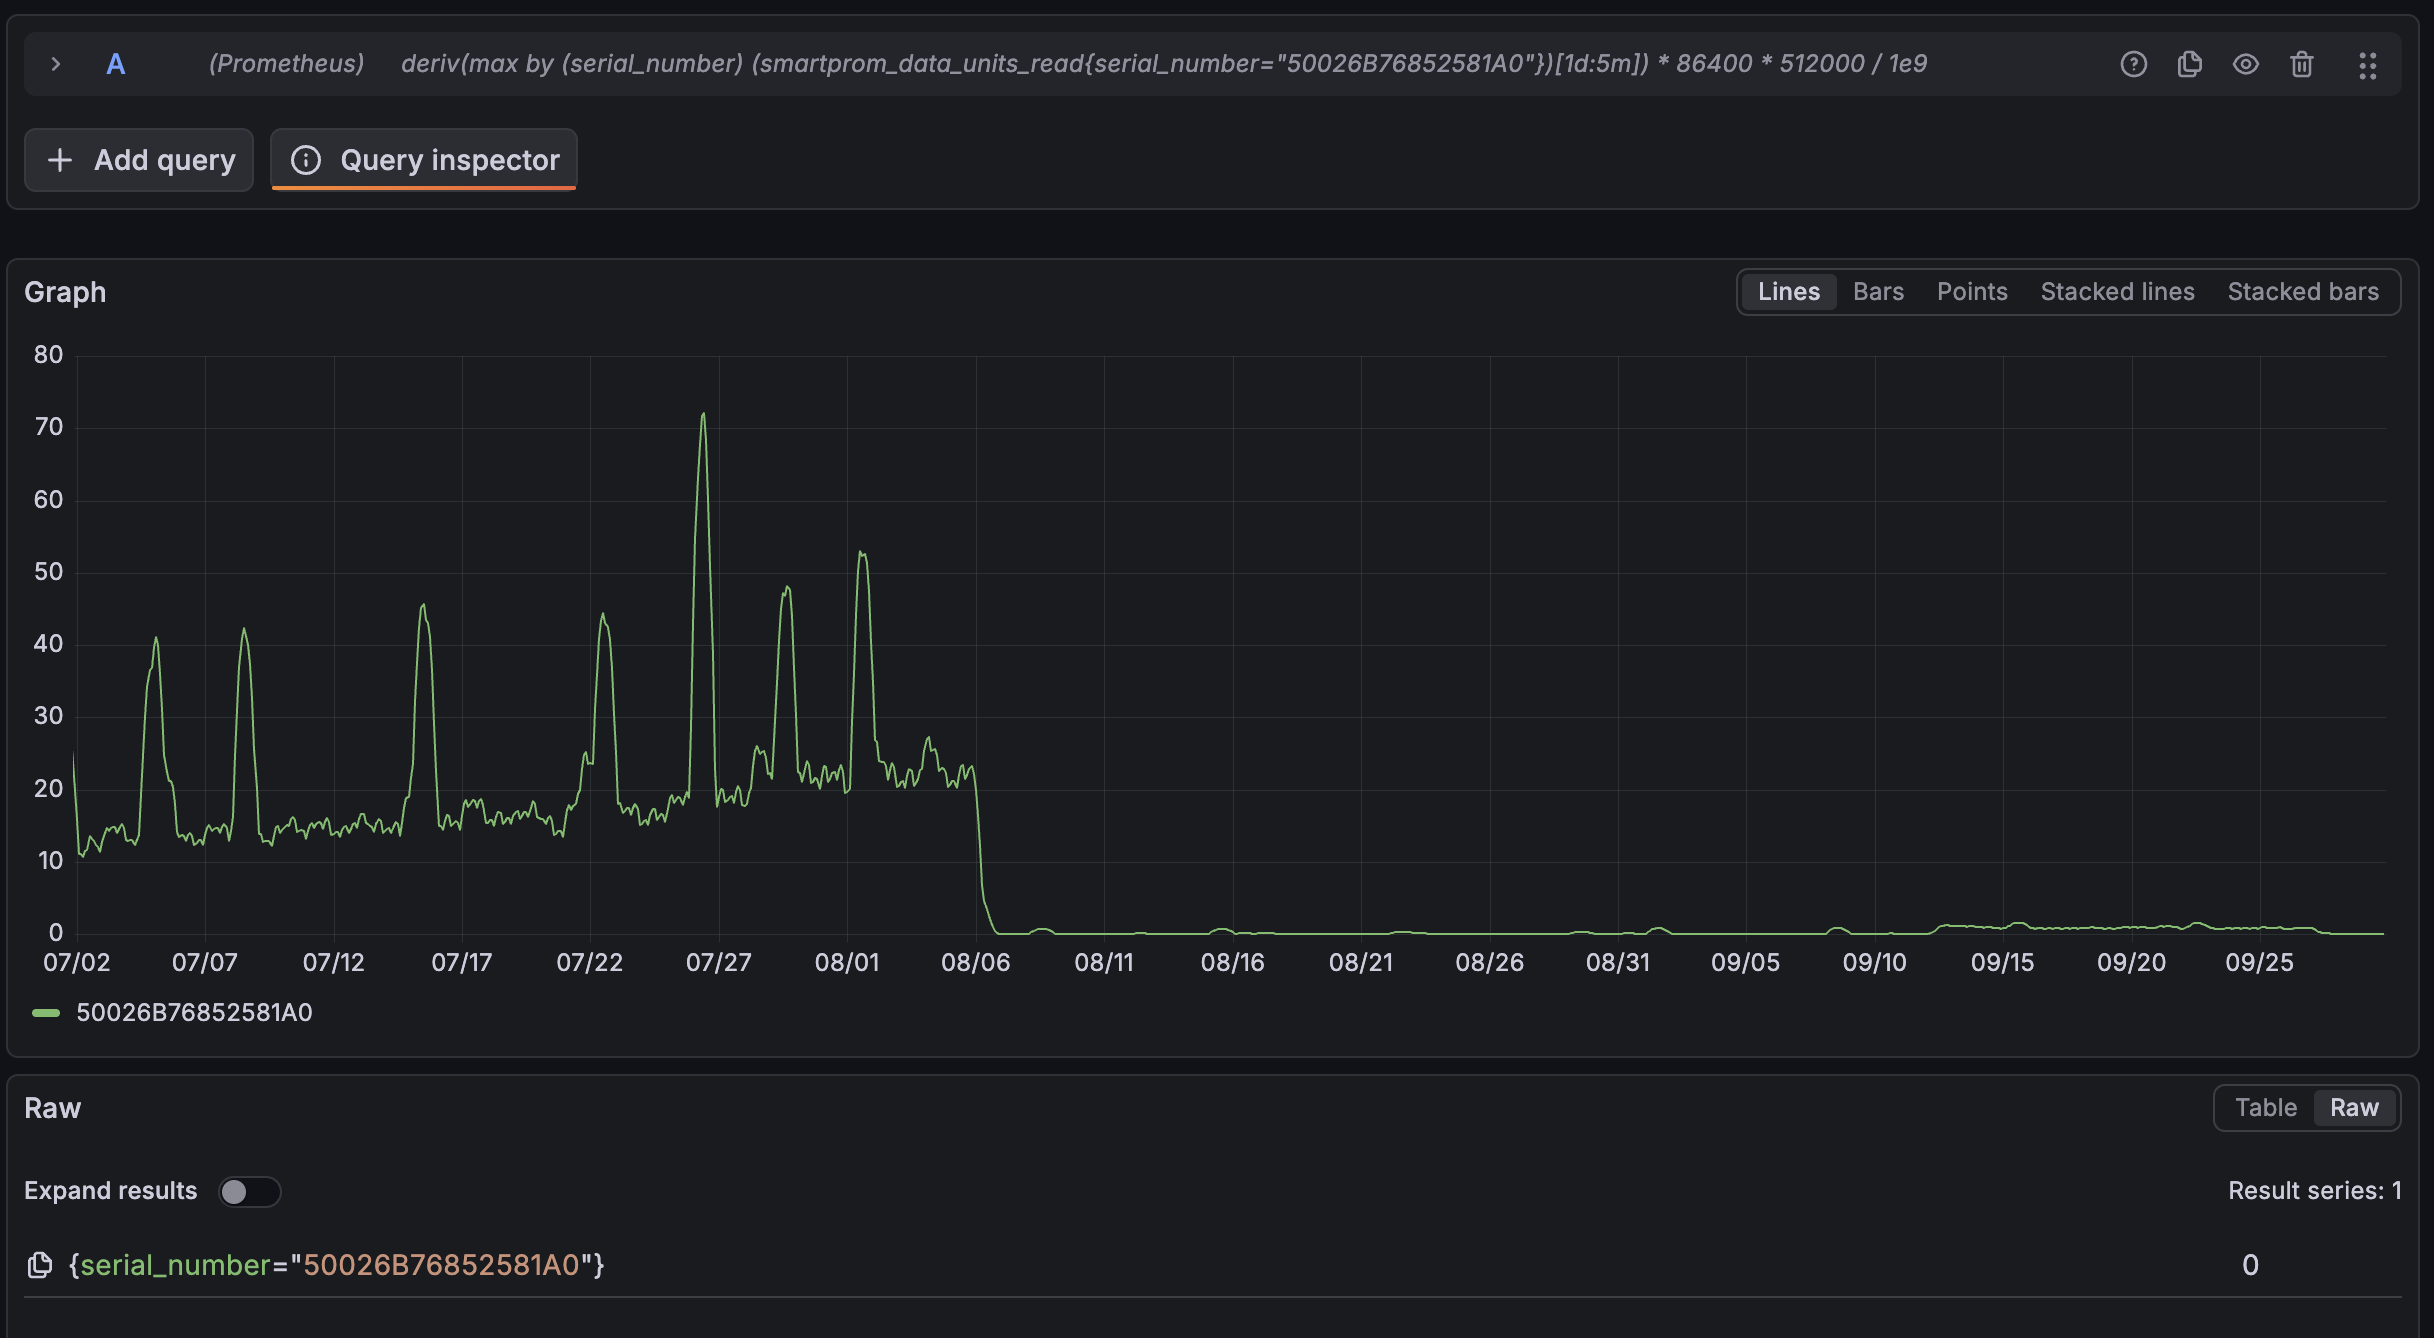
They dropped on the same evening. rock2 went from busy to idle in every direction at once.
Why the numbers cannot represent actual wear
At its new rate rock2 reports using 0.84% of its life per day. It is rated for 60 TB of writes, so that is about 500 GB of endurance a day. The drive receives about 60 MB a day, roughly 8,000 times less.
A drive does write more internally than it receives. To reuse flash it has to move still-valid data out of the way and erase whole blocks, so every byte from the host can cost a few bytes of actual NAND writes. That multiplier is called write amplification. On an ordinary SSD it sits somewhere between 1 and a handful, and a bad case reaches the tens.
For rock2's reported rate to be actual wear, the multiplier would have to be about 8,000: 8,000 bytes written to the flash for every byte arriving from the host. That is two complete rewrites of the whole 250 GB drive every day, on a drive that receives 60 MB a day and is less than a tenth full, which is the easiest situation there is for keeping write amplification low. And once the freed space has been cleaned up, the nightly TRIM job is just marking blocks that are already free, which costs next to nothing.
The TRIM theory has a second problem: it assumes reported wear follows erasing. The last post showed that on these drives it follows power on time instead, and writes hardly matter. Both cannot be right, and seven drives of evidence beat a theory about one.
It also cannot explain the slow period. Here is the reported wear of rock2 and rock1 side by side, in points per day:
| Node | 14 Jun – 1 Jul | 2 Jul – 25 Jul | 26 Jul – 5 Aug | 6 Aug – 5 Sep |
|---|---|---|---|---|
| rock1 | 0.35 | 0.30 | 0.40 | 0.37 |
| rock2 | 0.18 | 0.22 | 0.20 | 0.83 |
Before the power cut rock2 reported wear at half rock1's rate while writing more. After it, at more than double while writing almost nothing. Neither makes sense as actual wear. Both make sense as an estimate that changed its mind.
A clock whose rate changed
rock2 restarted four times while I was collecting data. The first three, on 14 June, 2 July and 26 July, were clean shutdowns: a planned reboot and two Talos upgrades. Its rate did not change. The fourth was the power cut on 5 August, the only time the drive lost power without warning, and the only time the rate changed.
I cannot see inside the firmware, so the claim has to stay narrow: whatever state the drive uses to calculate reported wear appears to have changed across the hard power loss, in a way that did not happen across the clean shutdowns.
It is not quite that simple, though. rock2 has lost power uncleanly 58 times in its life, mostly before this cluster existed, so it clearly does not change its rate every time.
On 26 September there was a small test. rock2 was drained and cleanly rebooted for unrelated work. Its unsafe shutdown count stayed at 58, and the next step, from 99 to 100, came exactly on schedule, 1.2 days after the one before. That is one data point, and the last one I will get, but it fits.
The drive's own answer
Actual wear uses up spare blocks. If rock2's reported rate were real, a drive losing 500 GB of endurance a day for seven weeks would be drawing on its reserve by now, and failing blocks would show up as media errors. Both counters were already being collected.
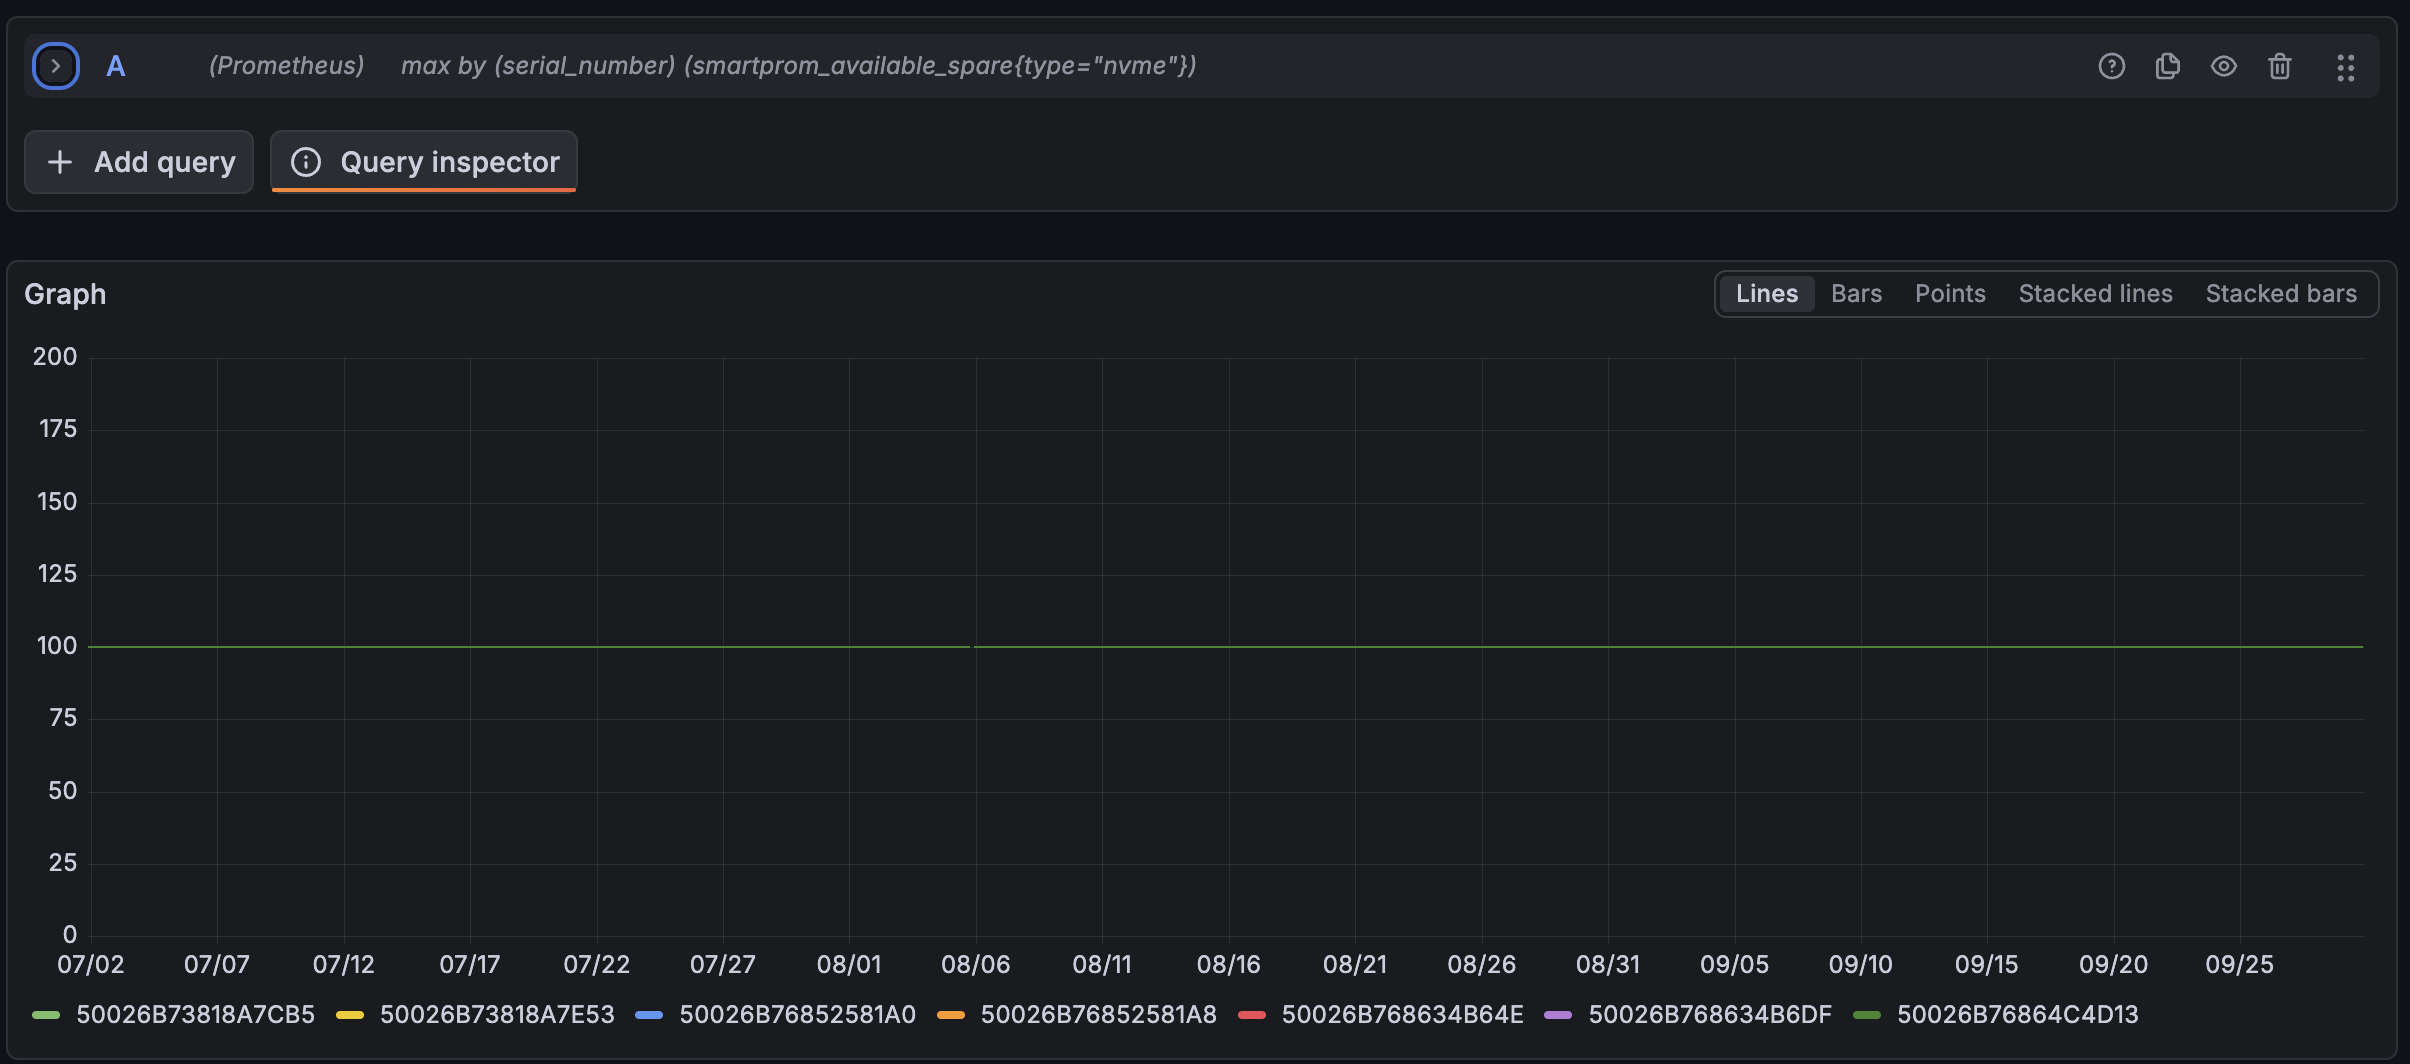
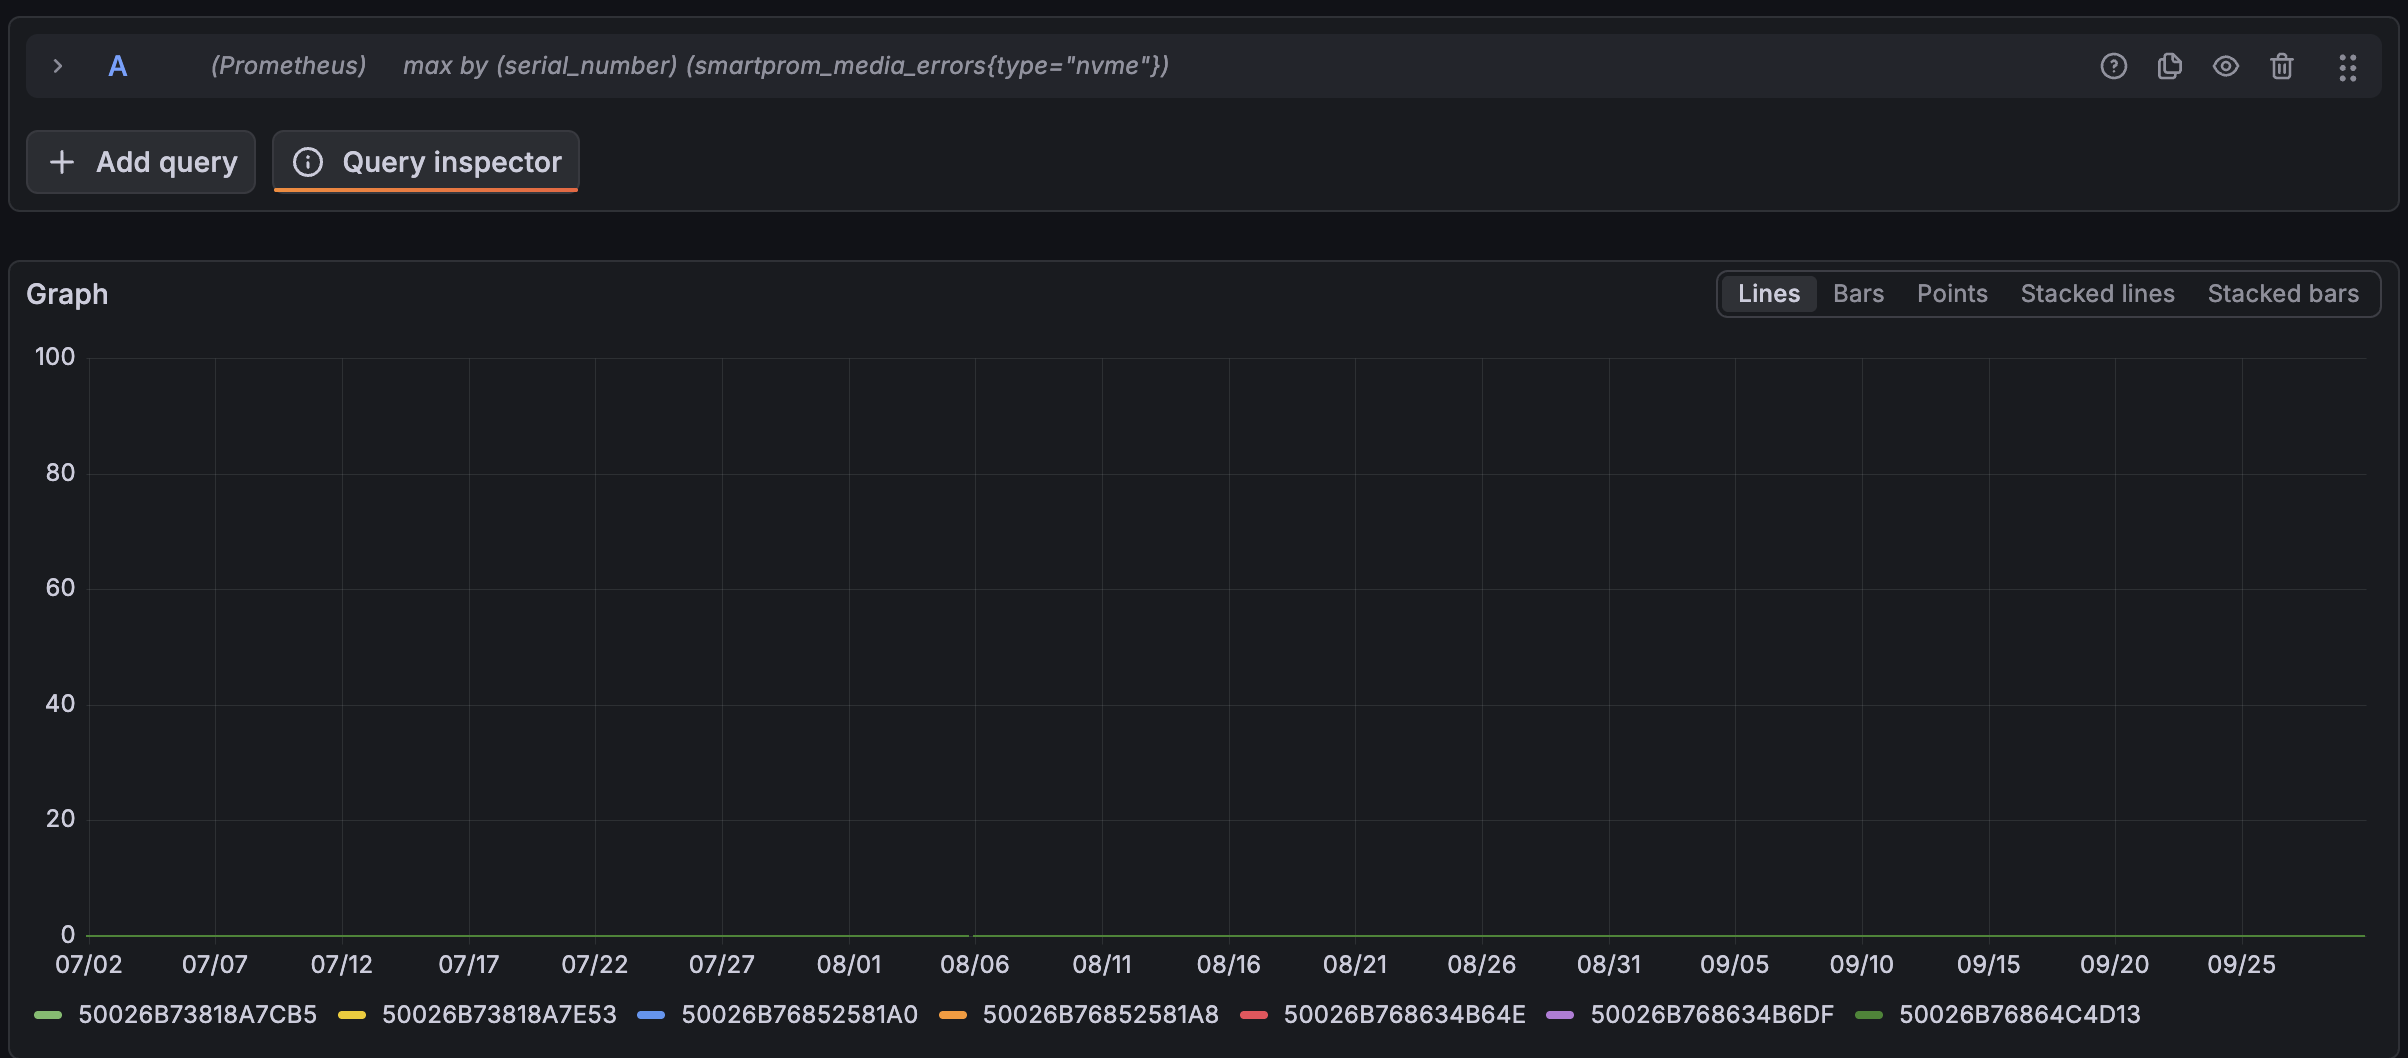
All seven drives, the whole period: spare at 100%, media errors at zero. rock2 has the highest reported wear in the cluster and has not retired a single block. The counters show no sign of physical wear. Only the estimate disagrees.
Where the writes went
That leaves the question of why rock2 went quiet at all. The answer is mundane.
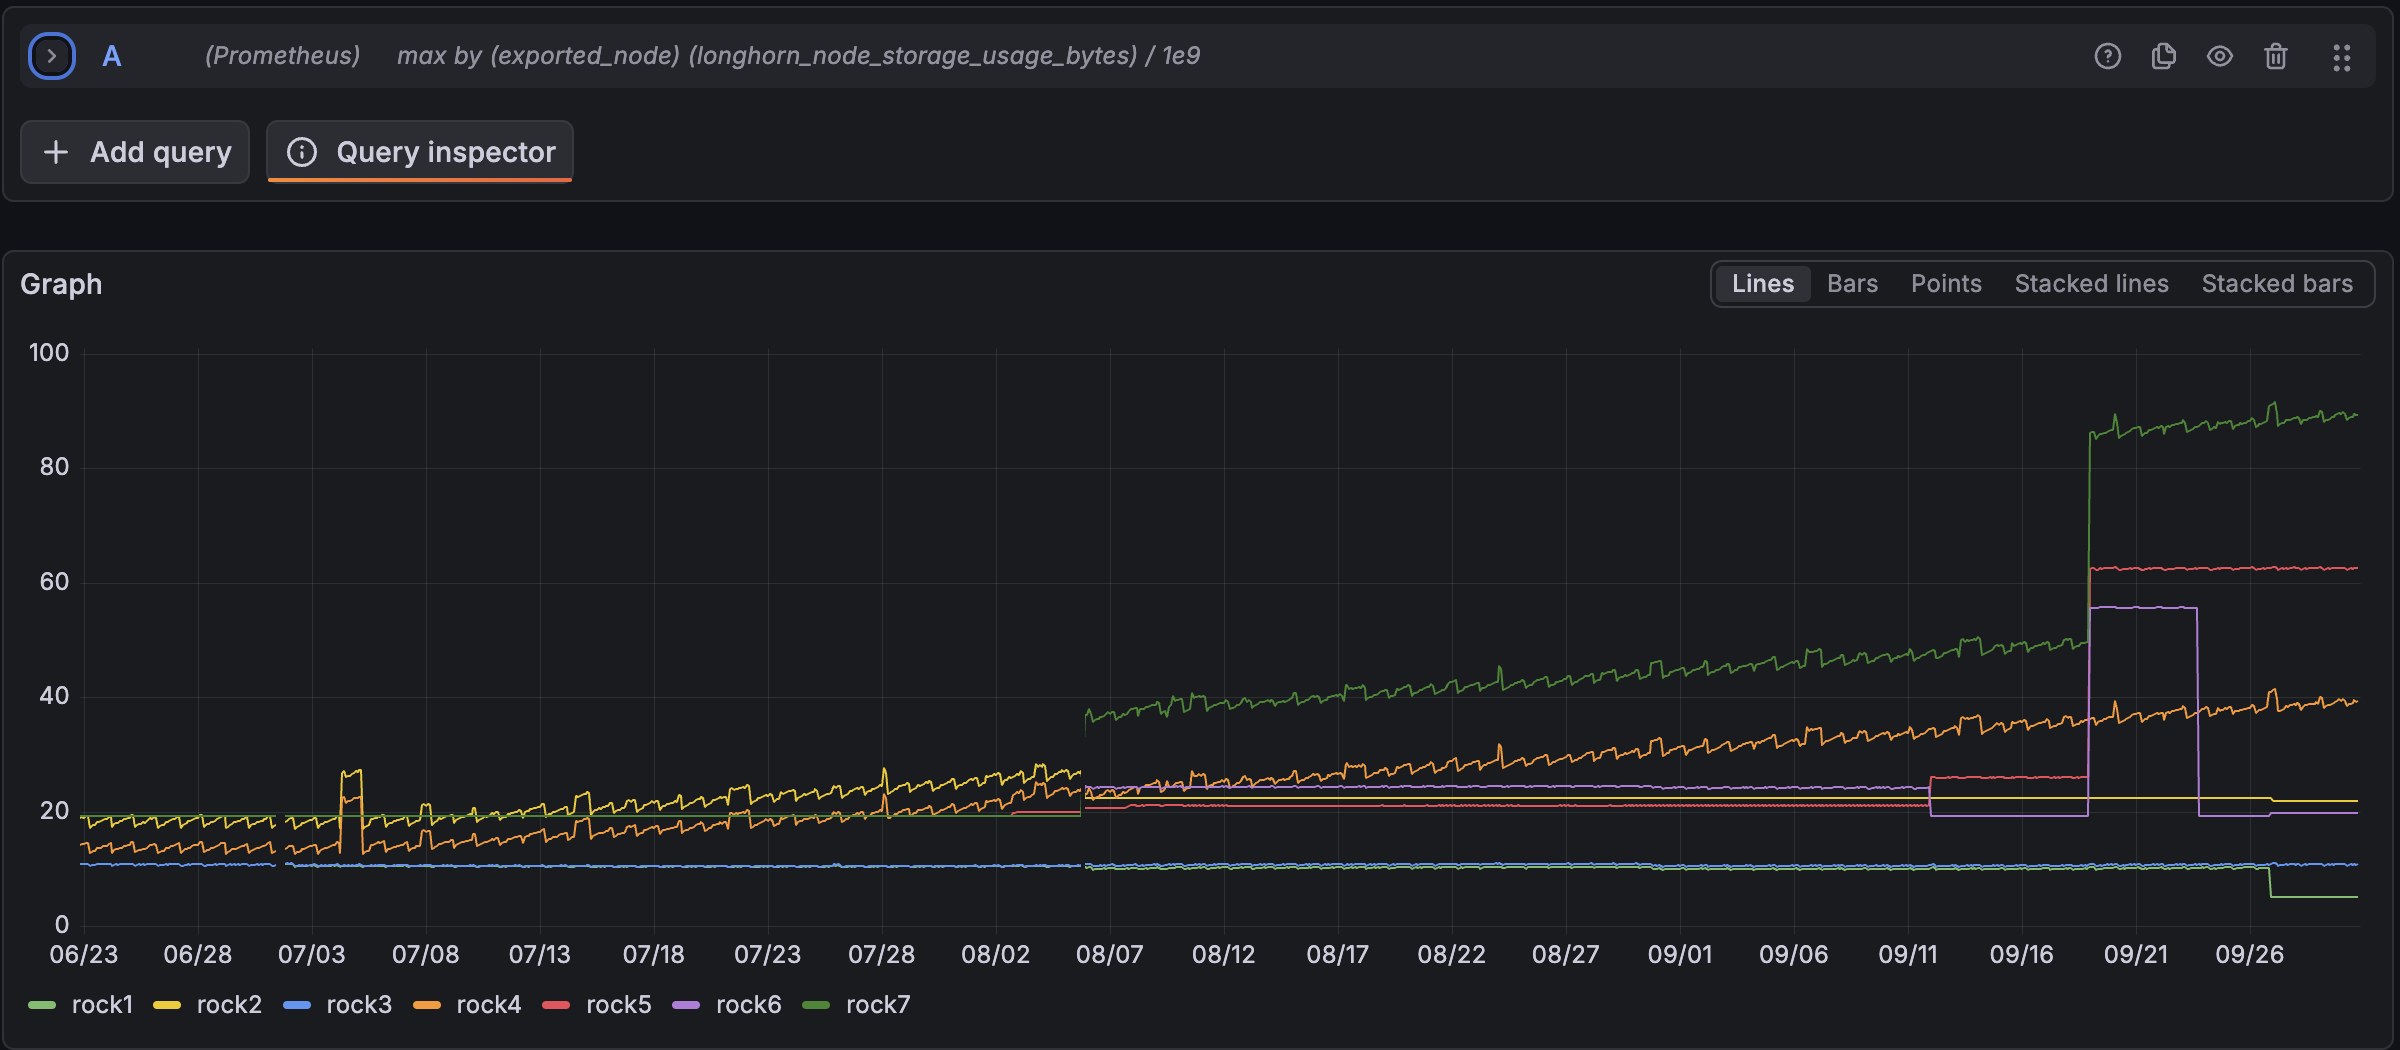
Before the power cut rock2 held one busy, growing Longhorn replica: the sawtooth on the graph. When the cluster came back up, Longhorn rebuilt that replica on rock7 and never moved it back. rock7's line picks up the sawtooth, and rock2's goes flat.
That one move explains the drop in both writes and reads. It also means rock2 lost its workload and lost power uncleanly within the same few minutes, so I cannot say for certain which of the two changed the estimate.
On 11 September rock6 briefly looked like a second case that might settle it. But rock6 had crashed and been power cycled, and its replica moved to rock5: the same two things at once, so it cannot separate them either. Its drive also only moves one point every few months, so I have stopped watching it.
Crossing 100
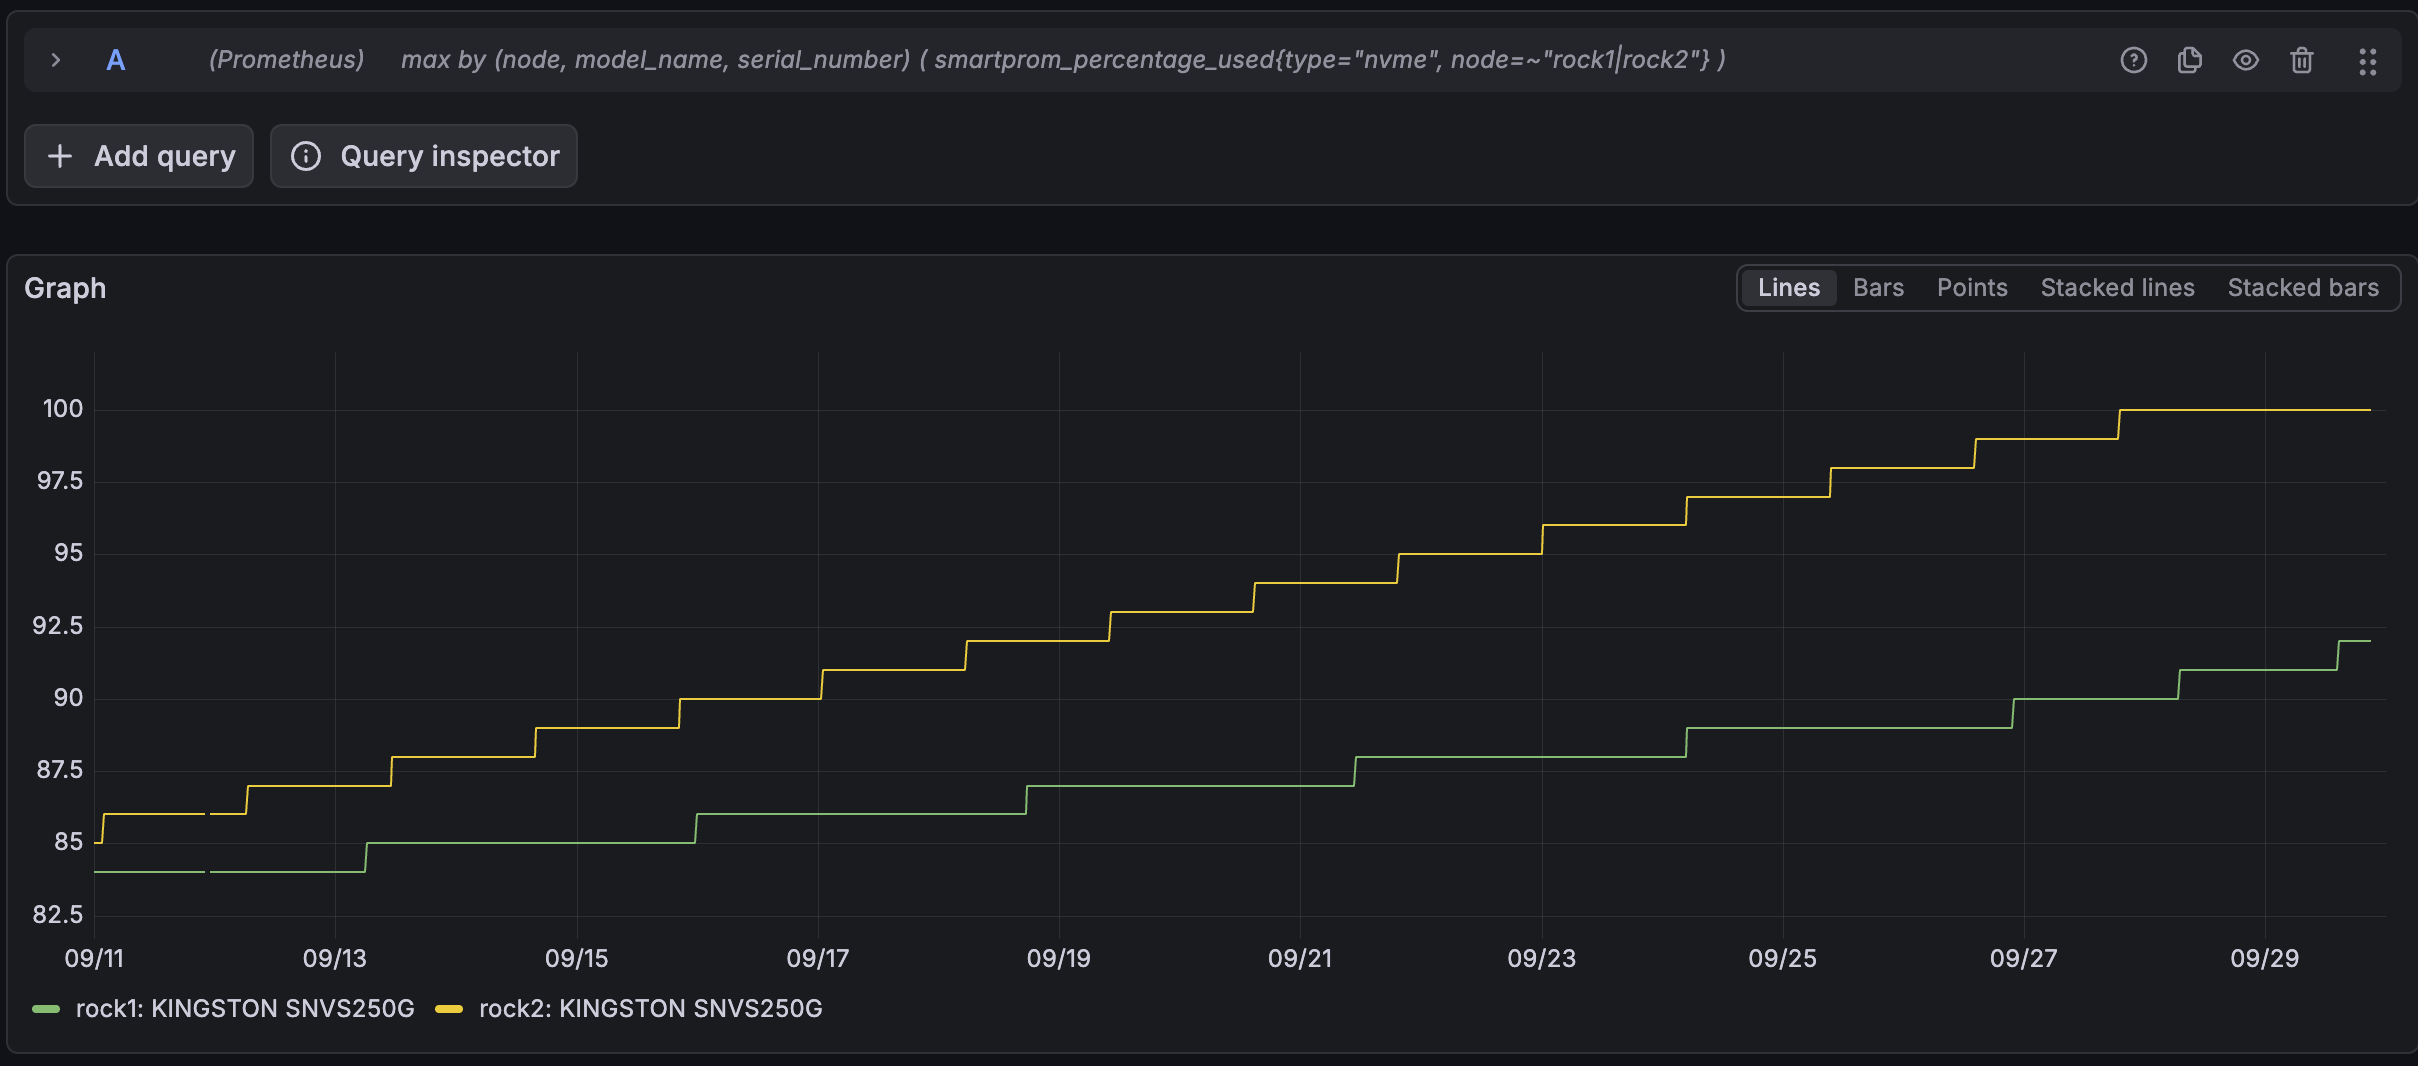
On the evening of 27 September rock2's reported wear reached 100%, the first drive in the cluster to do so. The value stopped at 100, even though the NVMe specification does not require percentage_used to stop there.
Nothing alerted, because the alert on reported wear had been removed in The Disk With No S.M.A.R.T.. That was the right call. The drive reached its official end of life with its spare blocks untouched, 2.7% of its rated writes used, and a warranty that had already run out in 2025.
Not even a reliable clock
Last time I concluded that reported wear is a clock rather than a measurement, but at least a predictable one. Each firmware version seemed to have its own fixed rate, so you could work out when a drive would reach 100%.
rock2 undoes that. It has the same model and firmware as rock1, and its rate changed on 5 August. Its lifetime average is also higher than anything I measured, so it must have run faster at some point before June as well. Knowing the firmware did not tell me when this drive would reach 100. I had to watch it get there.
So reported wear is not only the wrong thing to alert on. You cannot use it to predict anything either.
Conclusion
One drive's reported wear sped up four and a half times on the evening its writes almost stopped. The obvious explanation did not survive six weeks of data. Nothing in the data points to a corresponding increase in physical wear: the drive went almost idle, and its spare blocks and error counters never moved. What changed was the firmware's estimate, which started running at a different speed on the evening of a power cut.
rock2 now reads 100% used, 2.7% written, 100% spare and zero media errors. It is still running Longhorn.
The useful lesson is not that percentage_used is useless. It is that it is an estimate, and on these drives the estimate is not stable enough to treat as a measurement of physical wear, or as a clock counting down to failure.
What's Next
The NVMe was never the device that mattered most. The Disk With No S.M.A.R.T. turned the investigation into a different question: what is writing to the eMMC? That is the storage soldered to every module, holding etcd, container images and logs, and each control-plane node writes 13 to 15 GB a day to it. Teaching Prometheus to Read an eMMC gave it health monitoring.
The next post, The Cost of Saying "I'm Still Here", answers that question. For now it will also close this run of storage posts.
← Previous: Teaching Prometheus to Read an eMMC
Questions or suggestions? Leave a comment below or reach out at igor@vluwte.nl.