Silent Failures: Monitoring Stateful Services After Restarts
Garage's node ID reverted, Longhorn backups failed silently, and OpenBao turned out to have the same unmonitored risk — three alerts, two reactive and one proactive.
Introduction
The reboot that broke Garage broke two things at once, and neither set off an alert. Garage's node ID reverted to a previous identity and came back with NO ROLE ASSIGNED. Longhorn's backup target depends on Garage, so every recurring backup job started failing the moment that happened. The cluster found out about both the same way: by chance, sixteen hours later, when the backups themselves turned up missing.
That sixteen-hour silence is what prompted this post — but along the way it also surfaced a third gap that hadn't actually happened yet. OpenBao came through the June 14 reboot fine: the Proxmox Transit LXC it depends on for auto-unseal was unsealed at the time, so auto-unseal did its job and nobody noticed anything. What I noticed instead, while chasing down why Garage and Longhorn had failed silently, was that OpenBao had exactly the same shape of risk — it can come back sealed after a restart, and nothing was watching for it. So this post covers three alerts: two built to catch failures that already happened, and one built proactively for a failure that hadn't, yet.
This post covers what actually signals each failure, the alert rules built around those signals, and a deliberate test of one of them that turned into its own small lesson about the Transit LXC.
🏠 This is part of the Homelab Journey series - building a production Kubernetes cluster from scratch.
- Fixing a Postgres Backup Failure
- Silent Failures: Monitoring Stateful Services After Restarts (you are here)
The Common Pattern: Came Back Broken, No Signal
Before getting into each service, it's worth naming the pattern, because it shaped the approach for all three. Garage and Longhorn had already shown what the failure looks like; OpenBao hadn't, but the shape was obvious enough to act on before it did. In every case, the existing health signal — the one that "should" catch this — either doesn't exist yet or isn't sensitive to a single-node failure mode. The fix in each case was a synthetic or symptom-based probe rather than waiting for a better root-cause metric to appear.
One framing that helped while deciding what to probe and from where: there are three layers a check can sit at. Inside means same-namespace, pod-to-pod, service:port — what a sidecar or co-located exporter sees. Bletchley-external means a different namespace but still in-cluster, addressed as service.namespace.svc.cluster.local:port — reachable from Prometheus, not from a laptop. Real-outside means through Traefik with a hostname, reachable from anywhere. OpenBao has no ingress, so Bletchley-external is the only layer from which it can be probed at all — that constraint ended up deciding the whole approach for that service.
Garage: From Layout Metrics to the One Signal That Worked
Garage's admin API was already being scraped (job garage, target garage.garage.svc.cluster.local:3903), so the first instinct was to find a layout-health metric and alert on that directly. Garage exposes exactly that:
| Metric | Type | What it tells us |
|---|---|---|
cluster_healthy |
gauge | 0 or 1 — all layout nodes connected |
cluster_partitions_all_ok |
gauge | Partitions where all nodes connected (256 when fully healthy) |
cluster_layout_node_connected{id, role_capacity, role_zone} |
gauge | Per-node status |
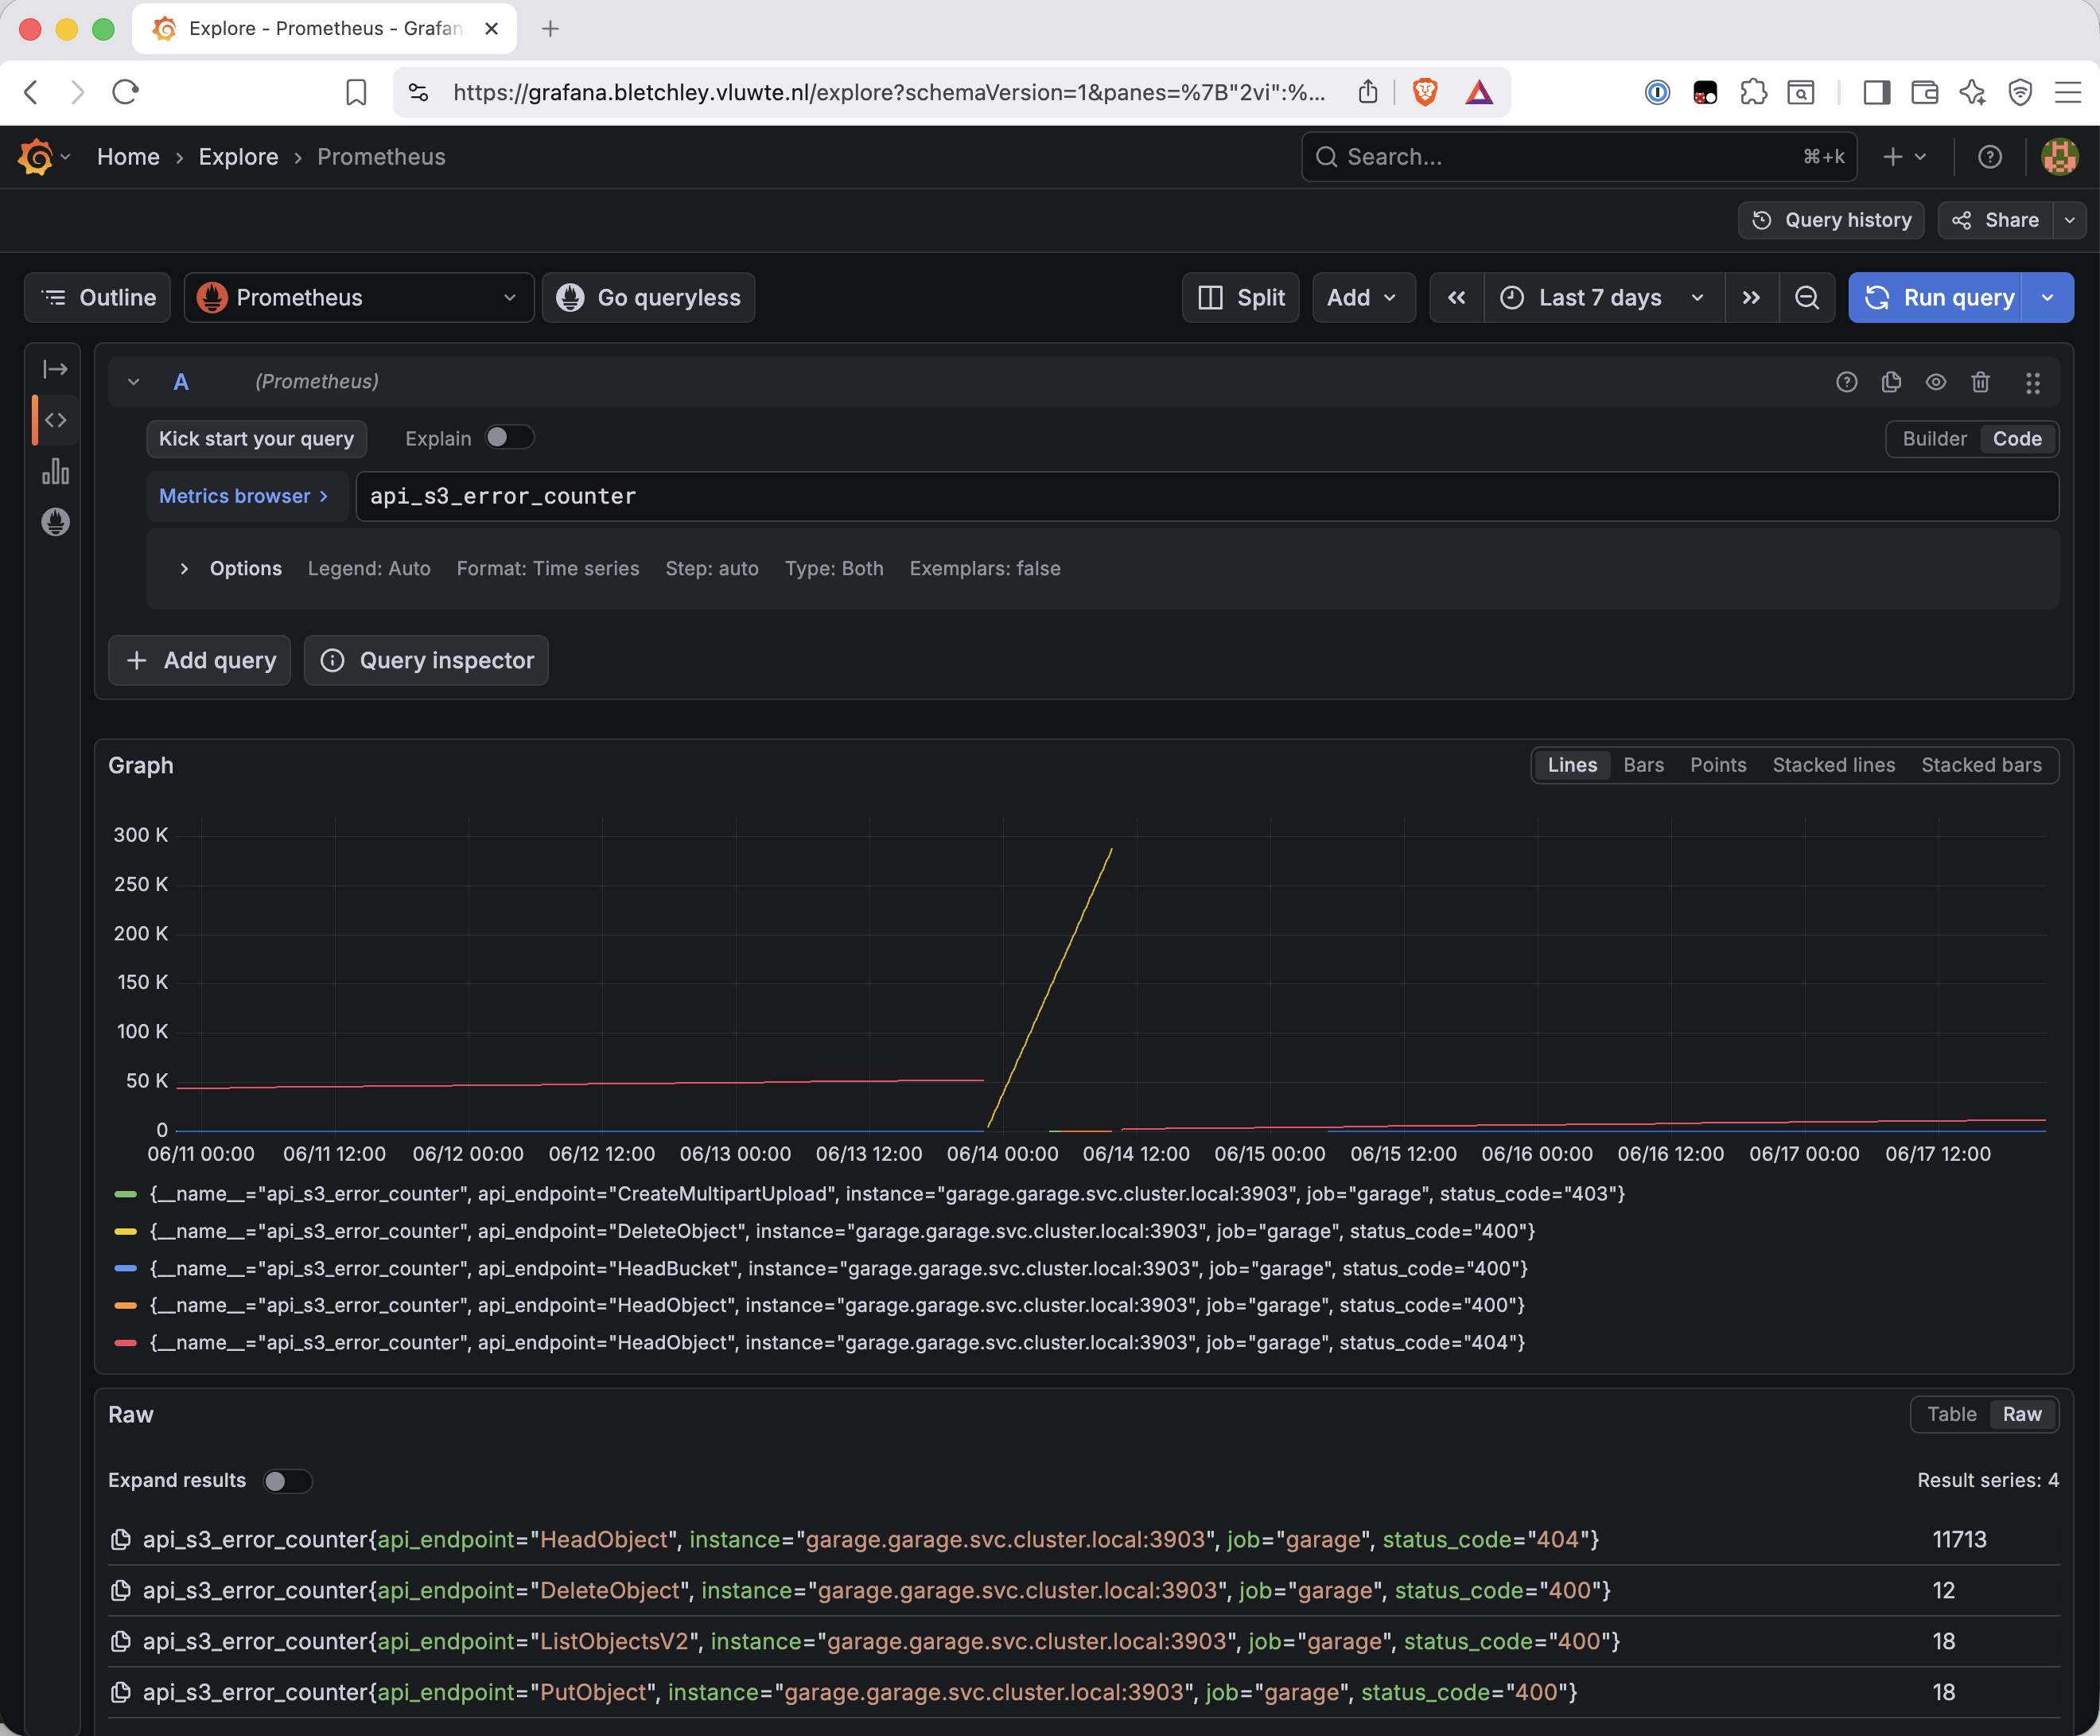
Querying both cluster_healthy and cluster_partitions_all_ok over the full week including the June 14 incident produced a flat, healthy line the entire time — cluster_healthy stayed at 1, cluster_partitions_all_ok stayed at 256. Neither metric moved during an incident that took the bucket list to empty and every S3 request to a 403. The likely explanation: on a single-node cluster, a node with NO ROLE ASSIGNED is no longer part of the layout at all, and an empty layout trivially satisfies "all partitions have all nodes connected." These metrics are built for catching a node dropping out of a multi-node layout — not a single node losing its identity entirely.
What did move was api_s3_error_counter{status_code="403"}. The baseline for this counter is genuinely zero — confirmed by pulling the prior 24 hours: ~11,700 HeadObject 404s (legitimate existence checks, ~8/min), a handful of 400-series errors from housekeeping noise, and not one single 403. During the incident, 403s on CreateMultipartUpload, ListObjectsV2, and PutObject spiked from zero to roughly 1.5–2K per five-minute window and stayed there for the full sixteen hours.
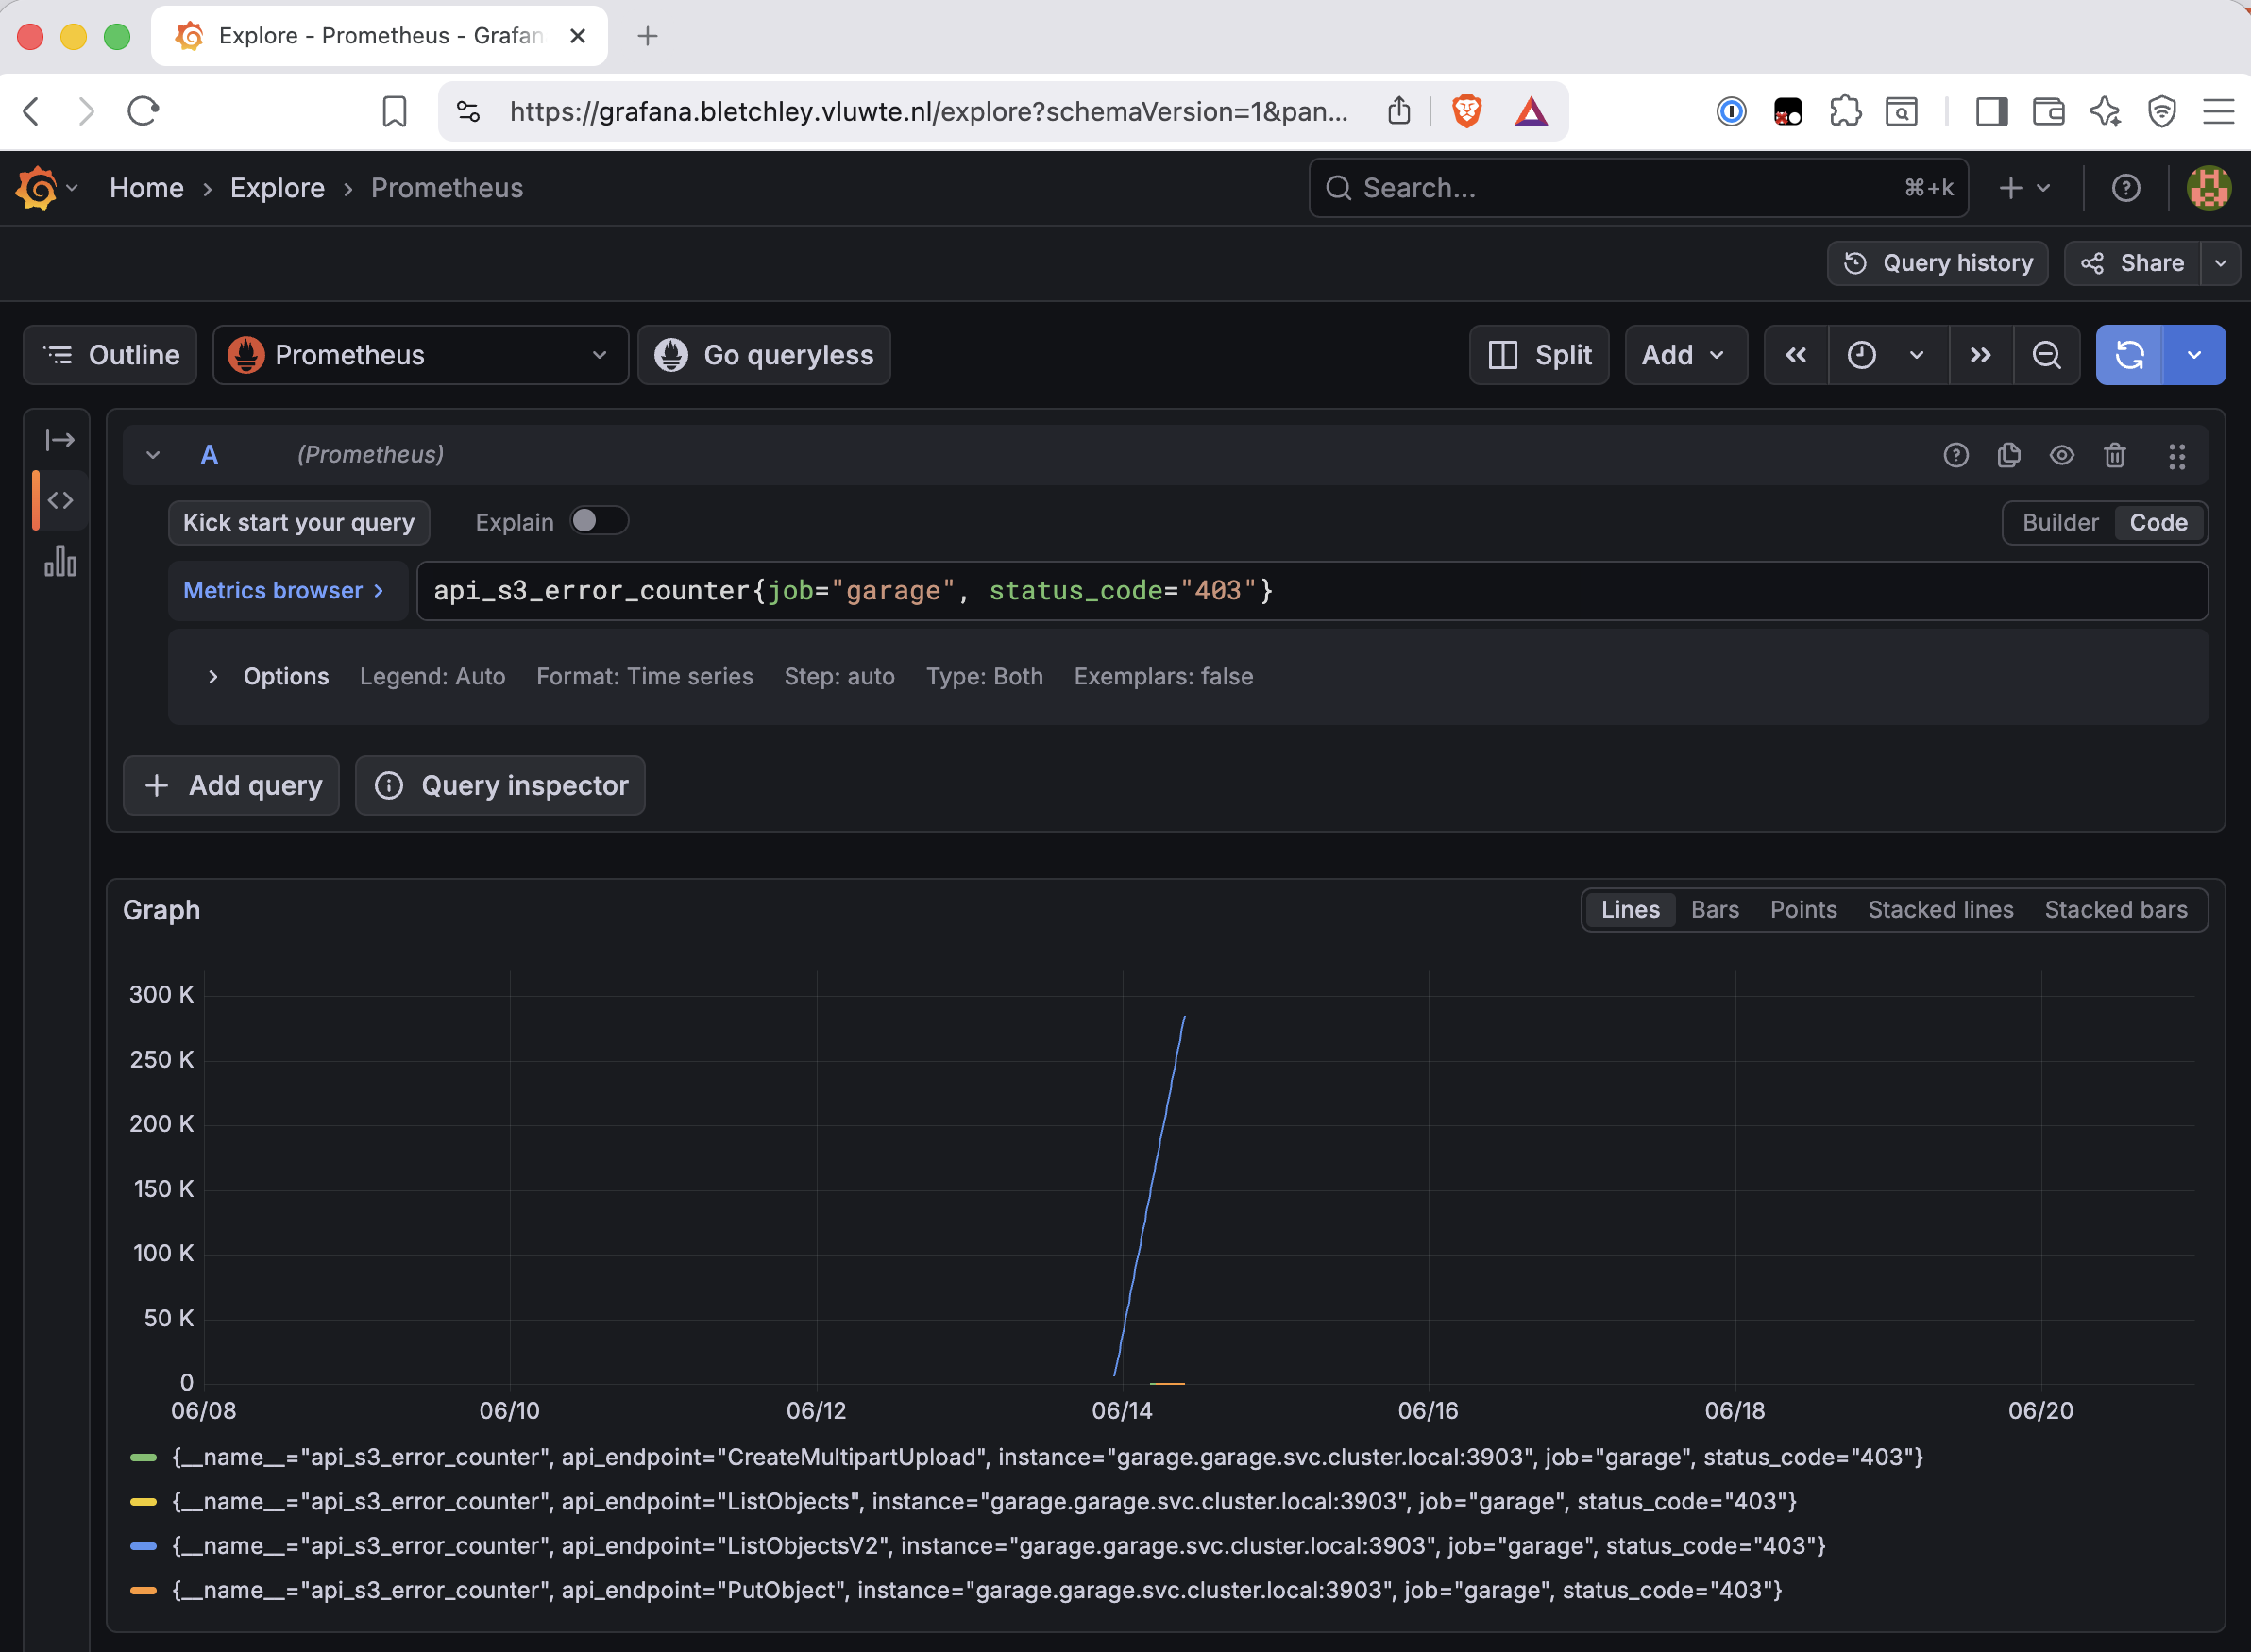
Everything that isn't 403 or 404 — DeleteObject, ListObjectsV2, and PutObject 400s — stayed under 20 counts cumulative for the whole week, before, during, and after the incident. No signal there at all.
That made the rule straightforward: since there's no legitimate source of 403s in normal operation, any 403 at all is the anomaly. The for: window is the only debounce needed.
# monitoring/prometheus/prometheus-values.yaml — backup rule group
# api_s3_error_counter is a counter — use increase() over a window.
# Threshold: > 0. Zero 403s in normal operation — any sustained 403s are the signal.
# for: 10m to avoid alerting on transient 403s during a normal pod restart.
- alert: GarageS3AuthErrors
  expr: increase(api_s3_error_counter{job="garage", status_code="403"}[5m]) > 0
  for: 10m
  labels:
    severity: critical
  annotations:
    summary: "Garage S3 API returning sustained 403 errors"
    description: >
      Elevated 403 rate on Garage S3 API. Most likely cause: node reverted to previous
      node ID (NO ROLE ASSIGNED). Check node status:
        kubectl exec -n garage garage-0 -- /garage status
      Expected stable node ID: 6963934821f79894
      Fix if wrong ID: kubectl rollout restart statefulset/garage -n garage
block_resync_errored_blocks was also evaluated and ruled out — on a single-node cluster there's nothing to resync with, so it sits at 0 by definition and would never alert meaningfully. It's worth knowing about if the cluster ever grows a second Garage node.
Garage runs from a static StatefulSet manifest, not Helm, but the alerting rules live in prometheus-values.yaml alongside everything else. Applying it as alerting_rules.yml and checking it against the live config first caught nothing missing:
igor@granite prometheus % grep -- "- alert" prometheus-values.yaml | wc -l
      53
igor@granite prometheus % promtool check rules alerting_rules.yml
Checking alerting_rules.yml
  SUCCESS: 53 rules found
helm upgrade prometheus prometheus-community/prometheus -n monitoring --version 29.2.1 -f prometheus-values.yaml
![Prometheus Alerts page showing the backup rule group with GarageS3AuthErrors expanded, displaying the expression increase(api_s3_error_counter{job="garage",status_code="403"}[5m]) > 0, for 10m, severity critical, and the full description text with the kubectl exec and rollout restart commands.](https://vluwte.nl/content/images/2026/07/screenshot-prometheus-new-garage-rule.png)
The real test was running this exact expression against the June 13–14 window to see if it would have caught the actual incident:
![Grafana Prometheus Explore plotting increase(api_s3_error_counter{job="garage",status_code="403"}[5m]) > 0 over June 13–14. Three series — CreateMultipartUpload, ListObjectsV2, and PutObject — sit flat at zero through all of June 13, then spike sharply at midnight on June 14 and sustain roughly 1.5–2K per 5-minute window, with two brief dips before dropping back to zero around 08:00–09:00.](https://vluwte.nl/content/images/2026/07/screenshot-grafana-rule-applied-show-june-14.png)
It would have. The Prometheus UI also flags api_s3_error_counter with a linter "info" — the metric doesn't end in _total, which is the Prometheus naming convention for counters. That's a Garage-side naming choice, not an error, and doesn't affect the query.
OpenBao: Monitoring the Risk Before It Becomes an Incident
OpenBao's /v1/sys/health endpoint is the standard Vault/Bao health check — 200 when unsealed, 503 when sealed, 501 when uninitialised — and it needs no auth to query. Nothing was probing it. The cleanest way to turn that into a Prometheus metric is the Blackbox exporter, which wasn't deployed yet. Given the "outside" framing above, this also settled the deployment question: since OpenBao has no ingress, the Blackbox exporter probing from the monitoring namespace (Bletchley-external) is the only layer from which OpenBao can be checked externally at all.
# apps/monitoring/prometheus-blackbox-exporter/prometheus-blackbox-exporter-values.yaml
podAnnotations:
  prometheus.io/scrape: "false"  # prevent default scrape — Prometheus scrapes via probe jobs instead
helm install prometheus-blackbox-exporter prometheus-community/prometheus-blackbox-exporter \
  -n monitoring -f prometheus-blackbox-exporter-values.yaml
Wiring the probe into Prometheus took two wrong turns before landing on the right config key. A top-level additionalScrapeConfigs: is silently ignored by this chart entirely; server.additionalScrapeConfigs: is picked up, but merges as a relabel entry inside the existing kubernetes-service-endpoints job rather than registering as its own job. The correct key for the prometheus-community/prometheus chart is extraScrapeConfigs, used as a YAML string block at the same top level as the other custom jobs (garage, longhorn, node-exporter):
# monitoring/prometheus/prometheus-values.yaml
- job_name: blackbox-openbao
  metrics_path: /probe
  params:
    module: [http_2xx]
    target: ["http://openbao.openbao.svc.cluster.local:8200/v1/sys/health"]
  static_configs:
    - targets: ["prometheus-blackbox-exporter.monitoring.svc.cluster.local:9115"]
  relabel_configs:
    - source_labels: [__param_target]
      target_label: instance
    - target_label: __address__
      replacement: prometheus-blackbox-exporter.monitoring.svc.cluster.local:9115
A kubectl rollout restart deployment/prometheus-server -n monitoring after the Helm upgrade got the new job registered and scraping:
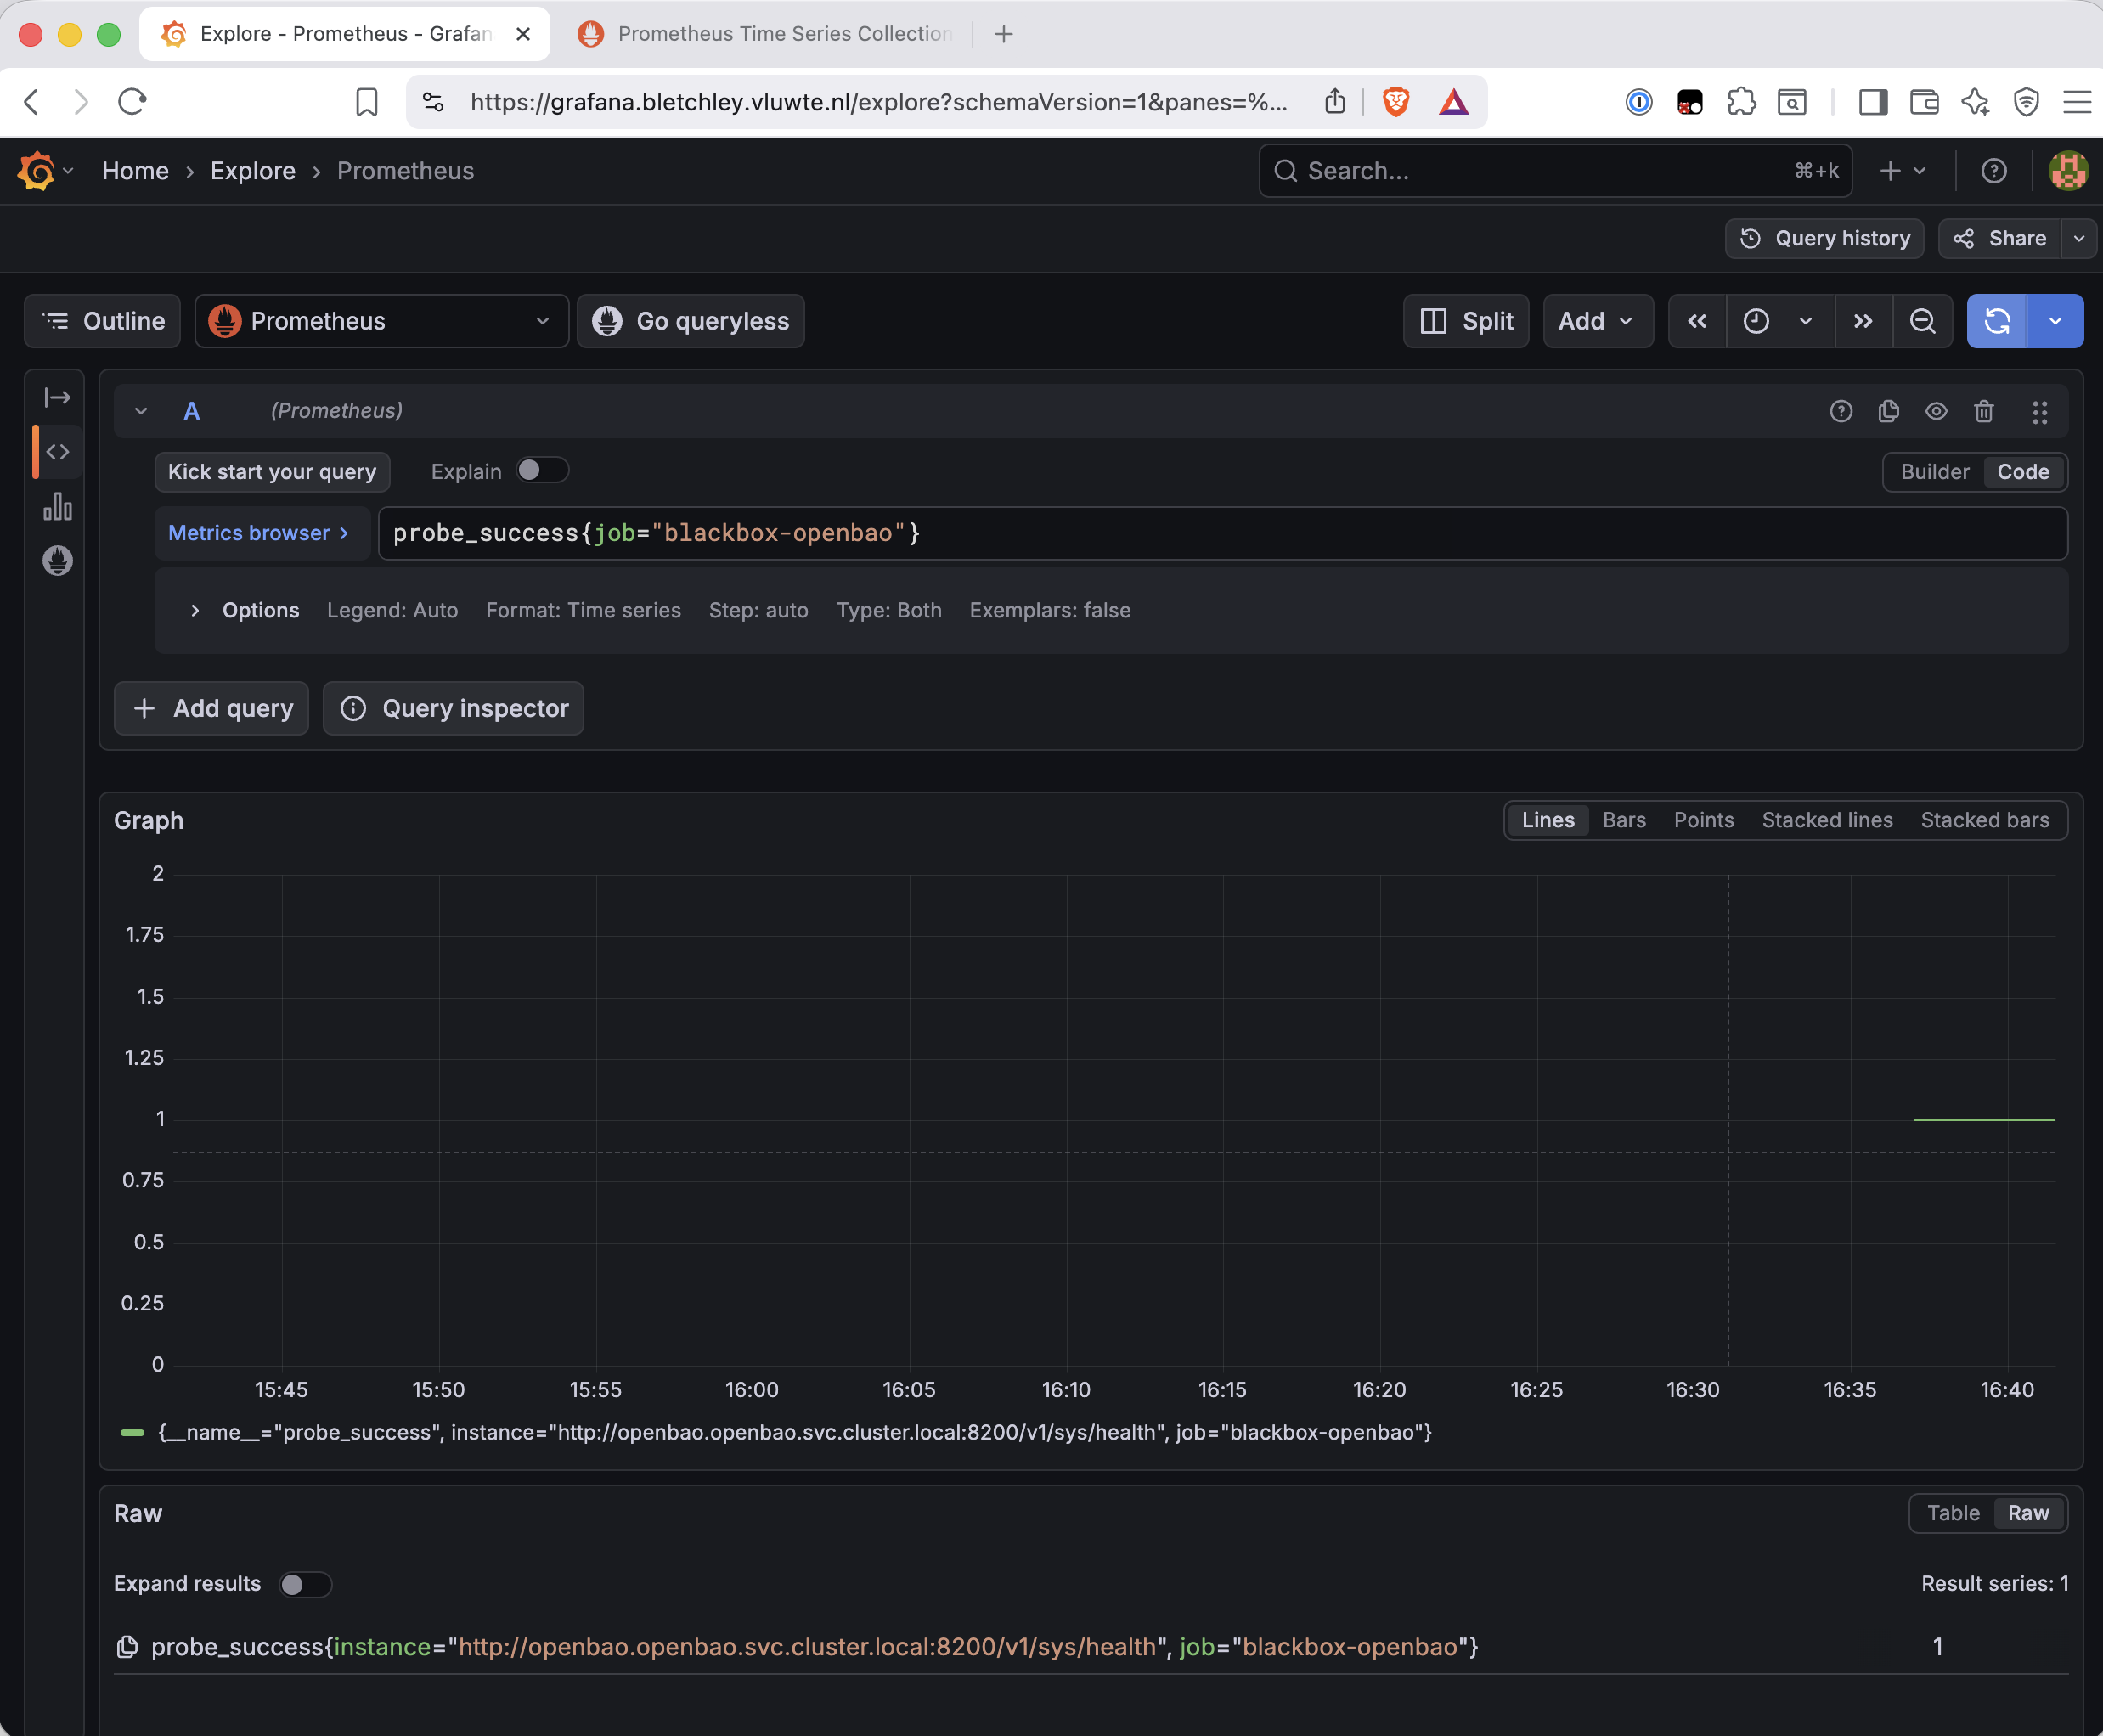
With the metric live, the rule itself is a single comparison:
# monitoring/prometheus/prometheus-values.yaml — cluster rule group
# -- OpenBao Seal Status -------------------------------------------
# Blackbox exporter probes OpenBao's unauthenticated /v1/sys/health
# endpoint from the monitoring namespace (Bletchley-external layer).
# Returns 200 when unsealed, 503 when sealed, 501 when uninitialised.
# Auto-unseal via Proxmox Transit LXC should clear a sealed state
# within ~1 minute; for: 5m gives it room without alerting on normal
# restarts. OpenBao has no ingress — Bletchley-external is the only
# layer from which it can be probed.
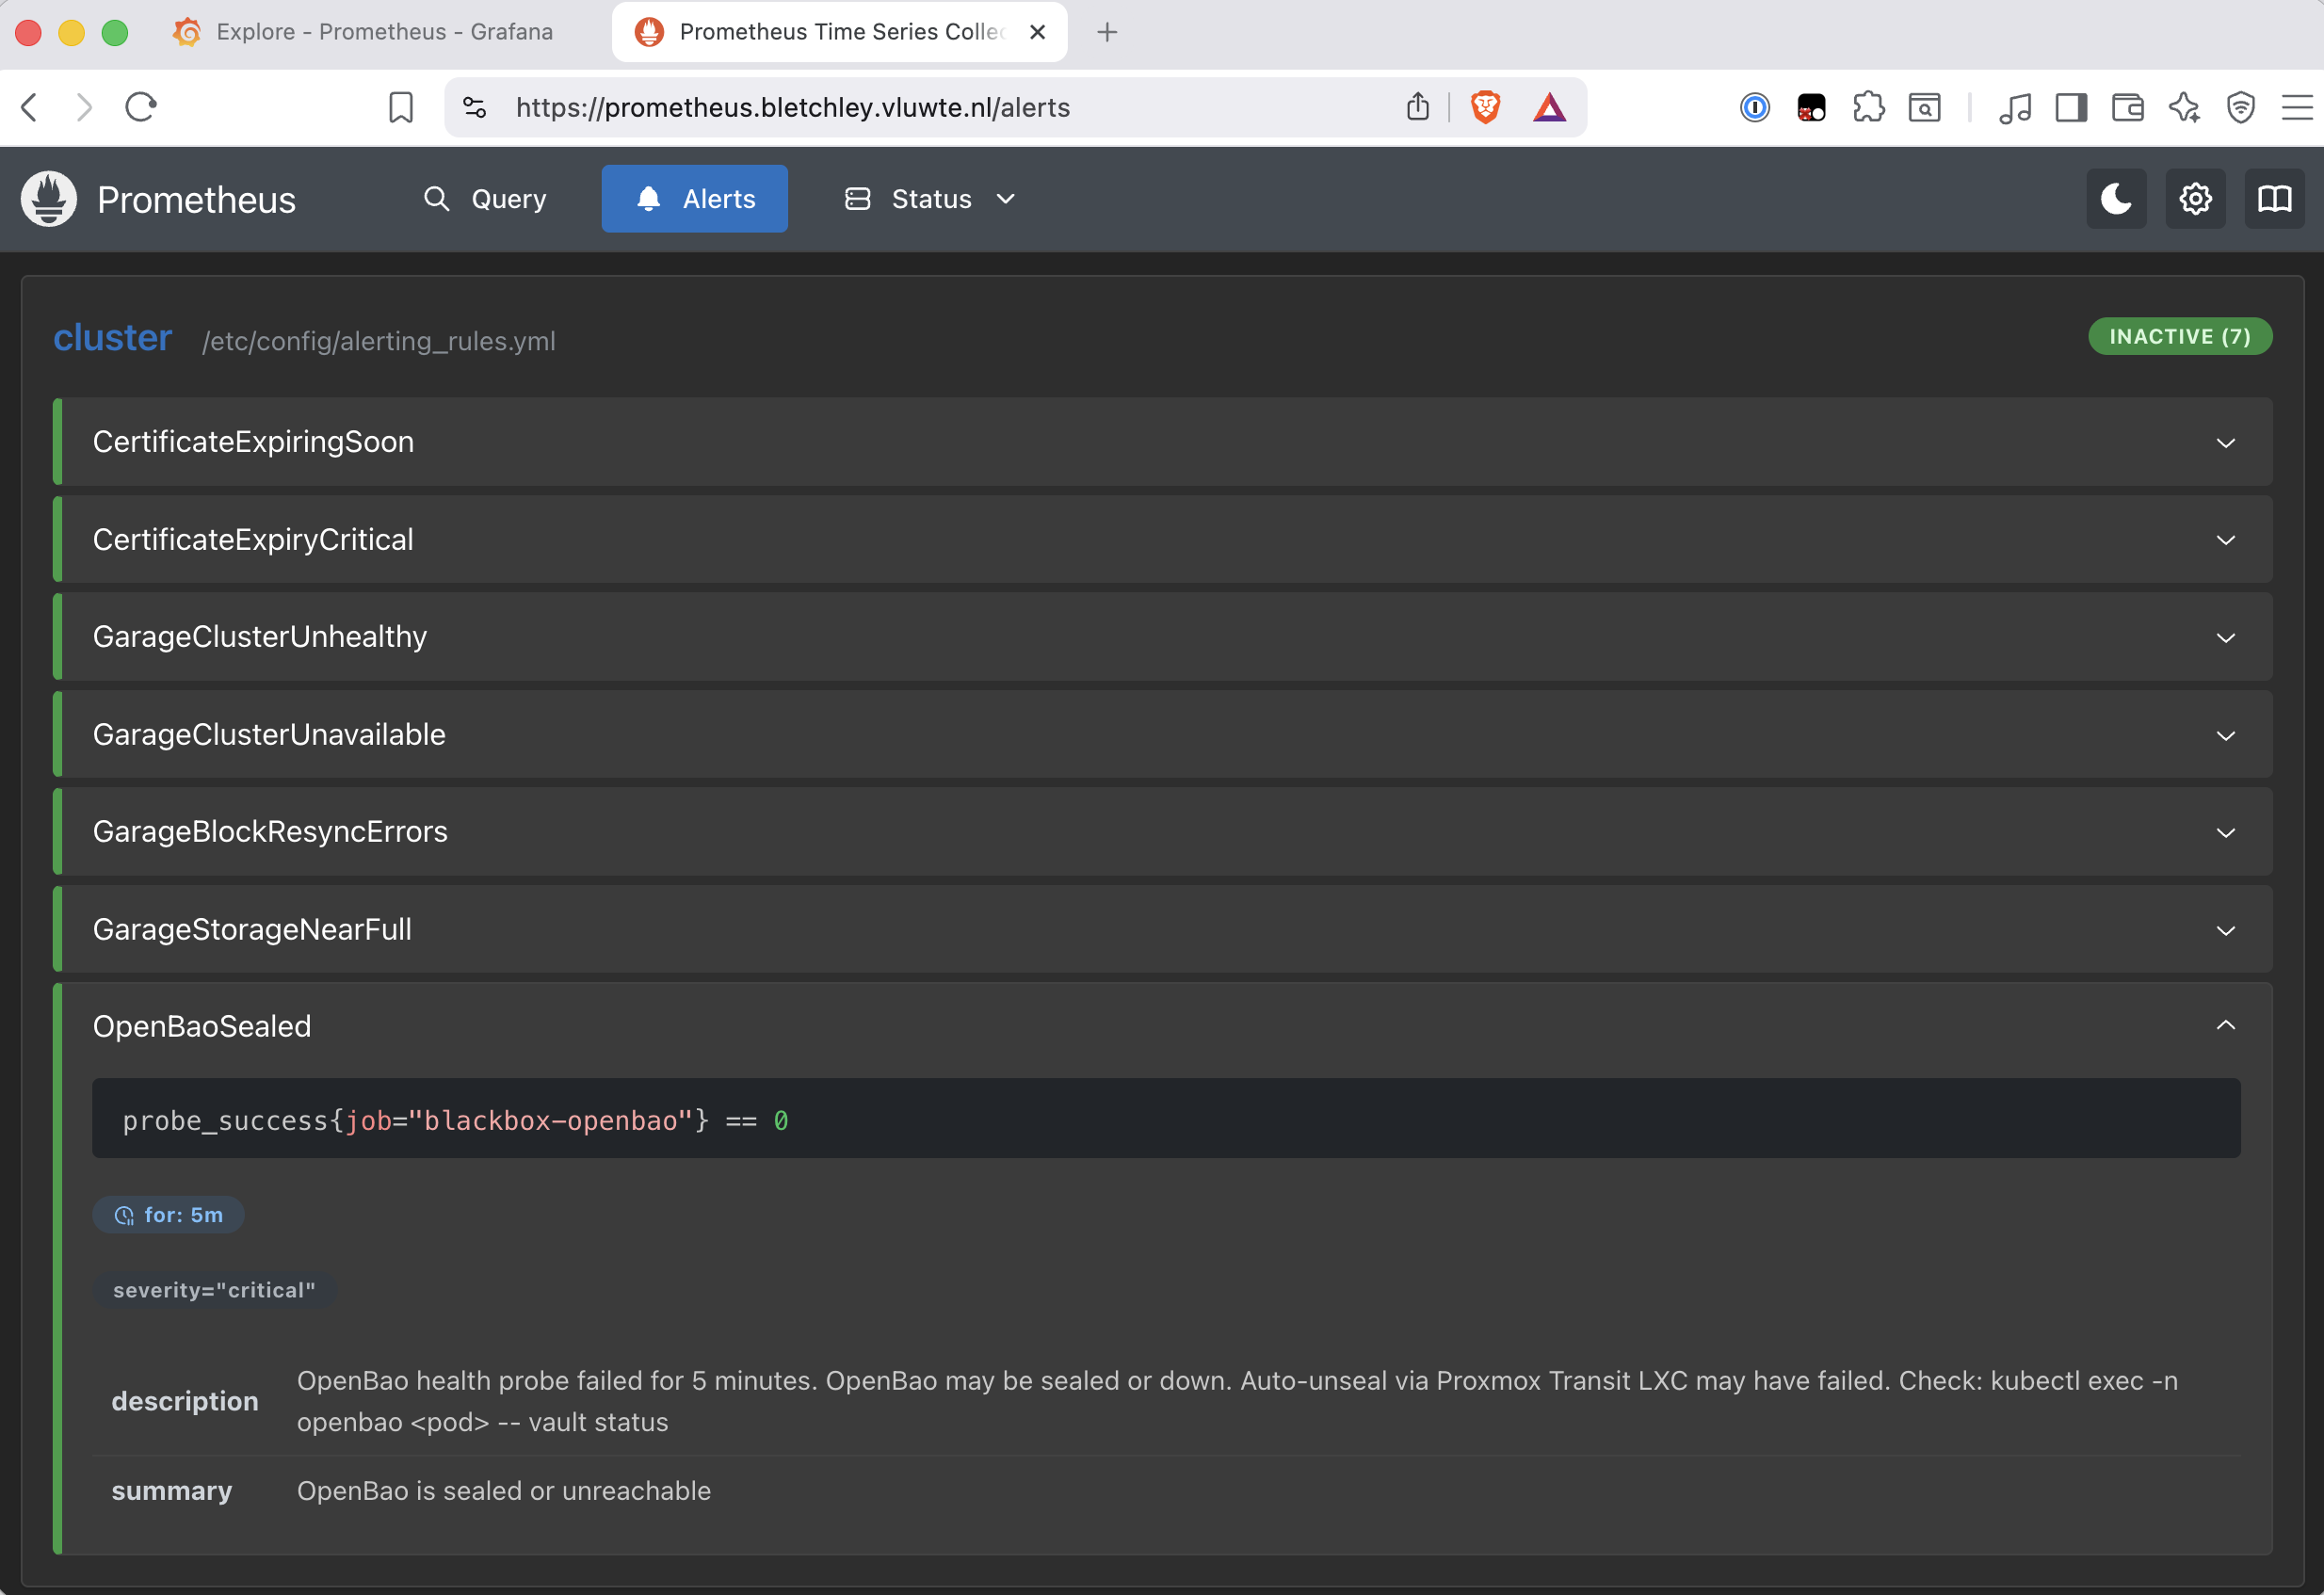
- alert: OpenBaoSealed
  expr: probe_success{job="blackbox-openbao"} == 0
  for: 5m
  labels:
    severity: critical
  annotations:
    summary: "OpenBao is sealed or unreachable"
    description: >
      OpenBao health probe failed for 5 minutes. OpenBao may be sealed or down.
      Auto-unseal via Proxmox Transit LXC may have failed.
      Check: kubectl exec -n openbao <pod> -- vault status
Testing the Alert On Purpose
Waiting for OpenBao to seal itself on its own schedule wasn't a plan — it needed a deliberate restart to prove OpenBaoSealed actually fires. Before triggering that restart, I checked whether either OpenBao instance was overdue for an upgrade, since a restart was happening either way. Both were: 0.27.2 → 0.28.4 was available. I started with Bletchley's instance, planning to do the Transit LXC's afterward — and ran into two separate issues in the process.
The first was self-inflicted: I ran helm upgrade without deleting the StatefulSet first. OpenBao's chart needs that deletion step before an upgrade — skip it, and the upgrade doesn't apply cleanly. Deleting the StatefulSet and re-running the upgrade got past that, but the new pod immediately failed to start:
igor@granite ~ % kubectl logs -n openbao openbao-0
Error parsing Seal configuration: Error making API request.

URL: PUT https://openbao-transit.luwte.net:8200/v1/transit/encrypt/bletchley-unseal
Code: 503. Errors:

* Vault is sealed
That was the second issue, and the real one: the Transit LXC's own OpenBao was sealed, and I hadn't checked that before starting — auto-unseal only works through the Transit LXC, it doesn't unseal the Transit LXC itself. Bletchley's new pod hit a sealed Transit backend and couldn't get an encryption key. Fixing it meant unsealing the Transit LXC manually first:
root@gmk1:~# pct enter 501
root@openbao-transit:~# bao operator unseal
root@openbao-transit:~# bao operator unseal
root@openbao-transit:~# bao status
Sealed          false
— then deleting the failed Bletchley pod so it could retry against a now-unsealed Transit backend. It came up cleanly on the new version. The alert email arrived while this was in progress:
![Email from alerts@vluwte.nl with subject [FIRING:1] OpenBaoSealed, showing the alertname, instance URL, job blackbox-openbao, severity critical, and the full description text about the health probe failing for 5 minutes and checking vault status.](https://vluwte.nl/content/images/2026/07/screenshot-mail-alert-openbao-sealed-or-unreachable.png)
Three things from this are worth carrying forward. First, OpenBaoSealed works — it caught exactly the condition it was built for, on the first real test. Second, the for: 5m grace window behaved correctly: it didn't fire on the brief restart blip, only once the probe had been failing continuously for five minutes. Third, and the actual lesson here: the Transit LXC needs its own unsealed-check before any restart touches Bletchley's OpenBao, not just during upgrades — that's now a permanent line in the pre-upgrade checklist. ssh root@openbao-transit.luwte.net bao status, confirm Sealed: false, before doing anything else. kubectl rollout restart doesn't even apply here, either — OpenBao's StatefulSet uses an OnDelete update strategy, so any future restart needs a manual pod deletion regardless.
Longhorn: The Missing Backup State Rule
Of the three, this one had the least investigation to do — the gap was already identified in the alert audit and the follow-up fixes, just never implemented. Longhorn exposes longhorn_backup_state per backup object, with a confirmed state enum: 0=New, 1=Pending, 2=InProgress, 3=Completed, 4=Error, 5=Unknown. The normal lifecycle observed in Prometheus is 0 → 2 → 3, with the object disappearing once the retain policy prunes it. There's no separate backup-target-availability metric in Longhorn — checked directly against the metrics reference, confirmed absent — so per-volume state is the best signal available, even though it's downstream of the actual root cause (Garage being unreachable as a backup target).
# monitoring/prometheus/prometheus-values.yaml — backup rule group
# -- Longhorn Backup State -----------------------------------------
# longhorn_backup_state is exposed per backup object via the longhorn
# job (pod discovery in longhorn-system namespace). State enum:
# 0=New, 1=Pending, 2=InProgress, 3=Completed, 4=Error, 5=Unknown.
# Normal lifecycle: 0 -> 2 -> 3 -> object pruned by retain policy.
# Fires when any backup object enters Error state (4), which during
# the June 14 incident would have triggered within 15 minutes.
# Root cause is typically the Garage backup target being unavailable
# (check GarageS3AuthErrors first if both fire simultaneously).
- alert: LonghornBackupError
  expr: longhorn_backup_state{job="longhorn"} == 4
  for: 15m
  labels:
    severity: warning
  annotations:
    summary: "Longhorn backup in error state"
    description: >
      Volume {{ $labels.volume }} has a backup in Error state (recurring_job: {{ $labels.recurring_job }}).
      Common cause: backup target unavailable (check Garage).
      Check Longhorn UI or: kubectl get backups -n longhorn-system
The fifteen-minute for: window gives Longhorn's backup controller room to retry a transiently failing job before alerting — and against the June 14 incident, which ran for sixteen hours, fifteen minutes would still have caught it well within the first hour. promtool check rules passing on all 53 rules together, plus the confirmed metric and state enum, was enough confidence to ship this one without a live test — deliberately breaking a backup target felt like the wrong way to validate a warning-severity rule.
What's Working Now
- ✅ Garage role status —
GarageS3AuthErrorslive in thebackupgroup,increase(api_s3_error_counter{job="garage", status_code="403"}[5m]) > 0,for: 10m, severity critical. Back-tested against the June 14 incident — would have fired within the first five-minute window. - ✅ OpenBao seal status — Blackbox exporter deployed in
monitoring, probing/v1/sys/healthevery scrape.OpenBaoSealedlive in theclustergroup,for: 5m, severity critical. Deliberately tested via a restart-and-upgrade — fired correctly. - ✅ Longhorn backup state —
LonghornBackupErrorlive in thebackupgroup,longhorn_backup_state{job="longhorn"} == 4,for: 15m, severity warning. Verified by metric presence and confirmed state enum; not live-tested. - ℹ️ Garage's layout health metrics (
cluster_healthy,cluster_partitions_all_ok) don't reflect this failure mode on a single-node cluster — they're not useful here, but may become relevant again if a second Garage node is added. - ℹ️ No Longhorn backup target availability metric exists — confirmed absent. Per-volume state is the best signal available today.
What's Next
The Proxmox Transit LXC that OpenBao depends on for auto-unseal is still unmonitored, and the incident above proved it's a real risk, not a hypothetical one. The next step is a Blackbox probe against openbao-transit.luwte.net:8200/v1/sys/health and a TransitLXCSealed alert in the cluster group — a predictive check that fires before it ever reaches Bletchley's OpenBao. That's now tracked as a todo item.
There's also a broader question worth sitting with: all three alerts in this post are one-off, service-specific solutions to the same underlying shape of risk — a stateful service that can come back from a restart broken, with no signal to catch it. Three separate rules is fine at three services, especially when only two have actually misbehaved so far. Whether that's still the right approach at five or six stateful services, or whether a small set of generic synthetic health probes is worth building instead — so the next one gets monitored before an incident forces the question — is open for whenever the next one shows up.
← Previous: Fixing a Postgres Backup Failure
Questions or suggestions? Leave a comment below or reach out at igor@vluwte.nl.