Auditing the Alerts: What's Noise, What's Missing, What's Broken
Four months of running alerting on a homelab cluster. One false positive, one correct-but-broken underlying issue, eight days of silent backup failure, and what a rule-by-rule review actually looks like.
Introduction
Alerts are only useful if you trust them. When an alert fires and turns out to be nothing — again — the instinct is to dismiss the next one too. That erosion is silent and cumulative. By the time a real problem fires, you've trained yourself to ignore it.
The Bletchley cluster has been running alerting since Part 4 — about four months ago now. The rules were written at the start, mostly as a setup exercise. They covered the obvious things: disk full, node down, pod restarts. What they didn't account for was the reality of running the cluster through growth, hardware changes, and a series of incidents that exposed gaps. After around 120 days of operation, this post is the review that resulted from asking: which of these rules is actually working, which is crying wolf, and what's missing entirely?
The short answer: one clear false positive, one alert that's correct but pointing at an unresolved underlying problem, several gaps that needed new rules, and a backup that had been silently broken for eight days — found by going through the Grafana dashboards and noticing a metric that had stopped updating.
🔭 This is part of the Cluster Observability series - building a complete observability stack on a homelab Kubernetes cluster.
- Log-Based Alerting with Loki Ruler
- Auditing the Alerts: What's Noise, What's Missing, What's Broken (you are here)
Starting Point: What's Currently Firing
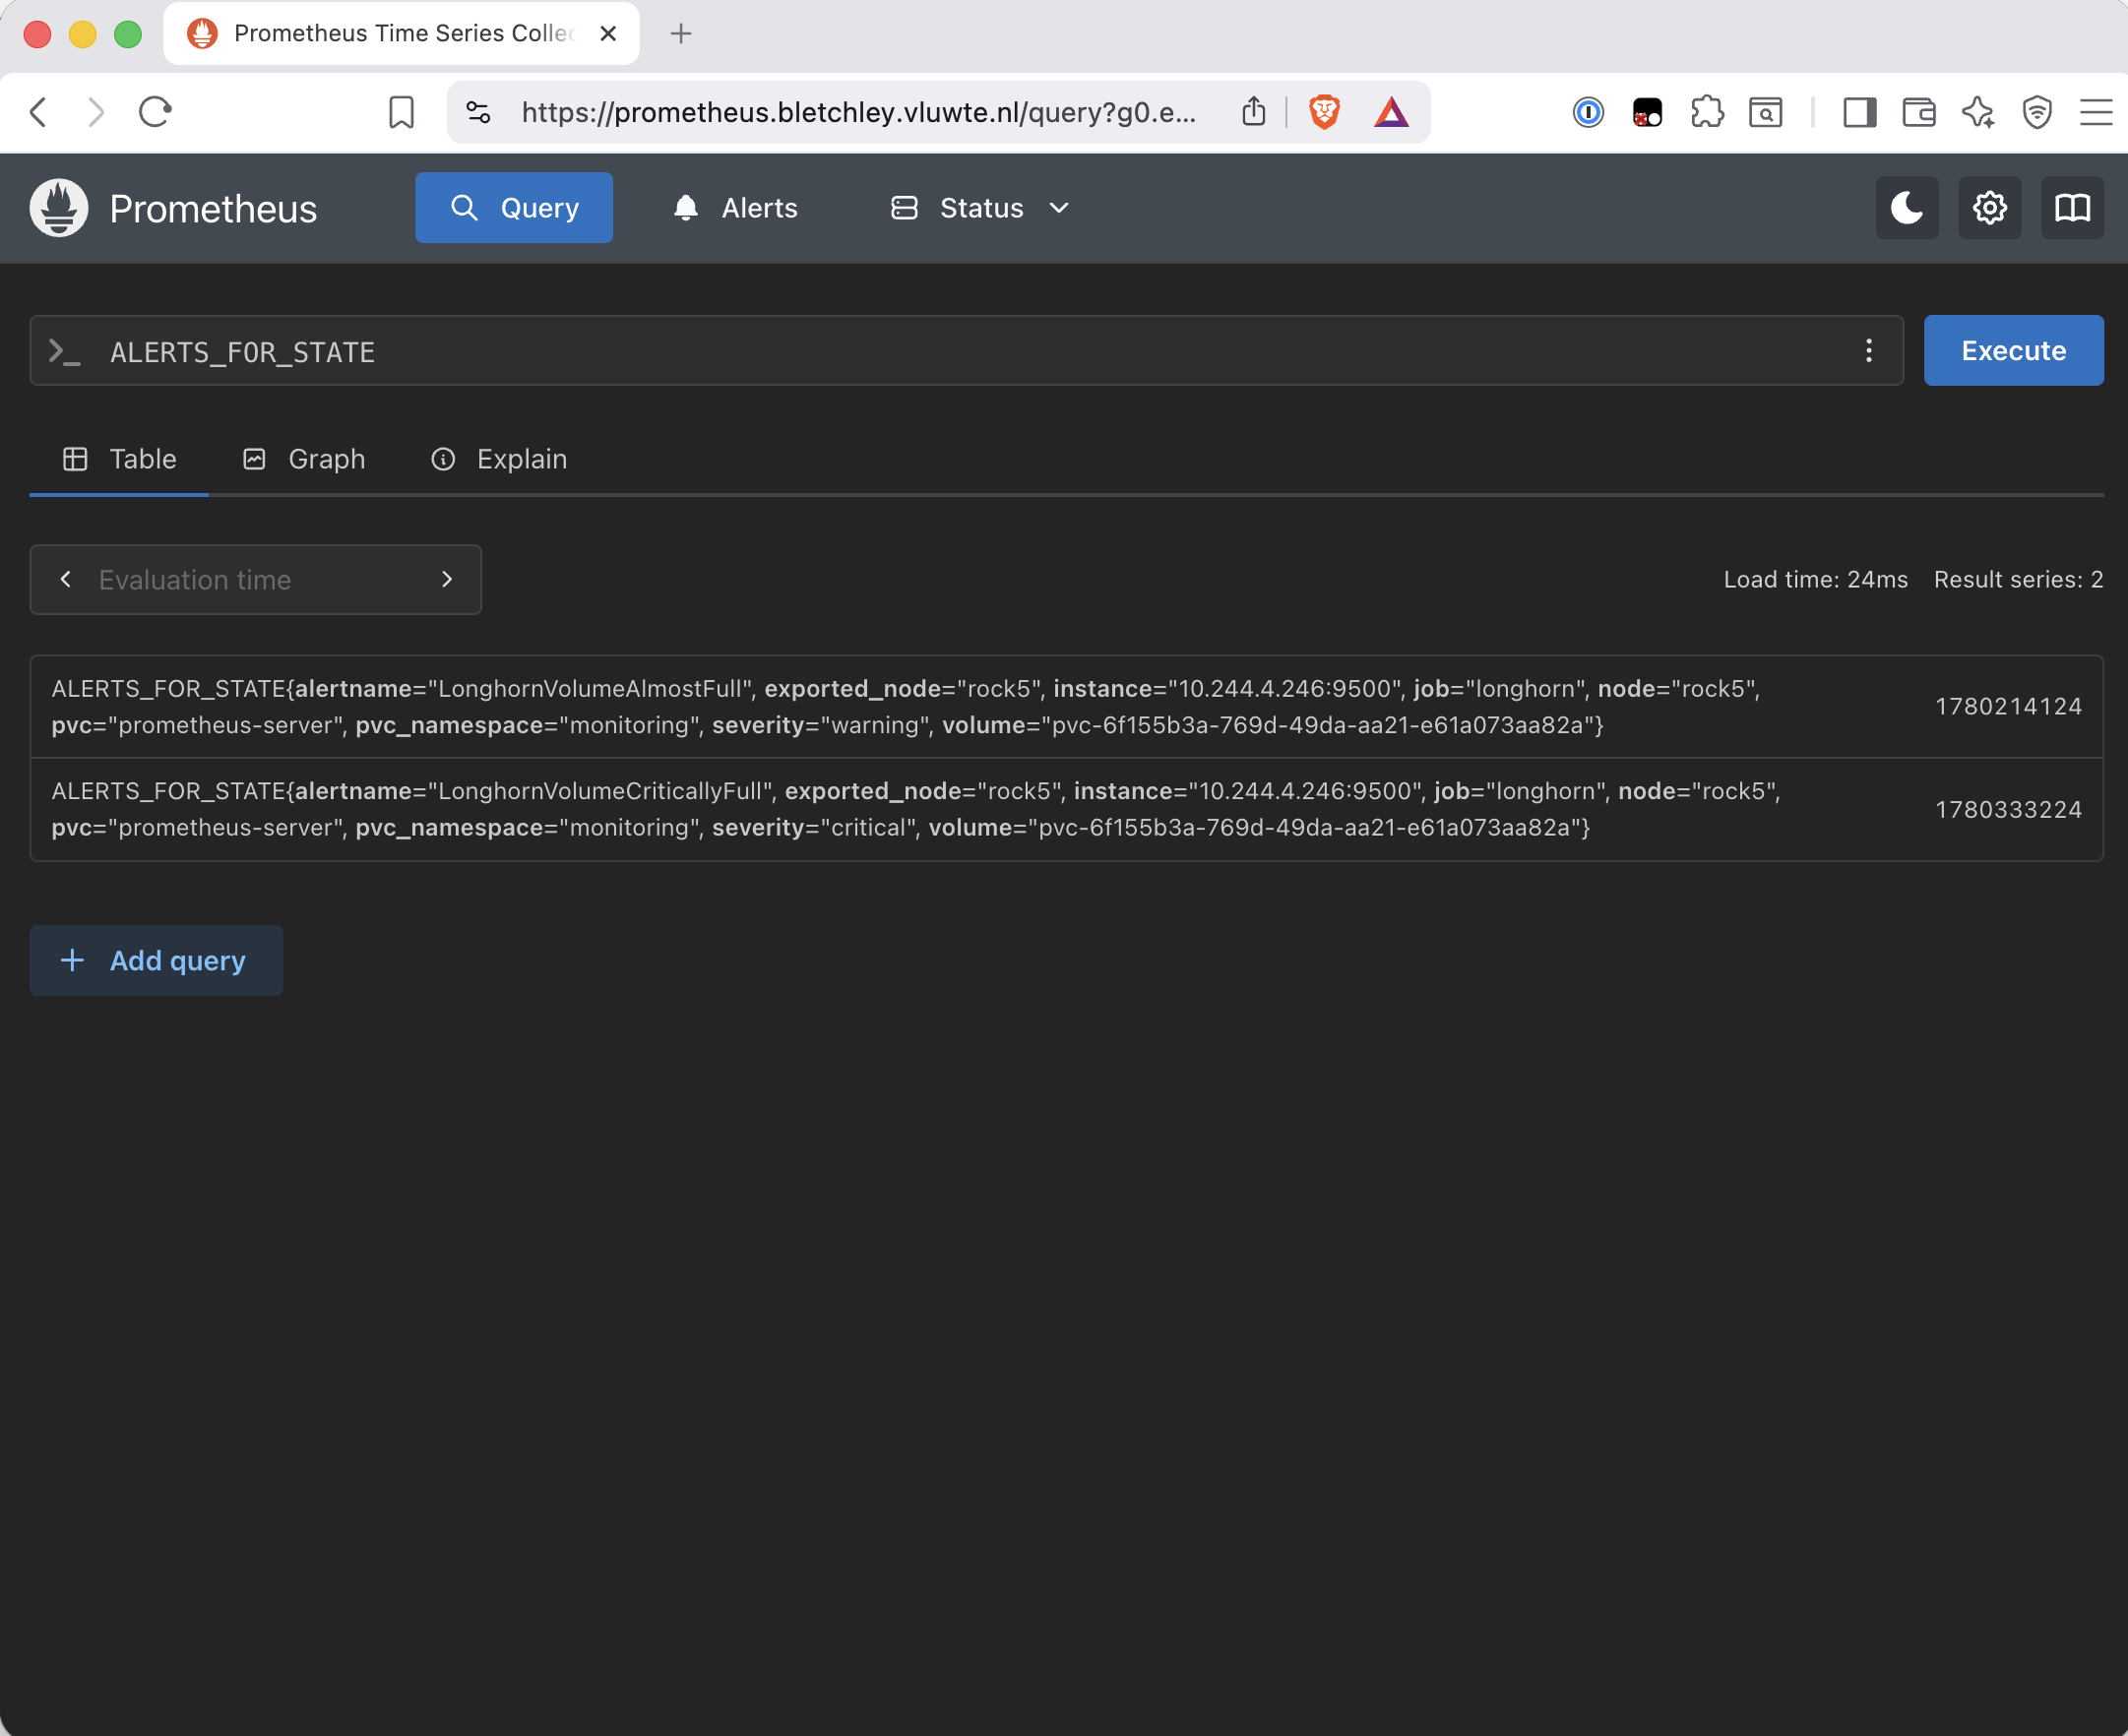
Before going rule by rule, the first question is: what is the alerting stack actually doing right now? The Prometheus Alerts page shows current state, and ALERTS_FOR_STATE gives the epoch timestamp of when each alert entered pending — useful for seeing how long something has been continuously firing.
Running it now shows two active alerts, both on the prometheus-server PVC in the monitoring namespace: LonghornVolumeAlmostFull has been firing for about 1.4 days, and LonghornVolumeCriticallyFull fired about 36 minutes ago. Both point at the same volume, the same underlying problem. That's where the review starts.
ALERTS_FOR_STATE is handy for confirming duration and spotting alerts that have been quietly firing for longer than you realised. It won't surface problems you haven't defined rules for — that requires looking at the dashboards directly. The backup finding later in this post came from Grafana, not from this query.
The Fan Alert: A Clear False Positive
The NodeFanStopped alert was written early and defined simply: if node_hwmon_fan_rpm == 0 for two minutes, fire. The logic seemed sound — a fan at zero RPM isn't spinning, and a fan that isn't spinning is a problem.
The alert had been quiet for a while. What changed was adding a case fan to improve airflow inside the TuringPi enclosure. Better airflow meant lower ambient temperatures, which meant the PWM controller started commanding the CPU fans off more often — sometimes they would stay off for extended periods without ever spinning up at all. That's when the alerts started firing regularly.
The reality is more subtle. The RK3588 SoC on these nodes has a PWM fan controller. Under low load, the fan controller commands the fan off — cur_state == 0 on the node_cooling_device_cur_state metric. At that point, 0 RPM is correct. The fan stopped because it was told to stop, not because it failed. The case fan had simply made "told to stop" the normal state rather than the occasional one.
The original rule fires during every low-load period. On an idle homelab cluster, that's most of the time.
The fix is a compound expression. Fire only when the fan is at zero RPM and the cooling controller is commanding it to spin:
node_hwmon_fan_rpm == 0
  AND ON(instance)
node_cooling_device_cur_state{type="pwm-fan"} > 0
The AND ON(instance) join matches the two metrics by node. If cur_state == 0, the condition short-circuits — the fan is idle by command, not by failure. If cur_state > 0 and rpm == 0, something is wrong.
The severity was also downgraded from critical to warning. A stopped fan under low load isn't an immediate emergency — the node will throttle before thermal damage occurs. During the review, I applied a simple rule: critical alerts should represent issues worth waking someone up for. Everything else should start as warning.
This change validated cleanly over 24 hours of monitoring: a 45-second transient fan stop at low load produced no alert. rock5 (which runs permanently at cur_state == 0) produces no result at all.
The Prometheus PVC Alert: Correct but Pointing at the Wrong Problem
The LonghornVolumeAlmostFull alert for the prometheus-server PVC is not a false positive. It's firing because the Longhorn replica layer genuinely reports ~97% allocation on a 40Gi volume. The problem is that this doesn't match what the filesystem sees:
| Layer | Used | Capacity | % |
|---|---|---|---|
Filesystem (kubelet_volume_stats_used_bytes) |
5.15 GiB | 39.27 GiB | 13% |
Longhorn replica (longhorn_volume_actual_size_bytes) |
~38.9 GiB | 40 GiB | ~97% |
Longhorn tracks every block address ever written to the replica. When Prometheus deletes old TSDB blocks, the filesystem reclaims the space immediately, but the Longhorn replica layer doesn't release those blocks without a trim/discard signal. Without that signal, the allocation floor only goes up — and the graph shows exactly that: a sawtooth pattern where each backup run spikes the allocation, but the floor between spikes never returns to where it was.
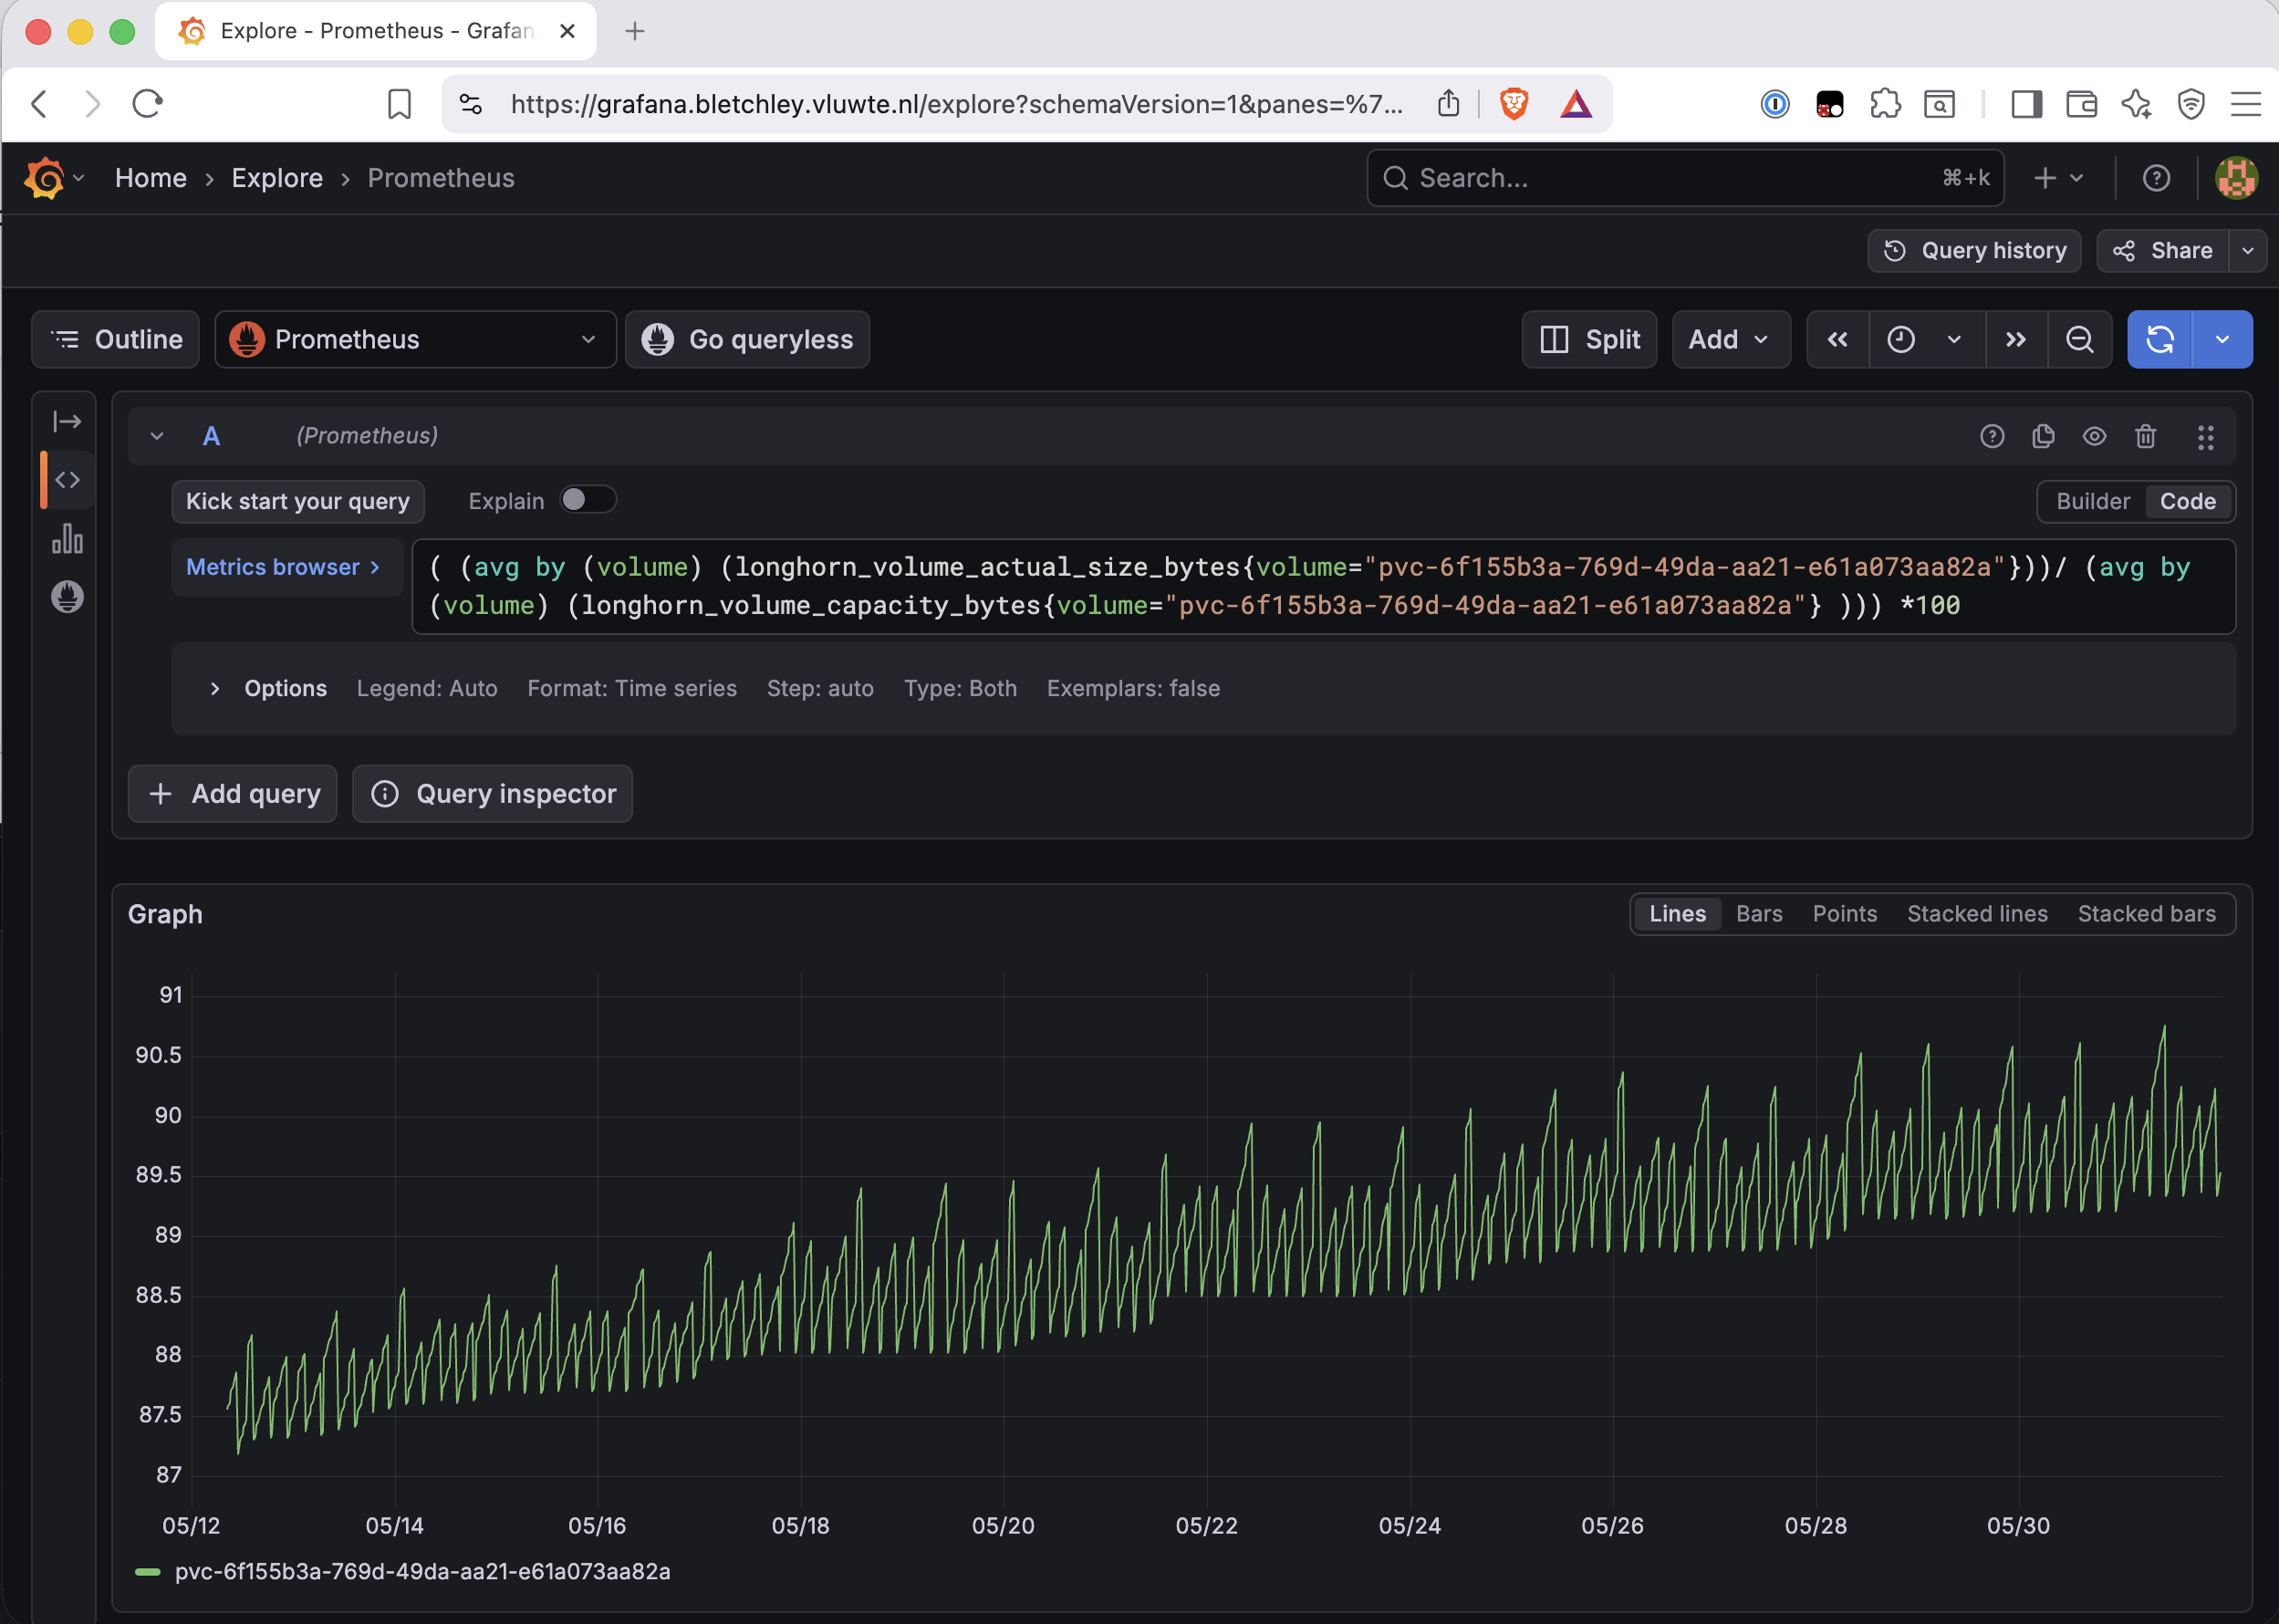
The alert is correct to fire. Resolving it requires fixing the discard configuration — not adjusting the threshold. That investigation is covered in the Longhorn fstrim follow-up post.
NTP: New Rules Needed
The cluster has no alerting for time drift. For a cluster running etcd, this matters — etcd is sensitive to clock skew between members, and the Kubernetes control plane assumes reasonably synchronised time.
node_timex_estimated_error_seconds returns no useful data on these nodes. node_timex_offset_seconds is available on all seven nodes and shows the right signal: baseline essentially zero, occasional spikes to ~30ms that self-resolve within one scrape interval. Those spikes are normal NTP correction events.
Two new rules address this:
- alert: NodeTimeDrift
  expr: abs(node_timex_offset_seconds) > 1.0
  for: 15m
  labels:
    severity: warning
  annotations:
    summary: "Clock on {{ $labels.instance }} is drifting"

- alert: NodeNTPNotSyncing
  expr: node_timex_sync_status != 1
  for: 5m
  labels:
    severity: critical
  annotations:
    summary: "NTP sync lost on {{ $labels.instance }}"
The 15-minute for duration on NodeTimeDrift filters out the transient ~30ms spikes — those are NTP working correctly, not a problem. A one-second threshold is far above normal NTP correction behaviour but well below the point where distributed systems begin exhibiting strange behaviour. NodeNTPNotSyncing catches the failure mode where time sync is lost entirely, which is more urgent.
TLS Certificates: Safety Net for cert-manager
cert-manager renews certificates automatically, but the ESO incident showed that a renewal can fail silently if the cert-manager configuration has a mismatch. An expiry alert provides a safety net for those silent failures.
cert-manager exposes the certmanager_certificate_expiration_timestamp_seconds metric, one series per certificate. The rule fires when a certificate is fewer than 7 days from expiry:
- alert: CertificateExpiringSoon
  expr: |
    (certmanager_certificate_expiration_timestamp_seconds - time()) / 86400 < 7
  for: 1h
  labels:
    severity: warning
  annotations:
    summary: "Certificate {{ $labels.name }} expires in less than 7 days"

- alert: CertificateExpiryCritical
  expr: |
    (certmanager_certificate_expiration_timestamp_seconds - time()) / 86400 < 3
  for: 1h
  labels:
    severity: critical
  annotations:
    summary: "Certificate {{ $labels.name }} expires in less than 3 days"
cert-manager annotates its service endpoints for auto-discovery, so no additional scrape configuration is needed if kubernetes-service-endpoints job discovery is already in place.
Memory Pressure: rock3 is the Hotspot
There's no current alert for memory exhaustion. With 8 GiB per node, that's been acceptable — but rock3 is running the control plane, Grafana, Garage, and NFS simultaneously. It's the node most likely to have a problem.
Two new rules cover this:
- alert: NodeMemoryPressure
  expr: |
    node_memory_MemAvailable_bytes / node_memory_MemTotal_bytes < 0.15
  for: 10m
  labels:
    severity: warning
  annotations:
    summary: "Low memory on {{ $labels.instance }} — less than 15% available"

- alert: NodeMemoryCritical
  expr: |
    node_memory_MemAvailable_bytes / node_memory_MemTotal_bytes < 0.05
  for: 5m
  labels:
    severity: critical
  annotations:
    summary: "Critical memory on {{ $labels.instance }} — less than 5% available"
15% warning / 5% critical on 8 GiB = ~1.2 GiB / ~410 MiB thresholds. The 10-minute for on the warning filters out temporary spikes; the 5-minute for on critical keeps the response time short for genuine exhaustion.
PVC Coverage and the Deployment Replicas Rule
Two additional gaps were closed during the review:
PVCAlmostFull and PVCCriticallyFull rules were added using kubelet_volume_stats_used_bytes to complement the existing Longhorn-layer alerts. These catch cases where the filesystem itself is genuinely full, which is a different signal from the Longhorn allocation issues described above.
The DeploymentReplicasUnavailable rule was adjusted from a 5-minute for to a 15-minute for. The 5-minute threshold was generating alerts during normal rolling updates, where pods briefly go unavailable before the new version is up. 15 minutes filters out those transitions while still catching genuine replica failures.
What the Review Found That Rules Can't See
The most significant finding didn't come from rule evaluation at all — it came from looking at the Grafana dashboards and noticing that one backup metric had stopped updating.
One backup job's backup_success metric had not changed in eight days. The metric existed, the job appeared in the controller's output, but the last successful run timestamp was over a week old. No alert had fired because no rule watched for a stale timestamp — the existing rules checked that jobs ran, not that they succeeded.
That finding opened a separate investigation: eight days, five root causes, one fixed backup system. That story is coming.
What's Confirmed Working
Not everything needed changing. Several rules were reviewed and confirmed correct:
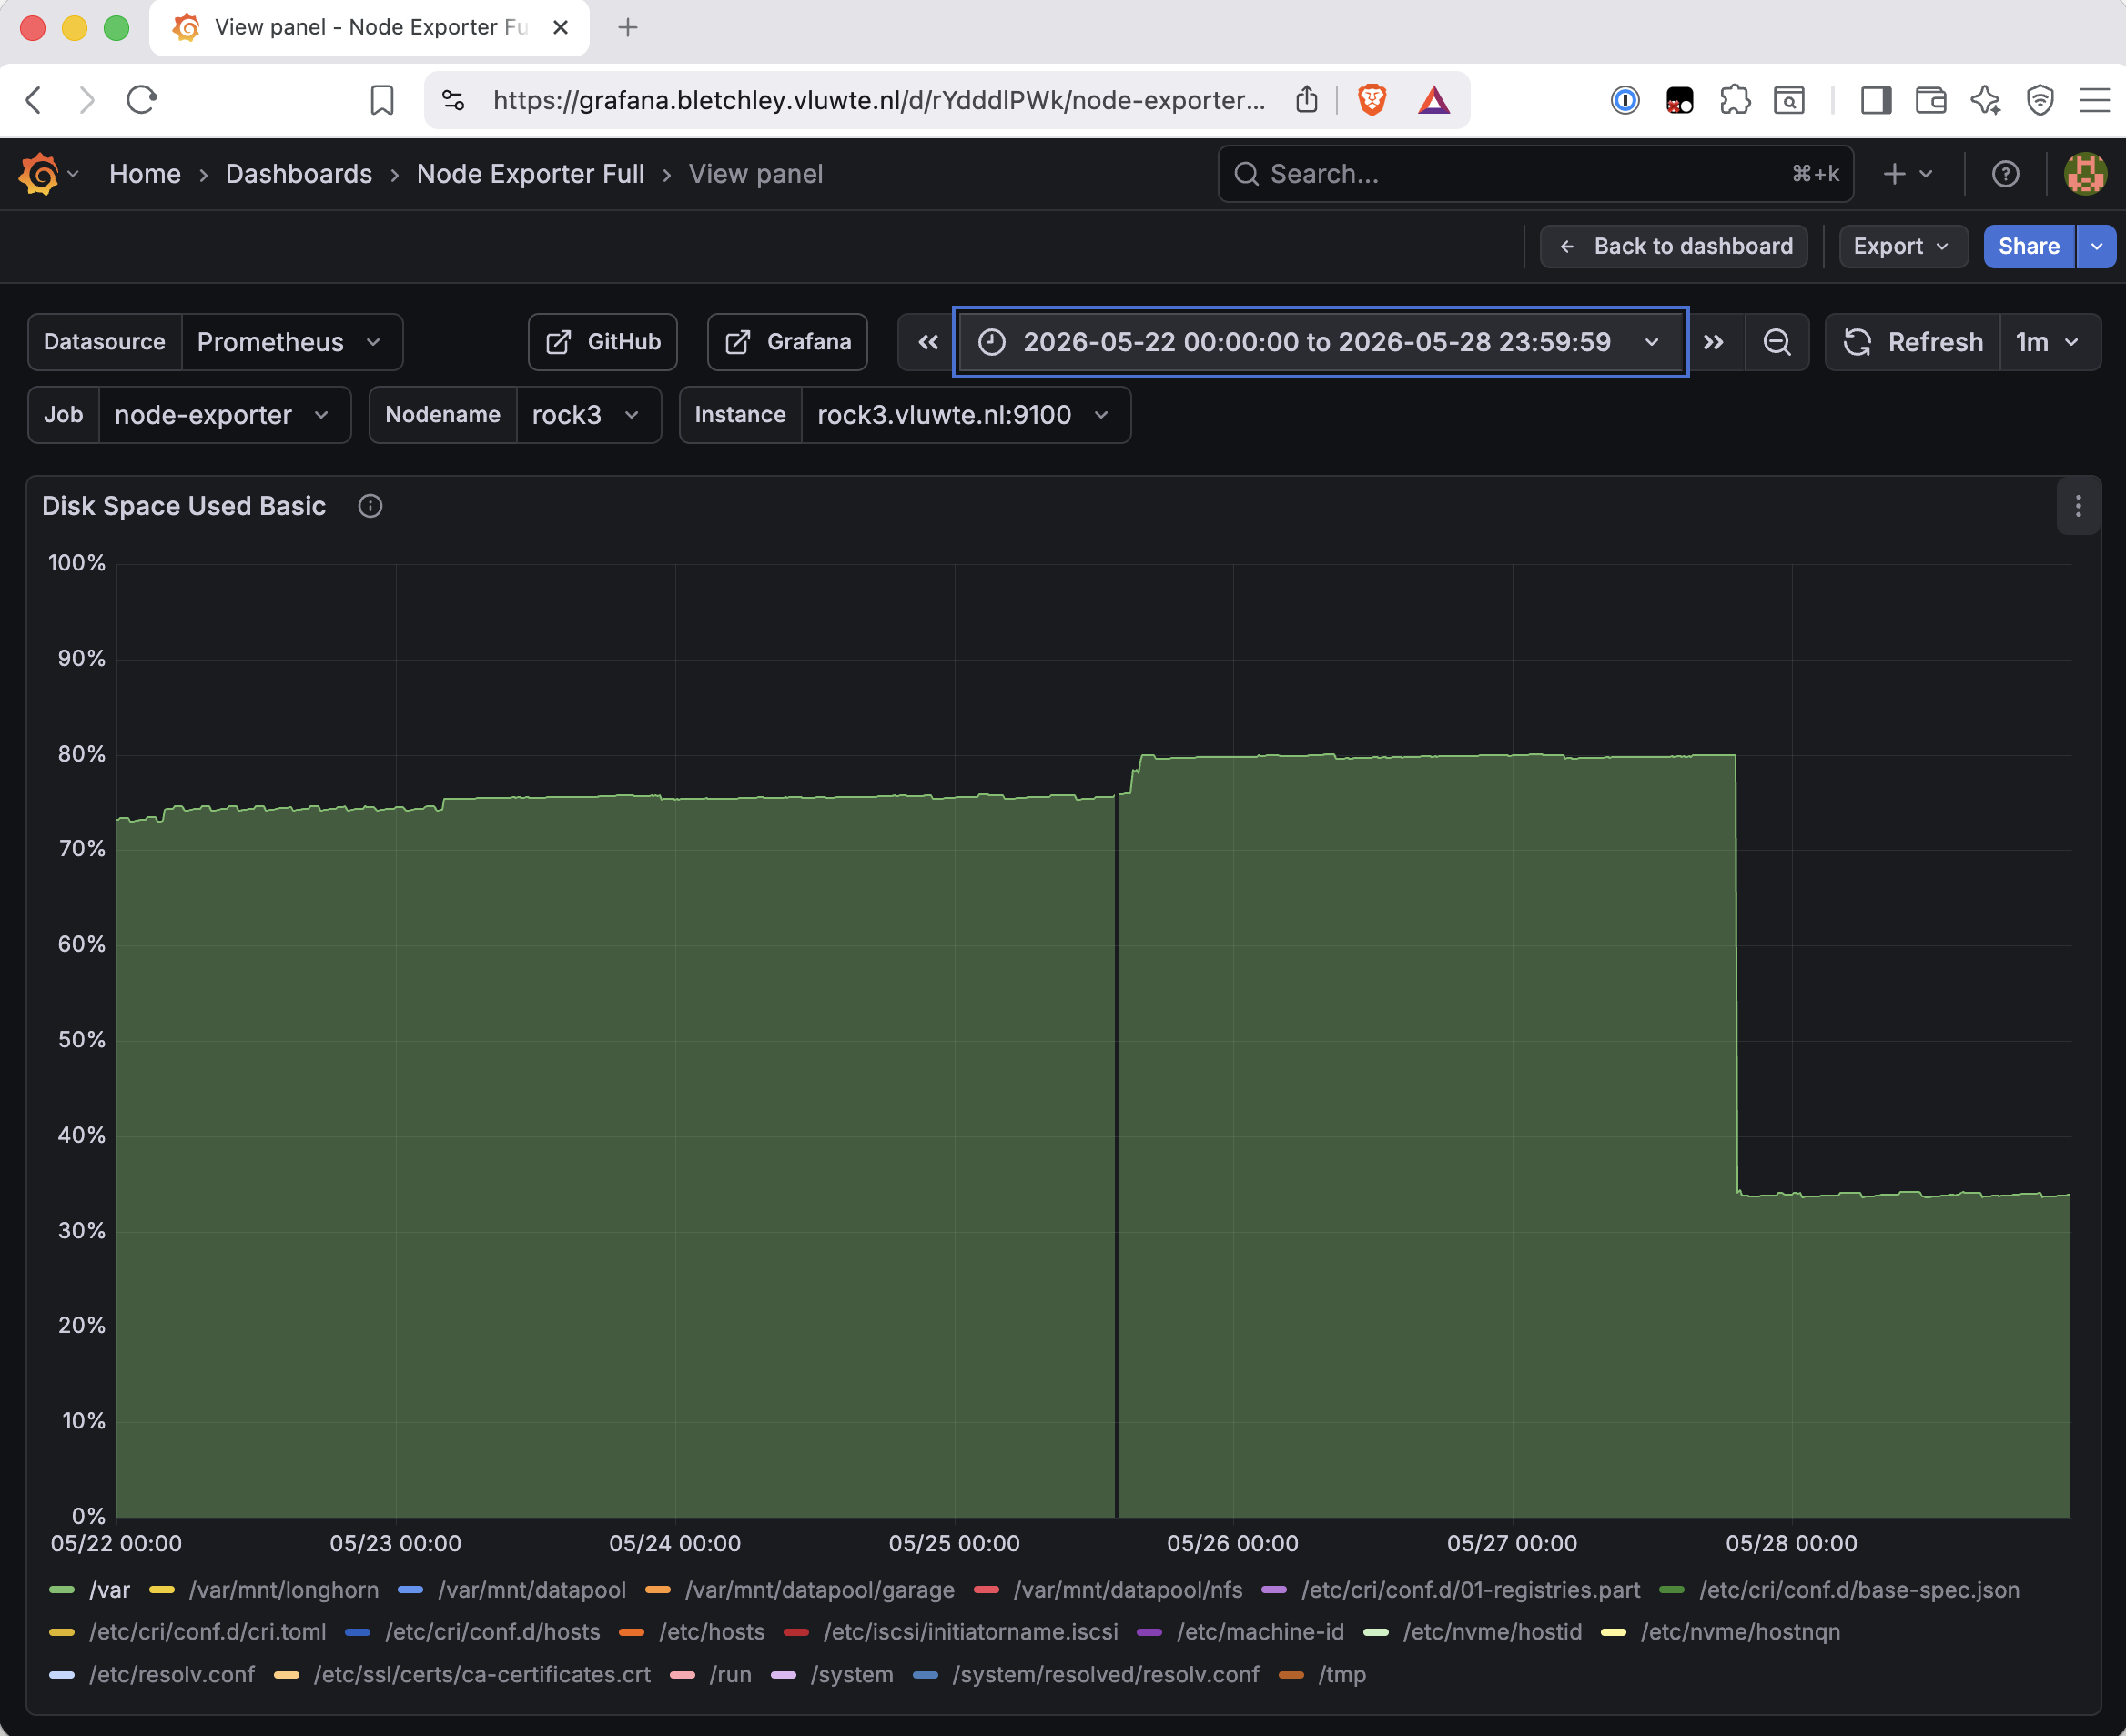
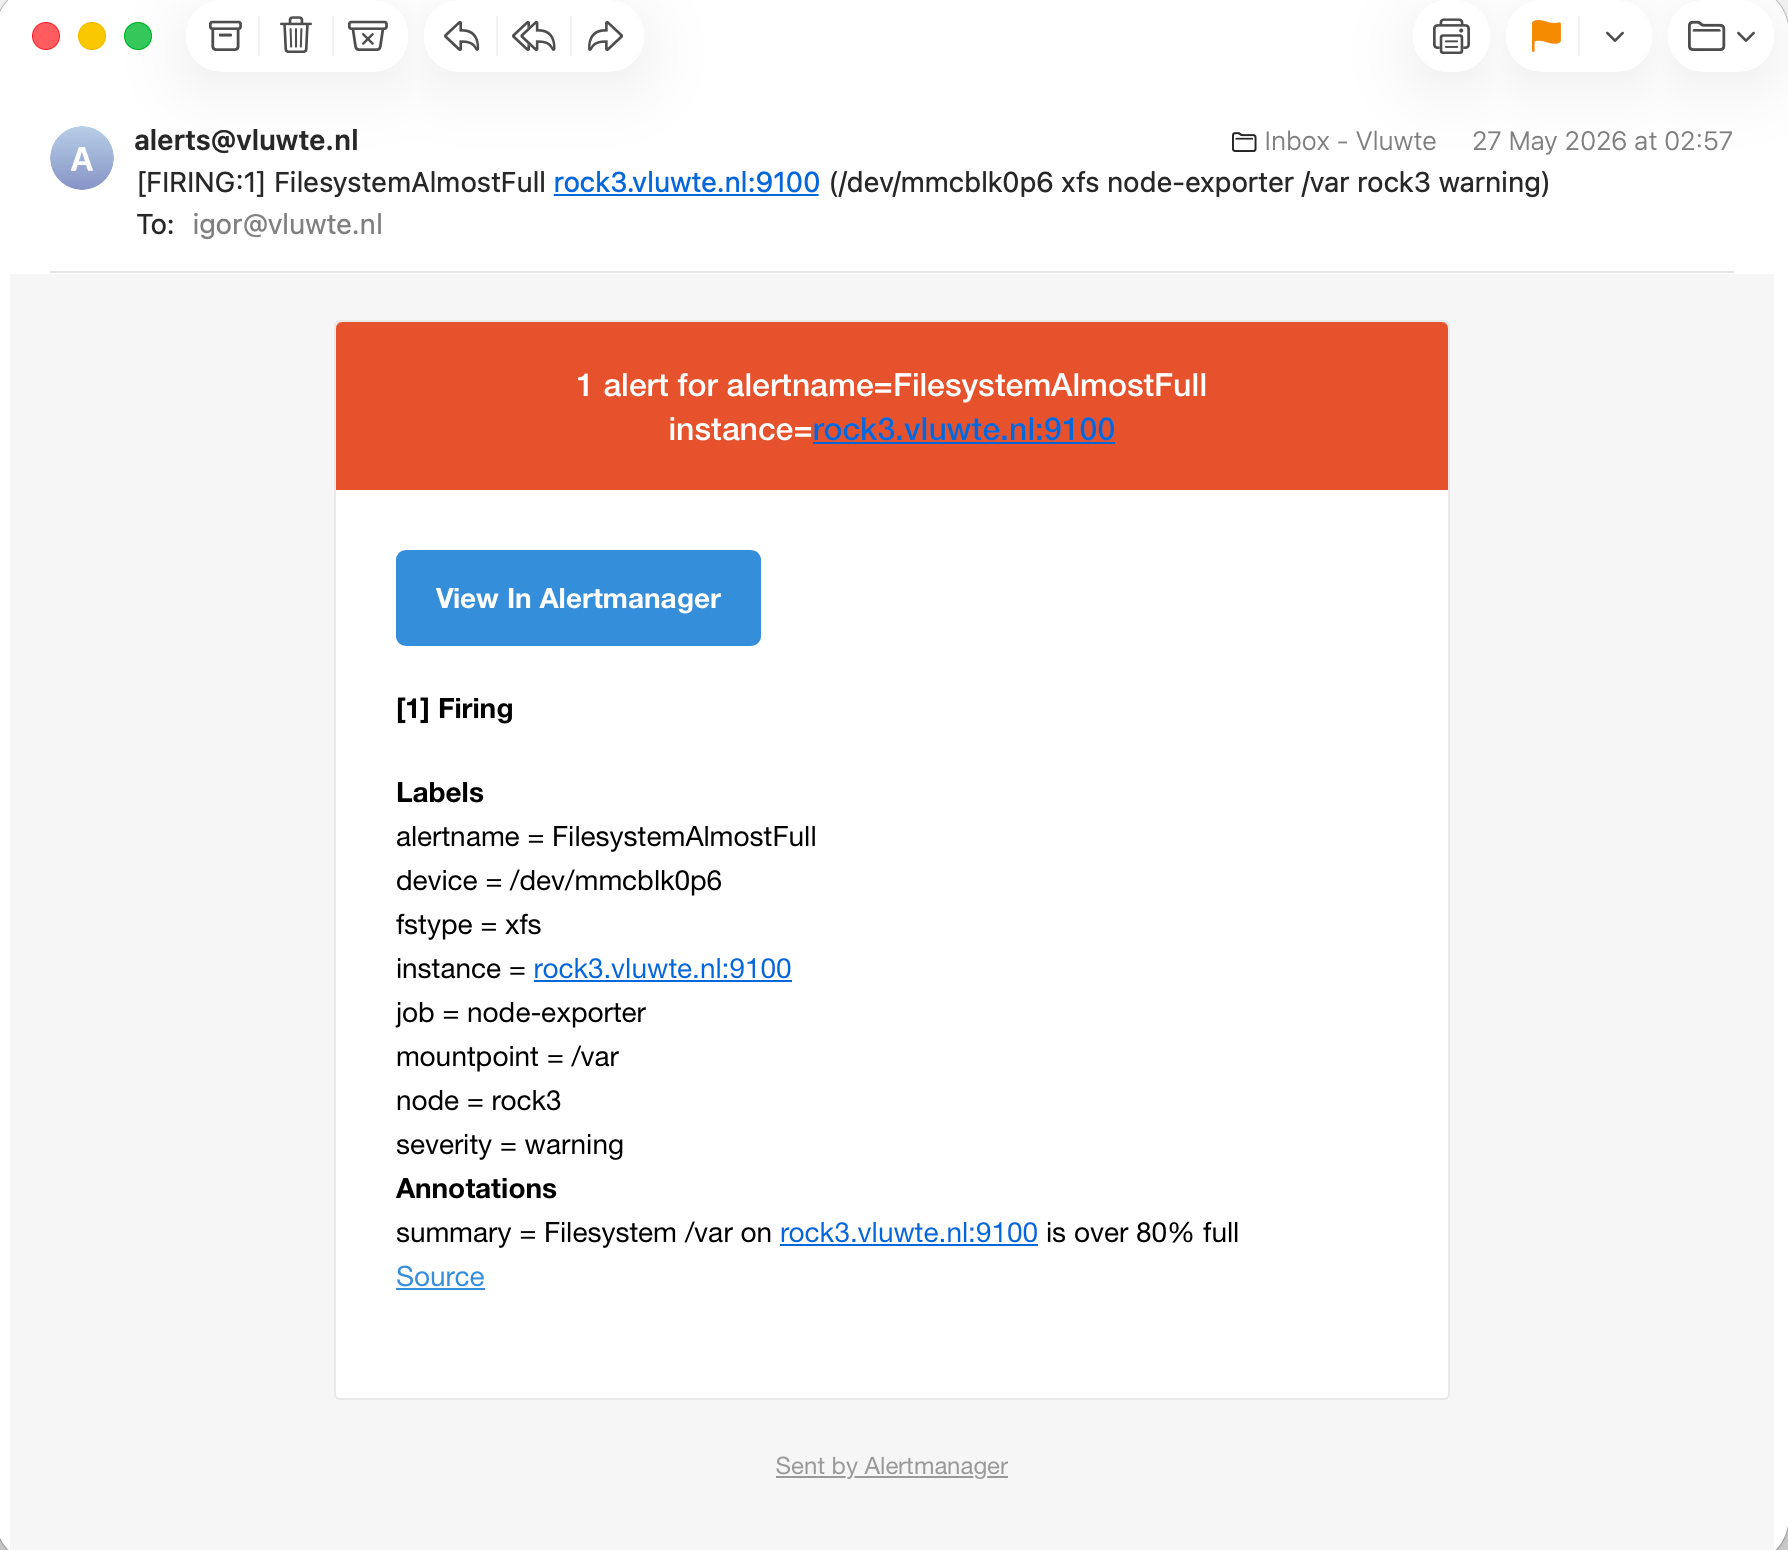
Filesystem alerts (FilesystemAlmostFull, FilesystemCriticallyFull) — correct thresholds, correct exclusions for tmpfs and overlay. No changes. The review actually caught a real example of these working correctly: /var on rock3 had been gradually filling from ~73% on May 22 to ~79% by May 25-26, crossed the 80% threshold, and the alert fired at 02:57 on May 27. Log rotation ran the following day and brought it back down to ~33%, the alert resolved, and no manual intervention was needed.
Node down (NodeDown) — works as expected. Tested during the Talos upgrade procedure.
Longhorn volume robustness (LonghornVolumeDegraded, LonghornVolumeFaulted) — not testable without risking a replica, but the PromQL expressions are correct against the metric names.
Garage health (GarageClusterUnhealthy, GarageClusterUnavailable) — confirmed correct metric names (cluster_healthy, cluster_available, no garage_ prefix). volume="data" filter prevents double-firing from duplicate Garage disk metrics.
Hardware temperature and SMART rules — thresholds sourced from manufacturer data and node_hwmon_temp_crit_celsius are unchanged. These were validated during the Part 6 testing session.
Open Items
One thing is known-unresolved at the end of this review:
Longhorn fstrim — the Prometheus PVC alert will keep firing until the StorageClass discard configuration is fixed. The allocation floor is rising. Mid-July 2026 is the current projected floor-at-capacity date.
← Previous: Log-Based Alerting with Loki Ruler
Questions or suggestions? Leave a comment below or reach out at igor@vluwte.nl.