Cluster Observability Part 11: Log-Based Alerting with Loki Ruler
Loki ruler setup, four log-based alert rules from real Part 10 findings, a silent config gotcha, end-to-end test, and the complete dual alerting architecture.
Introduction
When Loki went in at Part 7, the plan was always two things: use the logs for investigation, and use them for alerting. Parts 8 through 10 covered the first half — understanding what the cluster logs, how to read them, and hunting for real errors with LogQL. This post closes the second half.
Part 10 produced four concrete findings: a Forgejo backup silently failing for three weeks, a Postgres housekeeping script hitting a region mismatch it never reported, an Authelia crash sequence visible in logs before any metric changed, and CrashLoopBackOff events where log-based detection adds namespace context that the Prometheus restart counter alone doesn't surface. Those findings are the alert rules for this post.
With the ruler configured and the rules applied, the log observability plan is complete. Loki now alerts on log content the same way Prometheus alerts on metrics — and both paths land in the same Alertmanager, using the same routing, delivering to the same email receiver.
This post is part of the Cluster Observability sub-series.
- Part 7: Log Aggregation
- Part 8: Talos System Logs
- Part 9: Know Your Logs Before You Hunt Them
- Part 10: Hunting for Errors with LogQL
- Part 11: Log-Based Alerting
This post assumes you have Loki installed and Alertmanager running. The Loki setup is covered in Part 7, and Alertmanager in Part 4.
The Gap: What Metrics Don't See
Prometheus has been alerting on cluster health for a while — pod restarts, disk usage, hardware health, backup freshness. That coverage is real. But three findings from Part 10 pointed at a different kind of gap:
Forgejo backup failing silently for three weeks. The backup CronJob completed without error from Kubernetes' perspective. The pod ran, finished, and exited with code 0. No metric changed. The failure was visible only in the dump container logs, where klog [E] lines showed an image/schema mismatch on every run. PodRestartingTooOften never fired. There was nothing to fire on.
Postgres housekeeping hitting a Garage 400. The housekeeping script is calling the AWS CLI against the internal Garage S3 endpoint with us-east-1 hardcoded as the region. Garage returns 400 Bad Request on every housekeeping operation. The error surfaced in Garage logs, not Postgres logs, and not in any metric. The script kept running on schedule. Nothing alerted.
Authelia crashing after i/o timeout. The timeout itself — i/o timeout appearing in Authelia logs — precedes the pod restart by about 90 seconds. PodRestartingTooOften eventually fires, but by then the restart has already happened. The log line is the early signal. Alerting on the log content is more actionable than alerting on the consequence.
The PodCrashLoopFromLogs rule is different in nature from the other three. Prometheus already catches CrashLoopBackOff via PodRestartingTooOften. What the kubelet log rule adds is namespace visibility directly in the alert — the kubelet log line includes the pod namespace, which the Prometheus counter doesn't. It's complementary, not a replacement.
Three of the four rules catch things metrics would never surface. The fourth makes an existing alert more informative.
Configuring the Loki Ruler
The ruler runs as part of the Loki monolithic deployment. It needs three things: a rulerConfig block pointing at Alertmanager, a sidecar configuration that watches for rule ConfigMaps, and ruler.enabled: true as a top-level key. That last one caused the first problem.
The Loki Helm chart distinguishes between loki.ruler (Loki's internal configuration block) and ruler.enabled (the chart-level switch that actually activates the ruler component). Without ruler.enabled: true, the ruler process doesn't start. Without loki.rulerConfig (note: rulerConfig, not ruler), the alertmanager_url is silently ignored and never makes it into the running Loki config.
Here's the final values.yaml with the ruler additions:
#apps/monitoring/loki/values.yaml
deploymentMode: Monolithic  # renamed from SingleBinary in chart v12

ruler:
  enabled: true

loki:
  auth_enabled: false  # single-tenant in-cluster — no credentials needed

  commonConfig:
    replication_factor: 1  # single Loki replica

  storage:
    type: filesystem  # Longhorn PVC — no object storage needed

  schemaConfig:
    configs:
      - from: "2024-04-01"
        store: tsdb   # TSDB is the recommended index for Loki 3.x
        object_store: filesystem
        schema: v13
        index:
          prefix: loki_index_
          period: 24h

  ingester:
    wal:
      enabled: true          # Write-Ahead Log — protects against data loss on crash
      dir: /var/loki/wal

  limits_config:
    retention_period: 30d
    ingestion_rate_mb: 4            # cap ingestion rate per tenant
    ingestion_burst_size_mb: 8      # allow short bursts above the rate limit
    max_streams_per_user: 10000     # guard against cardinality explosion

  compactor:
    retention_enabled: true         # required for retention_period to take effect
    compaction_interval: 10m
    retention_delete_delay: 2h      # safety window — logs not immediately removed on deletion
    delete_request_store: filesystem

  rulerConfig:
    enable_api: true
    alertmanager_url: http://prometheus-alertmanager.monitoring.svc.cluster.local:9093
    storage:
      type: local
      local:
        directory: /var/loki/rules
    rule_path: /var/loki/rules-temp
    ring:
      kvstore:
        store: inmemory

singleBinary:
  replicas: 1
  persistence:
    storageClass: longhorn
    size: 20Gi
    whenDeleted: Retain
    labels:
      backup.vluwte.nl/name: loki
      backup.vluwte.nl/enabled: "true"
      backup.vluwte.nl/start: "0045"  # start 15 minutes after default

sidecar:
  rules:
    enabled: true
    label: loki_rule
    labelValue: "true"
    folder: /var/loki/rules/fake

backend:
  replicas: 0
read:
  replicas: 0
write:
  replicas: 0

chunksCache:
  enabled: false

resultsCache:
  enabled: false
A few things worth noting. The folder: /var/loki/rules/fake in the sidecar config matters. Without it, the sidecar defaults to writing rule files to /rules — its own target directory — instead of the path the ruler expects. In single-tenant mode (auth_enabled: false), Loki internally uses the synthetic tenant ID fake for ruler storage paths. The ruler expects rules under /var/loki/rules/fake/. The sidecar needs to know this explicitly.
The upgrade:
helm upgrade --install loki \
  oci://ghcr.io/grafana-community/helm-charts/loki \
  --version 13.6.2 \
  --namespace monitoring \
  --values apps/monitoring/loki/values.yaml
Confirming the ruler started:
kubectl logs -n monitoring loki-0 -c loki | grep -i ruler
# loki level=info msg="ruler up and running"
No Alertmanager configuration changes were needed. Loki-sourced alerts use the same routing and receiver already in place for Prometheus.
Writing the Rules
Rules go in a ConfigMap labelled loki_rule: "true". The sidecar watches for that label and writes the file to the correct path inside the Loki pod. No manual file placement needed.
#apps/monitoring/loki/alerting-rules.yaml
apiVersion: v1
kind: ConfigMap
metadata:
  name: loki-alerting-rules
  namespace: monitoring
  labels:
    loki_rule: "true"
data:
  rules.yaml: |
    groups:
      - name: cluster-log-alerts
        rules:
          - alert: ForgejoBackupFailed
            expr: |
              count_over_time(
                {namespace="forgejo", container="forgejo-dump"} |~ `\[E\]` [15m]
              ) > 0
            for: 1m
            labels:
              severity: warning
            annotations:
              summary: "Forgejo backup job failed"
              description: "Error detected in forgejo-backup pod logs — possible image/schema mismatch after upgrade"

          - alert: AutheliaIOTimeout
            expr: |
              count_over_time(
                {namespace="authelia"} |= "i/o timeout" [5m]
              ) > 0
            labels:
              severity: warning
            annotations:
              summary: "Authelia i/o timeout — pod may restart"
              description: "Traefik ForwardAuth connection timed out in Authelia; restart expected within ~90 seconds"

          - alert: PostgresHousekeepingFailed
            expr: |
              count_over_time(
                {namespace="garage"} |= "400 Bad Request" |= "housekeeping" [30m]
              ) > 0
            labels:
              severity: warning
            annotations:
              summary: "Postgres housekeeping script failed against Garage"
              description: "Garage returned 400 Bad Request for a housekeeping S3 operation — likely AWS CLI region mismatch (us-east-1 vs garage)"

          - alert: PodCrashLoopFromLogs
            expr: |
              count_over_time(
                {job="talos-service", talos_service="kubelet"} |= "CrashLoopBackOff" [5m]
              ) > 0
            for: 1m
            labels:
              severity: warning
            annotations:
              summary: "CrashLoopBackOff detected in kubelet logs"
              description: "One or more pods entering CrashLoopBackOff — check kubelet logs for pod_namespace detail"
Apply it:
kubectl apply -f apps/monitoring/loki/alerting-rules.yaml
# configmap/loki-alerting-rules created
The for duration. ForgejoBackupFailed and PodCrashLoopFromLogs both use for: 1m — the condition must hold for a full minute before the alert fires. This avoids firing on a single transient log match. AutheliaIOTimeout and PostgresHousekeepingFailed omit for entirely, which means they fire on the first evaluation where the condition is true. For those two, the first match is already worth acting on — a Garage 400 on a housekeeping operation or an Authelia i/o timeout aren't transient noise.
Two LogQL details worth noting. First: the ForgejoBackupFailed rule uses container="forgejo-dump" as the stream selector, not a pod label. On Bletchley, Alloy is configured to index namespace, pod, container, node, and a handful of service-specific labels — pod labels from Kubernetes (like app or app.kubernetes.io/name) are not part of the indexed stream. Using them as stream selectors would force Loki to scan log chunks rather than selecting indexed streams directly. container="forgejo-dump" is the right selector here because it's indexed and uniquely identifies the dump container within the forgejo namespace.
Second: the |~ \[E]`syntax. The backtick quoting avoids having to escape the square brackets in the regex. Inside backticks,[E]is passed literally to the regex engine. The brackets are necessary because[E]without escaping would be interpreted as a character class matching onlyE`, which happens to work in this case but is not the intended match. Escaping the brackets makes the intent explicit.
Confirming the sidecar picked up the rules:
kubectl logs -n monitoring loki-0 -c loki-sc-rules | tail -5
# "Writing /var/loki/rules/fake/rules.yaml (ascii)"
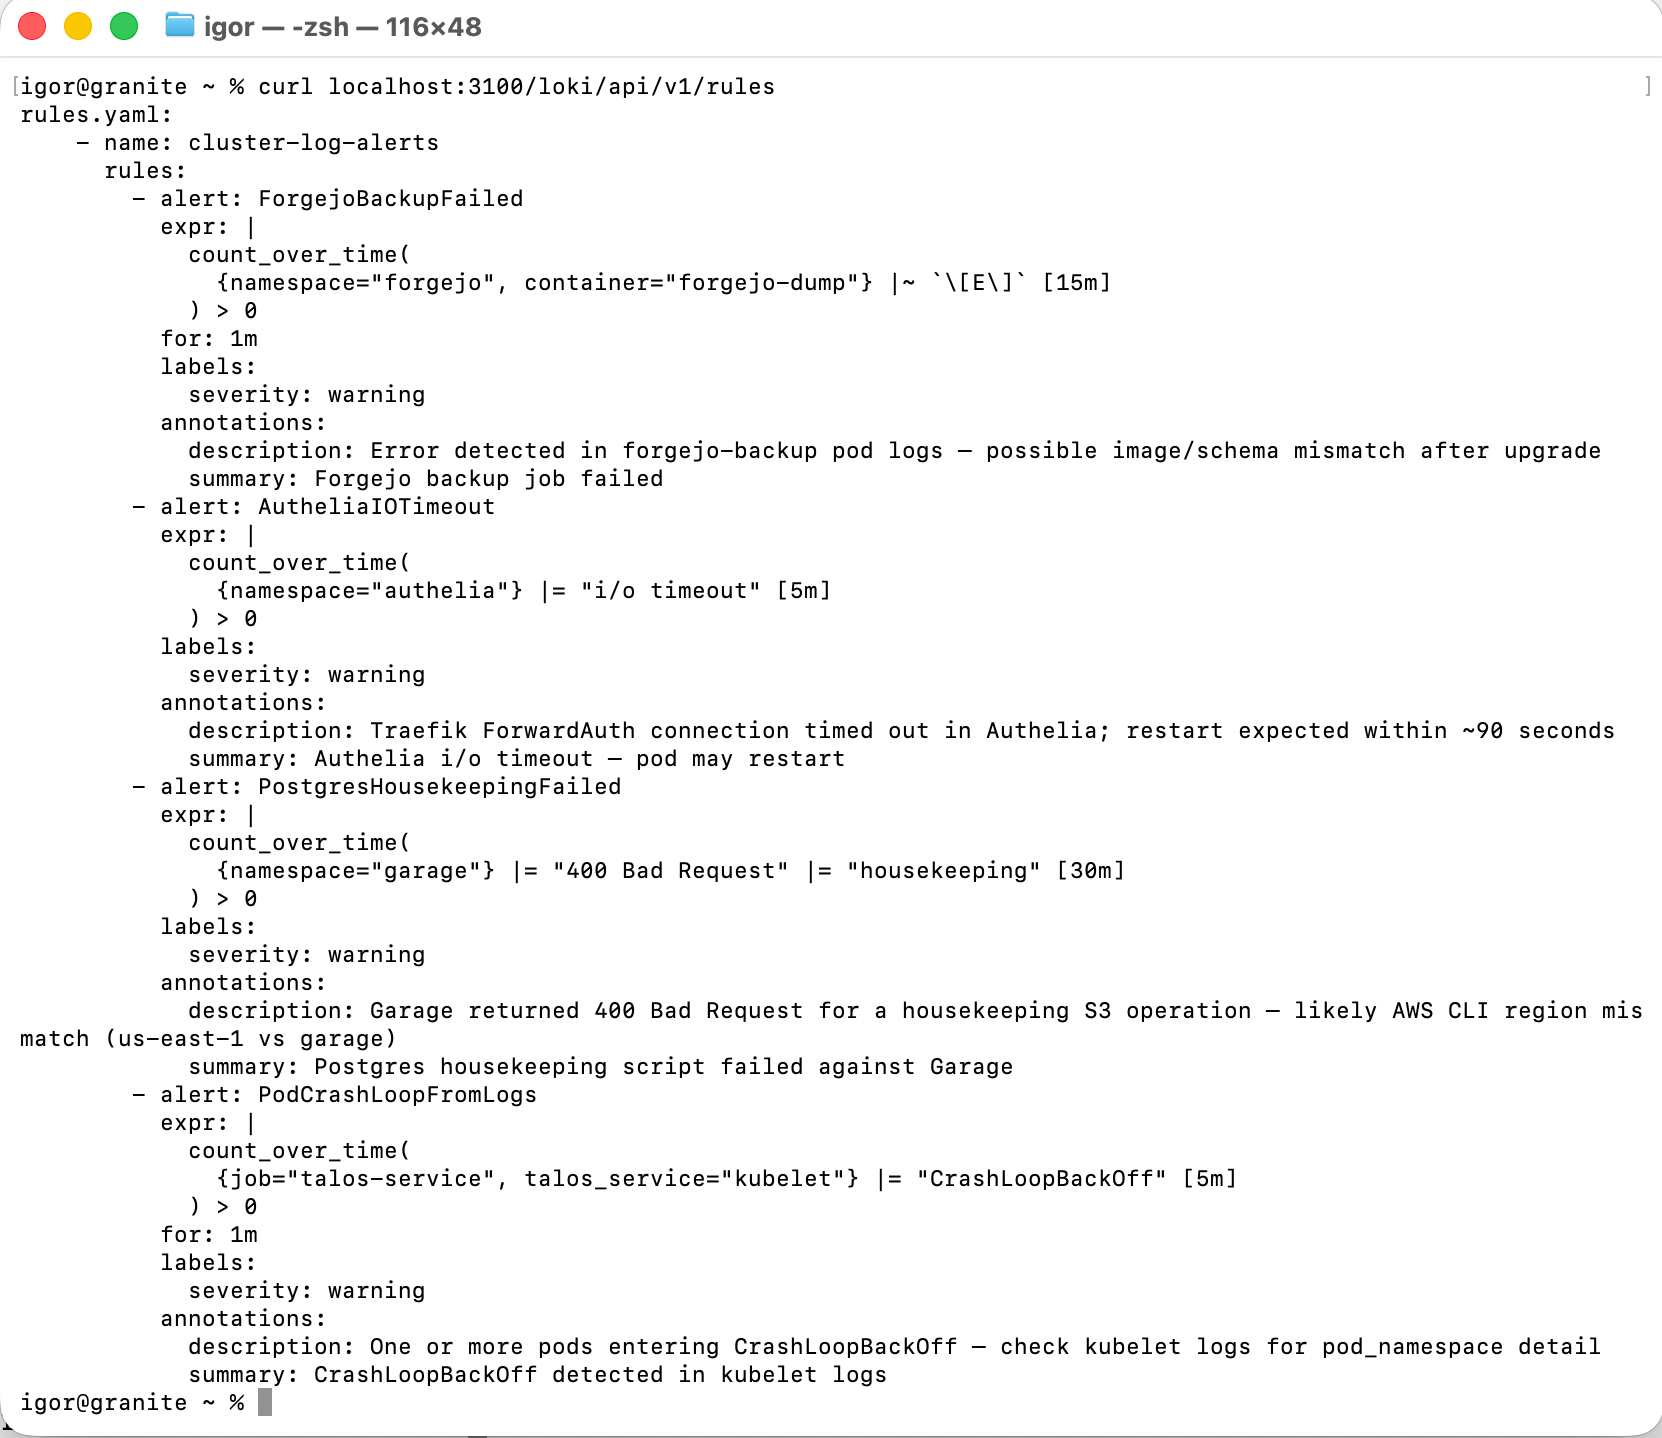
Confirming the rules are loaded via the ruler API:
kubectl port-forward -n monitoring svc/loki 3100:3100

curl localhost:3100/loki/api/v1/rules
# rules.yaml:
#     - name: cluster-log-alerts
#       rules:
#         - alert: ForgejoBackupFailed
#         ...
End-to-End Test
With the rules loaded, the obvious test candidate is AutheliaIOTimeout. The condition is reproducible: entering wrong credentials triggers the Traefik ForwardAuth → Authelia timeout sequence, which produces i/o timeout in the Authelia logs within a few minutes.
The first test failed. The ruler was evaluating rules every minute, but the Authelia query consistently returned total_bytes=0 — the ruler was scanning zero bytes for the query despite the logs being visible in Grafana.
The underlying issue turned out to be the Helm configuration: loki.ruler had been used instead of loki.rulerConfig, so the ruler configuration was not being applied correctly. The generated runtime config showed an empty alertmanager_url, confirming the block was being ignored entirely:
curl localhost:3100/config | grep -A10 ruler
# alertmanager_url: ""
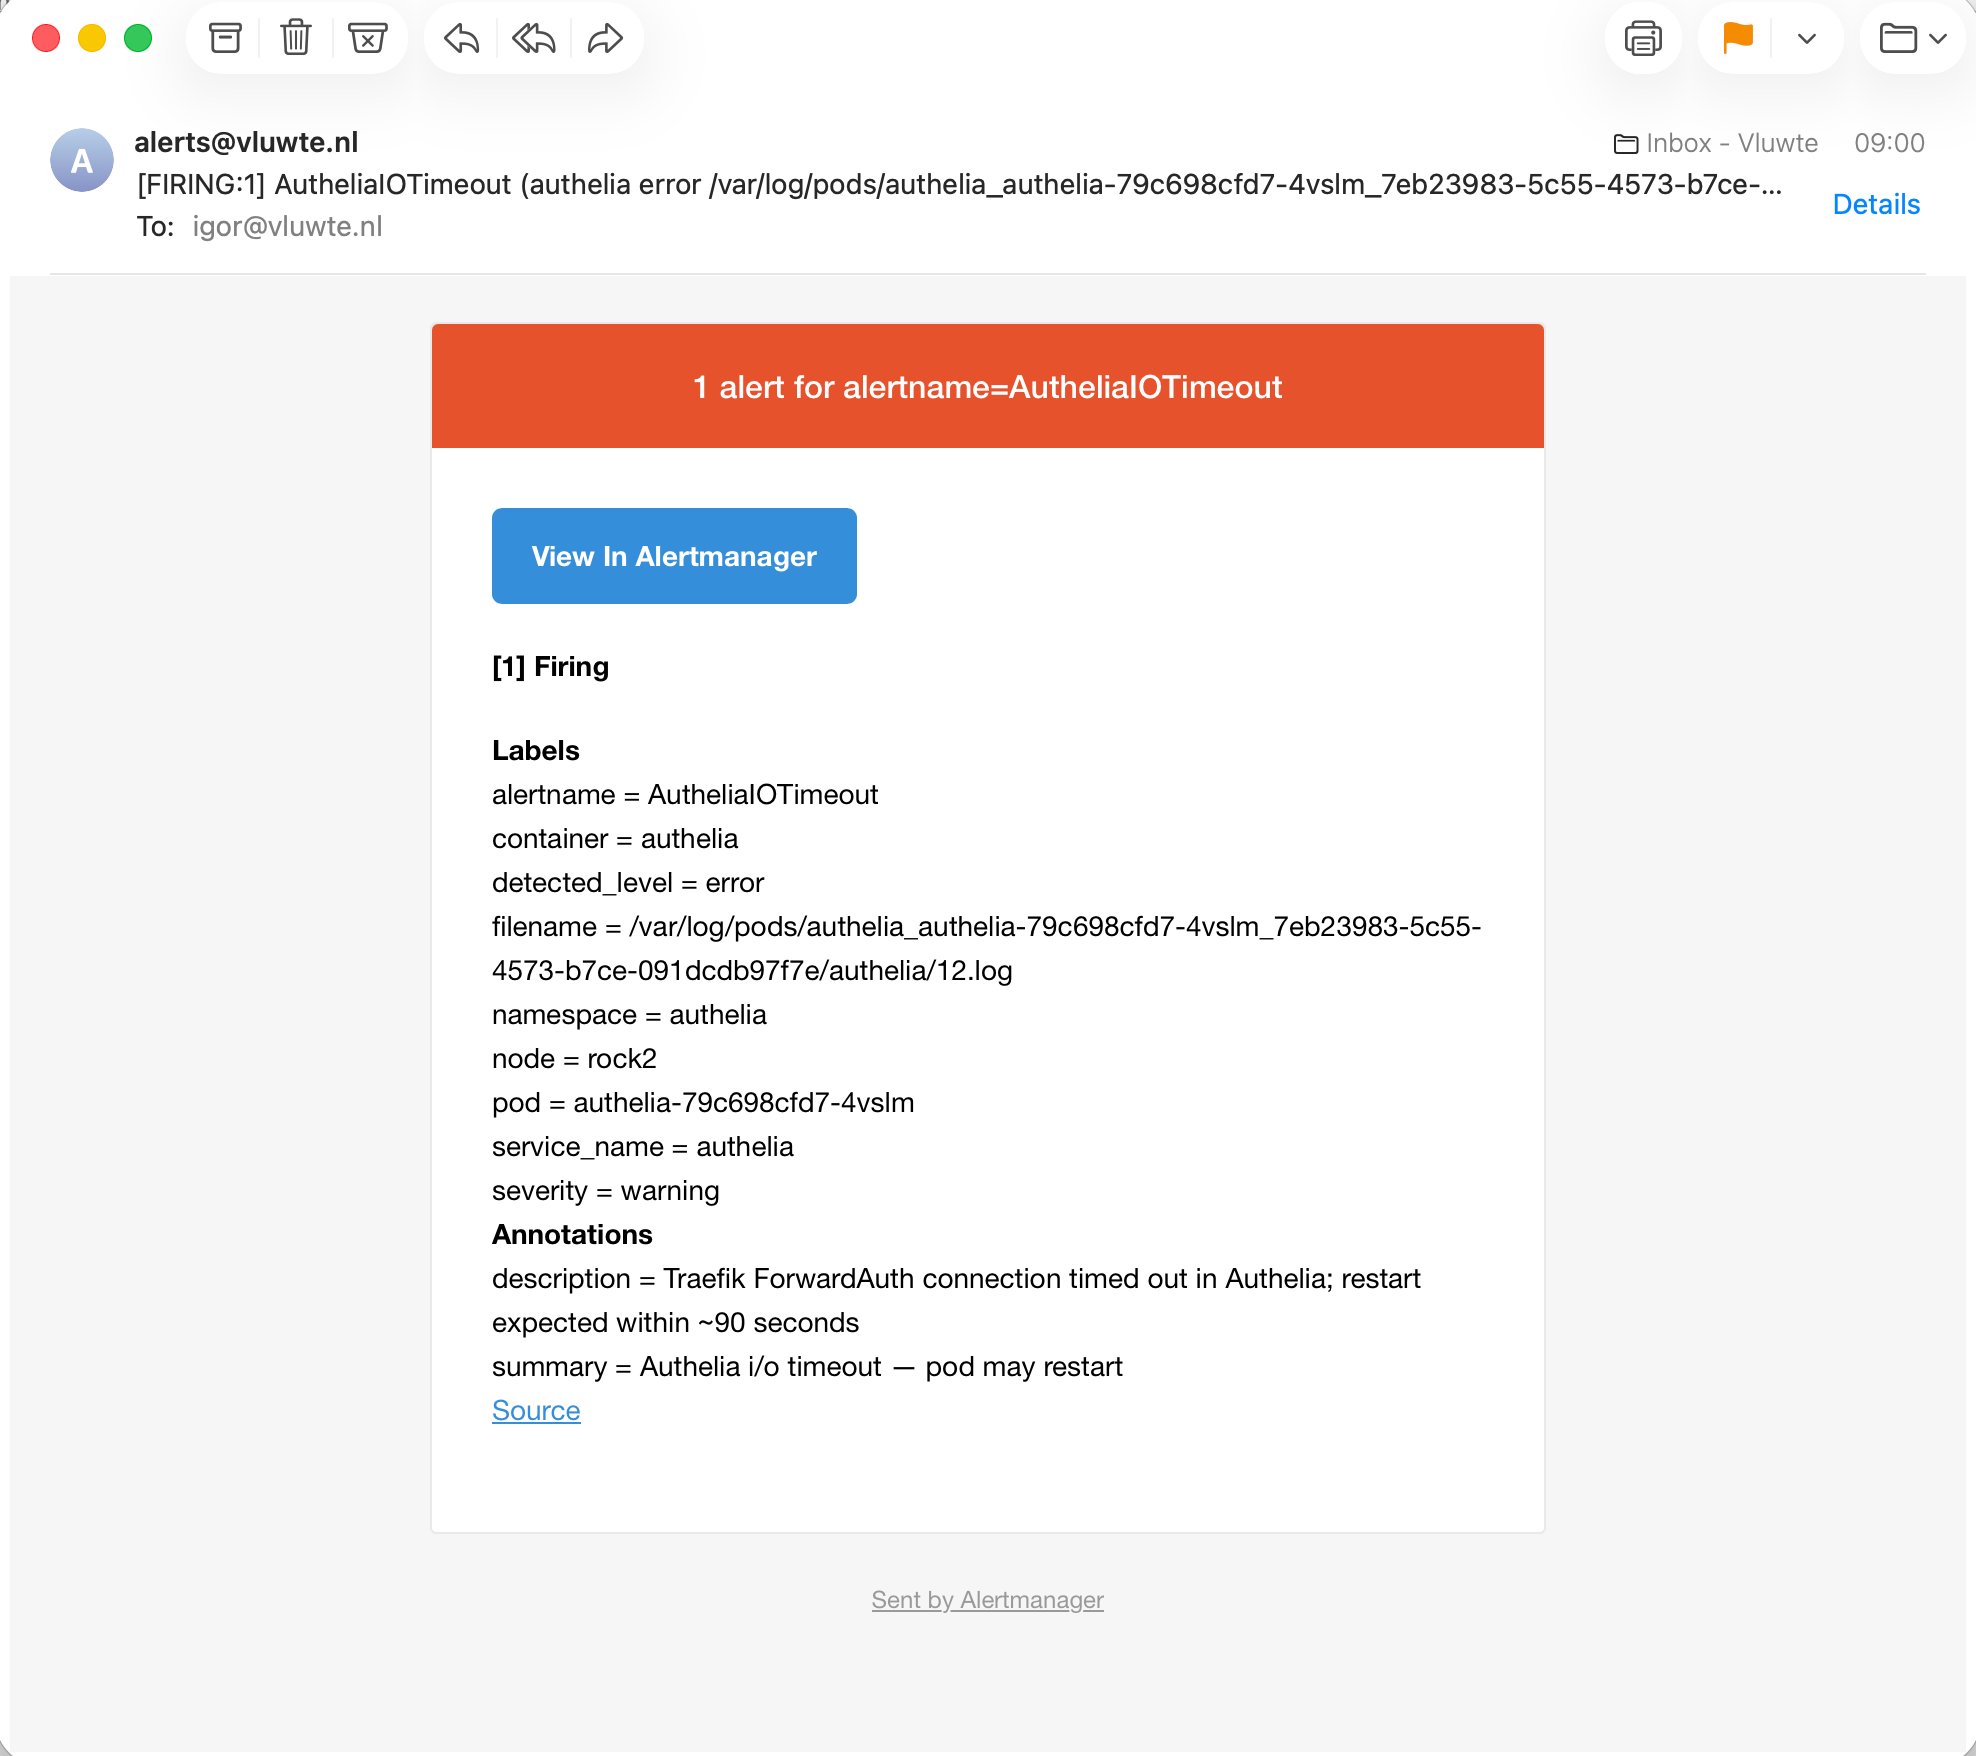
With ruler.enabled: true added and loki.ruler renamed to loki.rulerConfig — as shown in the values file above — the ruler started correctly on the next upgrade. The test fired immediately.
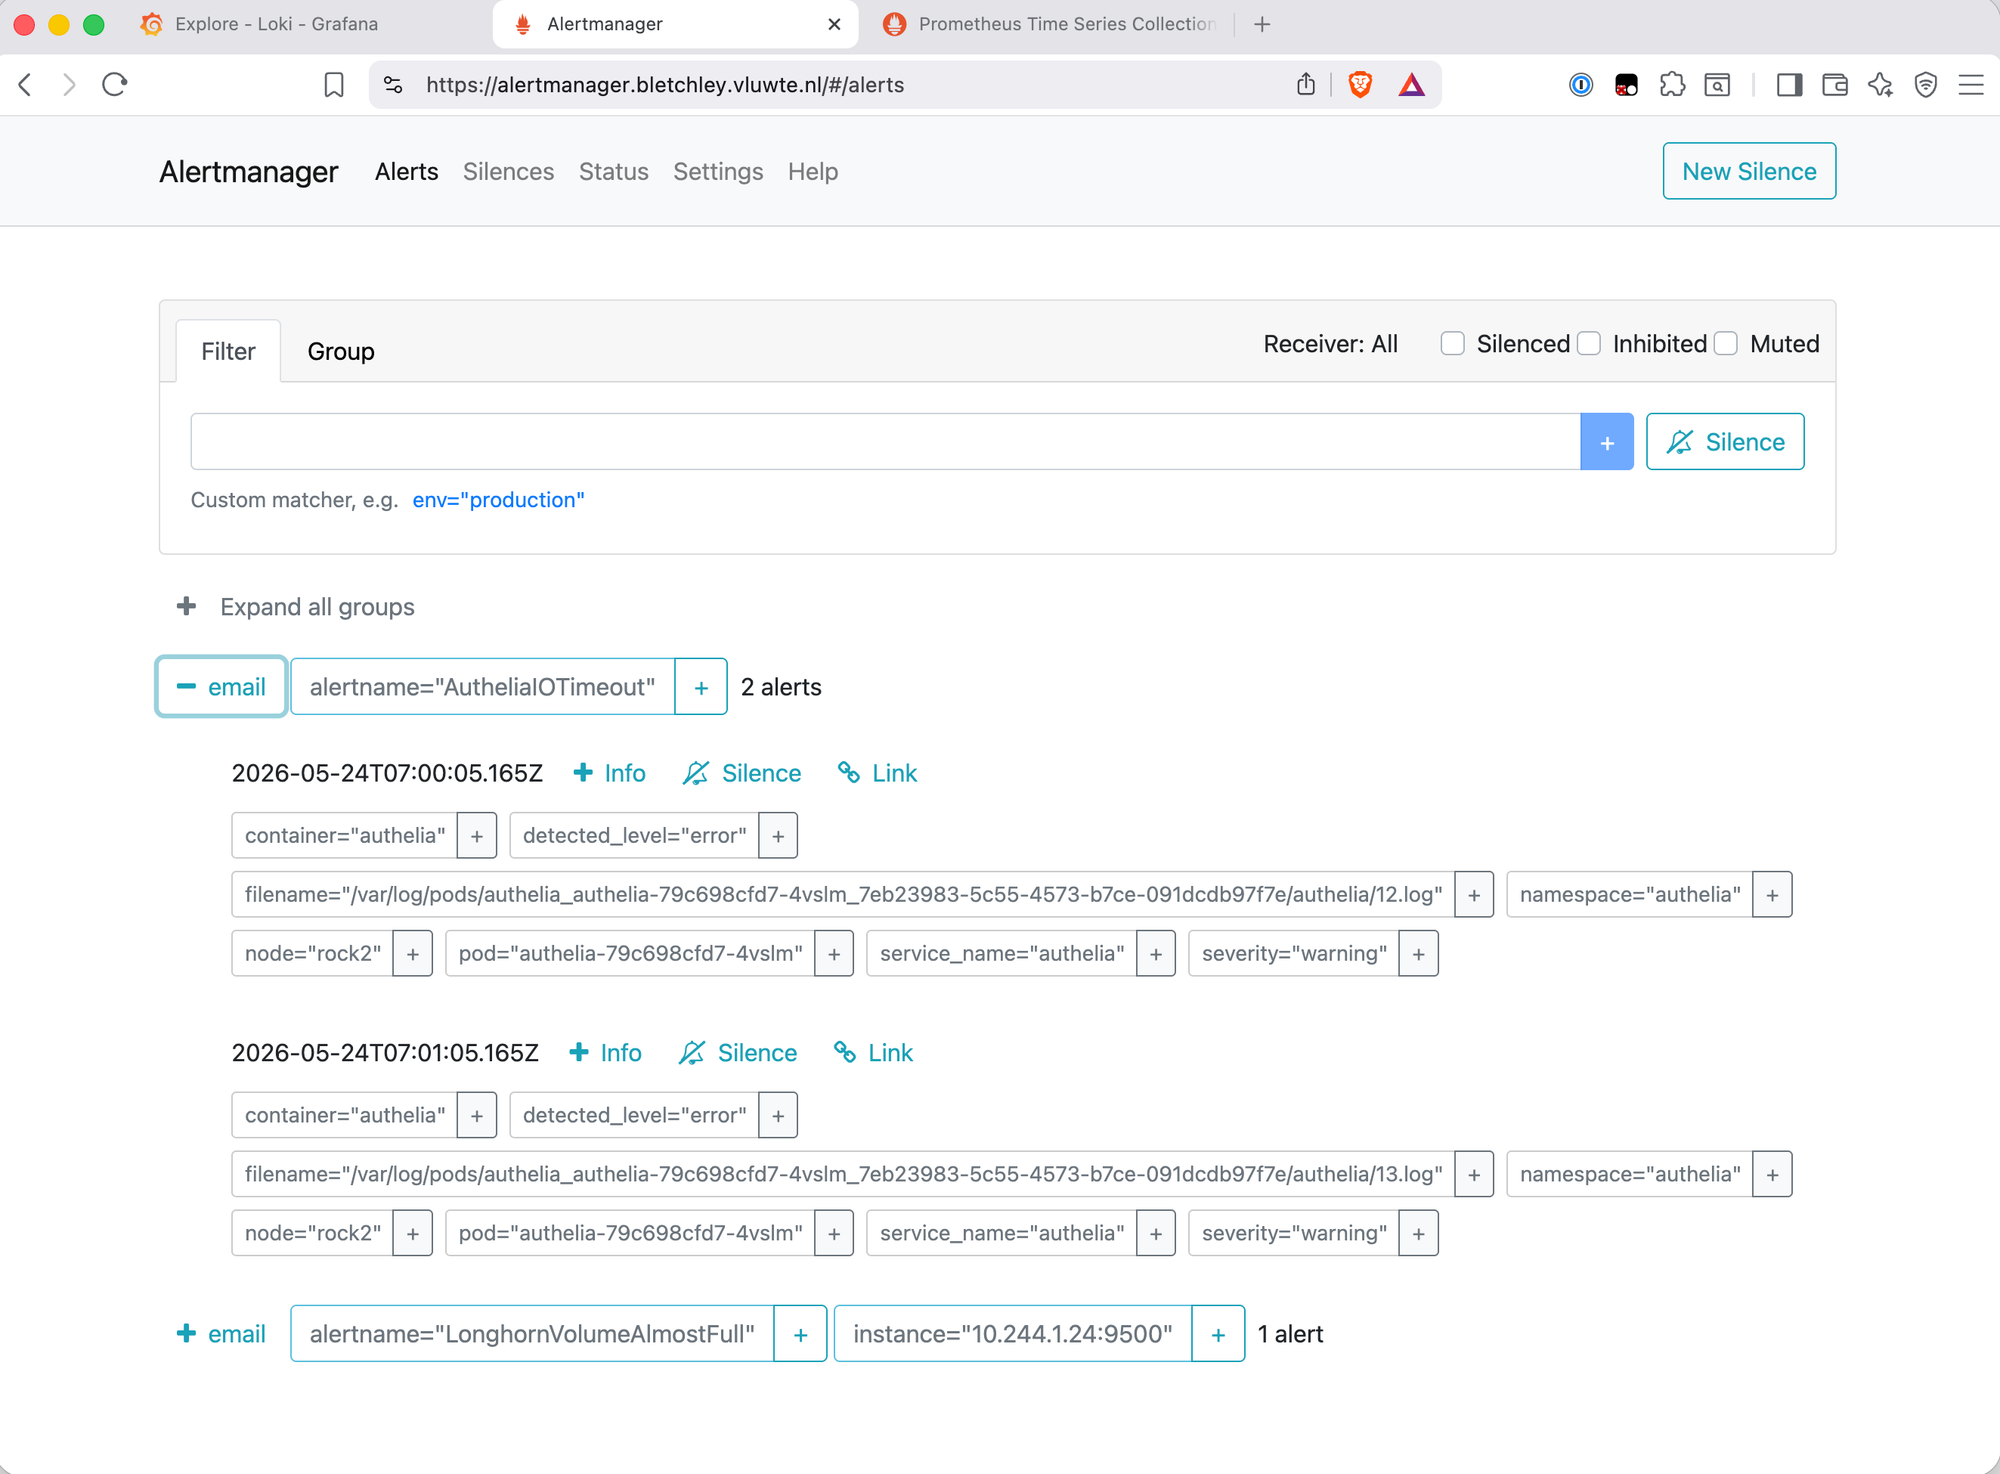
One thing worth understanding about the two alert instances: Alertmanager shows AutheliaIOTimeout firing twice. When Authelia restarts, Kubernetes begins writing to a new log file — the suffix increments from authelia/12.log to authelia/13.log. Alloy tails both files simultaneously as separate streams, each with a distinct filename label. The i/o timeout errors appear in both. Alertmanager groups them under the same alertname, which is the correct behaviour. This is expected and not a duplicate alert problem.
One more operational detail worth knowing: Loki alerts evaluate over time windows, so a single log event can keep an alert firing for the full duration of the query range, not just the evaluation interval. AutheliaIOTimeout uses a 5-minute window — if the i/o timeout appears once, the alert fires on every evaluation until that log line is older than 5 minutes. This is normal, but it catches people out who expect "one log line == one alert". The for: 1m on ForgejoBackupFailed and PodCrashLoopFromLogs helps here — it requires the condition to be true across multiple consecutive evaluations, which reduces alert flapping from short-lived matches or ingestion timing quirks.
The Complete Alerting Architecture
The cluster now has two alerting paths converging at the same Alertmanager:
Metrics → Prometheus → Alertmanager → email
Logs    → Loki ruler → Alertmanager → email
The split is deliberate. Prometheus alerts on what happened. Loki alerts on why it happened, or on conditions that metrics would never surface.
These rules use count_over_time(...) > 0 — fire if the pattern appears at all. That's intentional: on a four-node homelab with known failure modes, visibility matters more than precision. In a larger environment with higher log volume, the same approach would generate noise, and you'd want stricter thresholds, rate-based expressions, or structured JSON log fields with extracted labels rather than raw substring matching.
Prometheus alerts cover measurable state — filesystem usage, pod restarts, volume health, hardware metrics, backup freshness:
| Group | Alert | Condition |
|---|---|---|
| node | FilesystemAlmostFull / FilesystemCriticallyFull |
Filesystem > 80% / > 90% full |
| node | NodeDown |
node-exporter unreachable |
| node | PodRestartingTooOften |
> 5 restarts in 1 hour |
| node | NetworkSaturationRx / Tx |
Throughput > 800 Mbps |
| node | DeploymentReplicasUnavailable |
Unavailable replicas > 0 |
| longhorn | LonghornVolumeAlmostFull / CriticallyFull |
Volume > 80% / > 90% full |
| longhorn | LonghornVolumeDegraded / Faulted |
Volume robustness degraded or faulted |
| backup-controller | BackupPVCUnlabelled / Unnamed / Conflict / Orphaned |
Backup label violations |
| backup-controller | BackupUntracked / ArchiveReady / Expired |
Controller lifecycle events |
| hardware | ZFSPool* |
Pool degraded, faulted, suspended, unavailable, offline, or removed |
| hardware | DiskSMARTFailing / SATAReallocatedSectors / NVMeMediaErrors |
Drive health |
| hardware | NVMeWearHigh / SpareCapacityLow |
NVMe endurance |
| hardware | DiskTemperatureHigh / Critical / Alarm |
Drive temperature |
| hardware | NodeTemperatureHigh / Critical |
SoC thermal zones |
| hardware | NodeFanStopped |
Fan reading 0 RPM |
| hardware | GarageClusterUnhealthy / Unavailable / BlockResyncErrors / StorageNearFull |
Garage health |
| postgres | PostgresBackupMissing |
No backup in 25 hours |
| postgres | PostgresBackupSizeDeviation |
Dump > 20% smaller than previous day |
Loki alerts cover log content that metrics can't see:
| Alert | Condition | Origin |
|---|---|---|
ForgejoBackupFailed |
klog [E] error in the forgejo-dump container |
Part 10 — 3-week silent failure |
AutheliaIOTimeout |
i/o timeout in Authelia logs |
Part 10 — pre-restart signal |
PostgresHousekeepingFailed |
Garage returning 400 on housekeeping operations | Part 10 — region mismatch |
PodCrashLoopFromLogs |
CrashLoopBackOff in kubelet logs | Part 10 — cross-namespace visibility |
The Prometheus ruleset has been stable for a while and will be reviewed in a future post — there are likely improvements to the filesystem alerting approach and some rules worth re-evaluating for false positive risk.
What's Working Now
- ✅ Loki ruler running in monolithic mode alongside Prometheus
- ✅ Four log-based alert rules loaded and evaluating every minute
- ✅ End-to-end confirmed —
AutheliaIOTimeoutfired through to Alertmanager and delivered an email notification - ✅ Both alerting paths (Prometheus + Loki) converging at the same Alertmanager
- ⚠️ Known limitation:
AutheliaIOTimeoutfires twice per restart event due to Alloy tailing two log files simultaneously. Alertmanager groups them correctly; this is expected behaviour.
← Previous: Hunting for Errors with LogQL
Questions or suggestions? Leave a comment below or reach out at igor@vluwte.nl.