Cluster Observability Part 10: Hunting for Errors with LogQL
Six investigations across a Kubernetes cluster using LogQL: bootstrap artefacts, a silent 3-week backup failure, an Authelia crash sequence, and what high error volume actually means.
Introduction
Part 9 covered the prerequisite: understanding log formats across every namespace, establishing which filters are reliable, and fixing a gap in collection that meant kube-system static pod logs were missing entirely. With that foundation in place, this post is the actual hunt.
The approach is methodical rather than targeted. Start wide — a cluster-level error query across all namespaces — see what comes back, triage what's noise and what's signal, then zoom in on anything worth following. One incident was expected going in (an Authelia crash sequence). Five more surfaced from the queries. One finding led to a fix applied mid-investigation. Another revealed a silent failure that had been running unnoticed for three weeks. Two high-volume signals turned out to be noise — but understanding why required following them all the way through.
This is what a first systematic log review looks like in practice.
This post is part of the Cluster Observability sub-series.
- Part 7: Log Aggregation
- Part 8: Talos System Logs
- Part 9: Know Your Logs Before You Hunt Them
- Part 10: Hunting for Errors with LogQL
The Wide Net
The entry point is a metric query — not a log query. Rather than reading log lines directly, the first pass counts errors per namespace over a rolling 24-hour window and charts them over time. This gives an overview of the whole cluster without drowning in individual lines:
sum by (namespace) (
  count_over_time({namespace=~".+", namespace!="monitoring"} | detected_level="error" [1d])
)
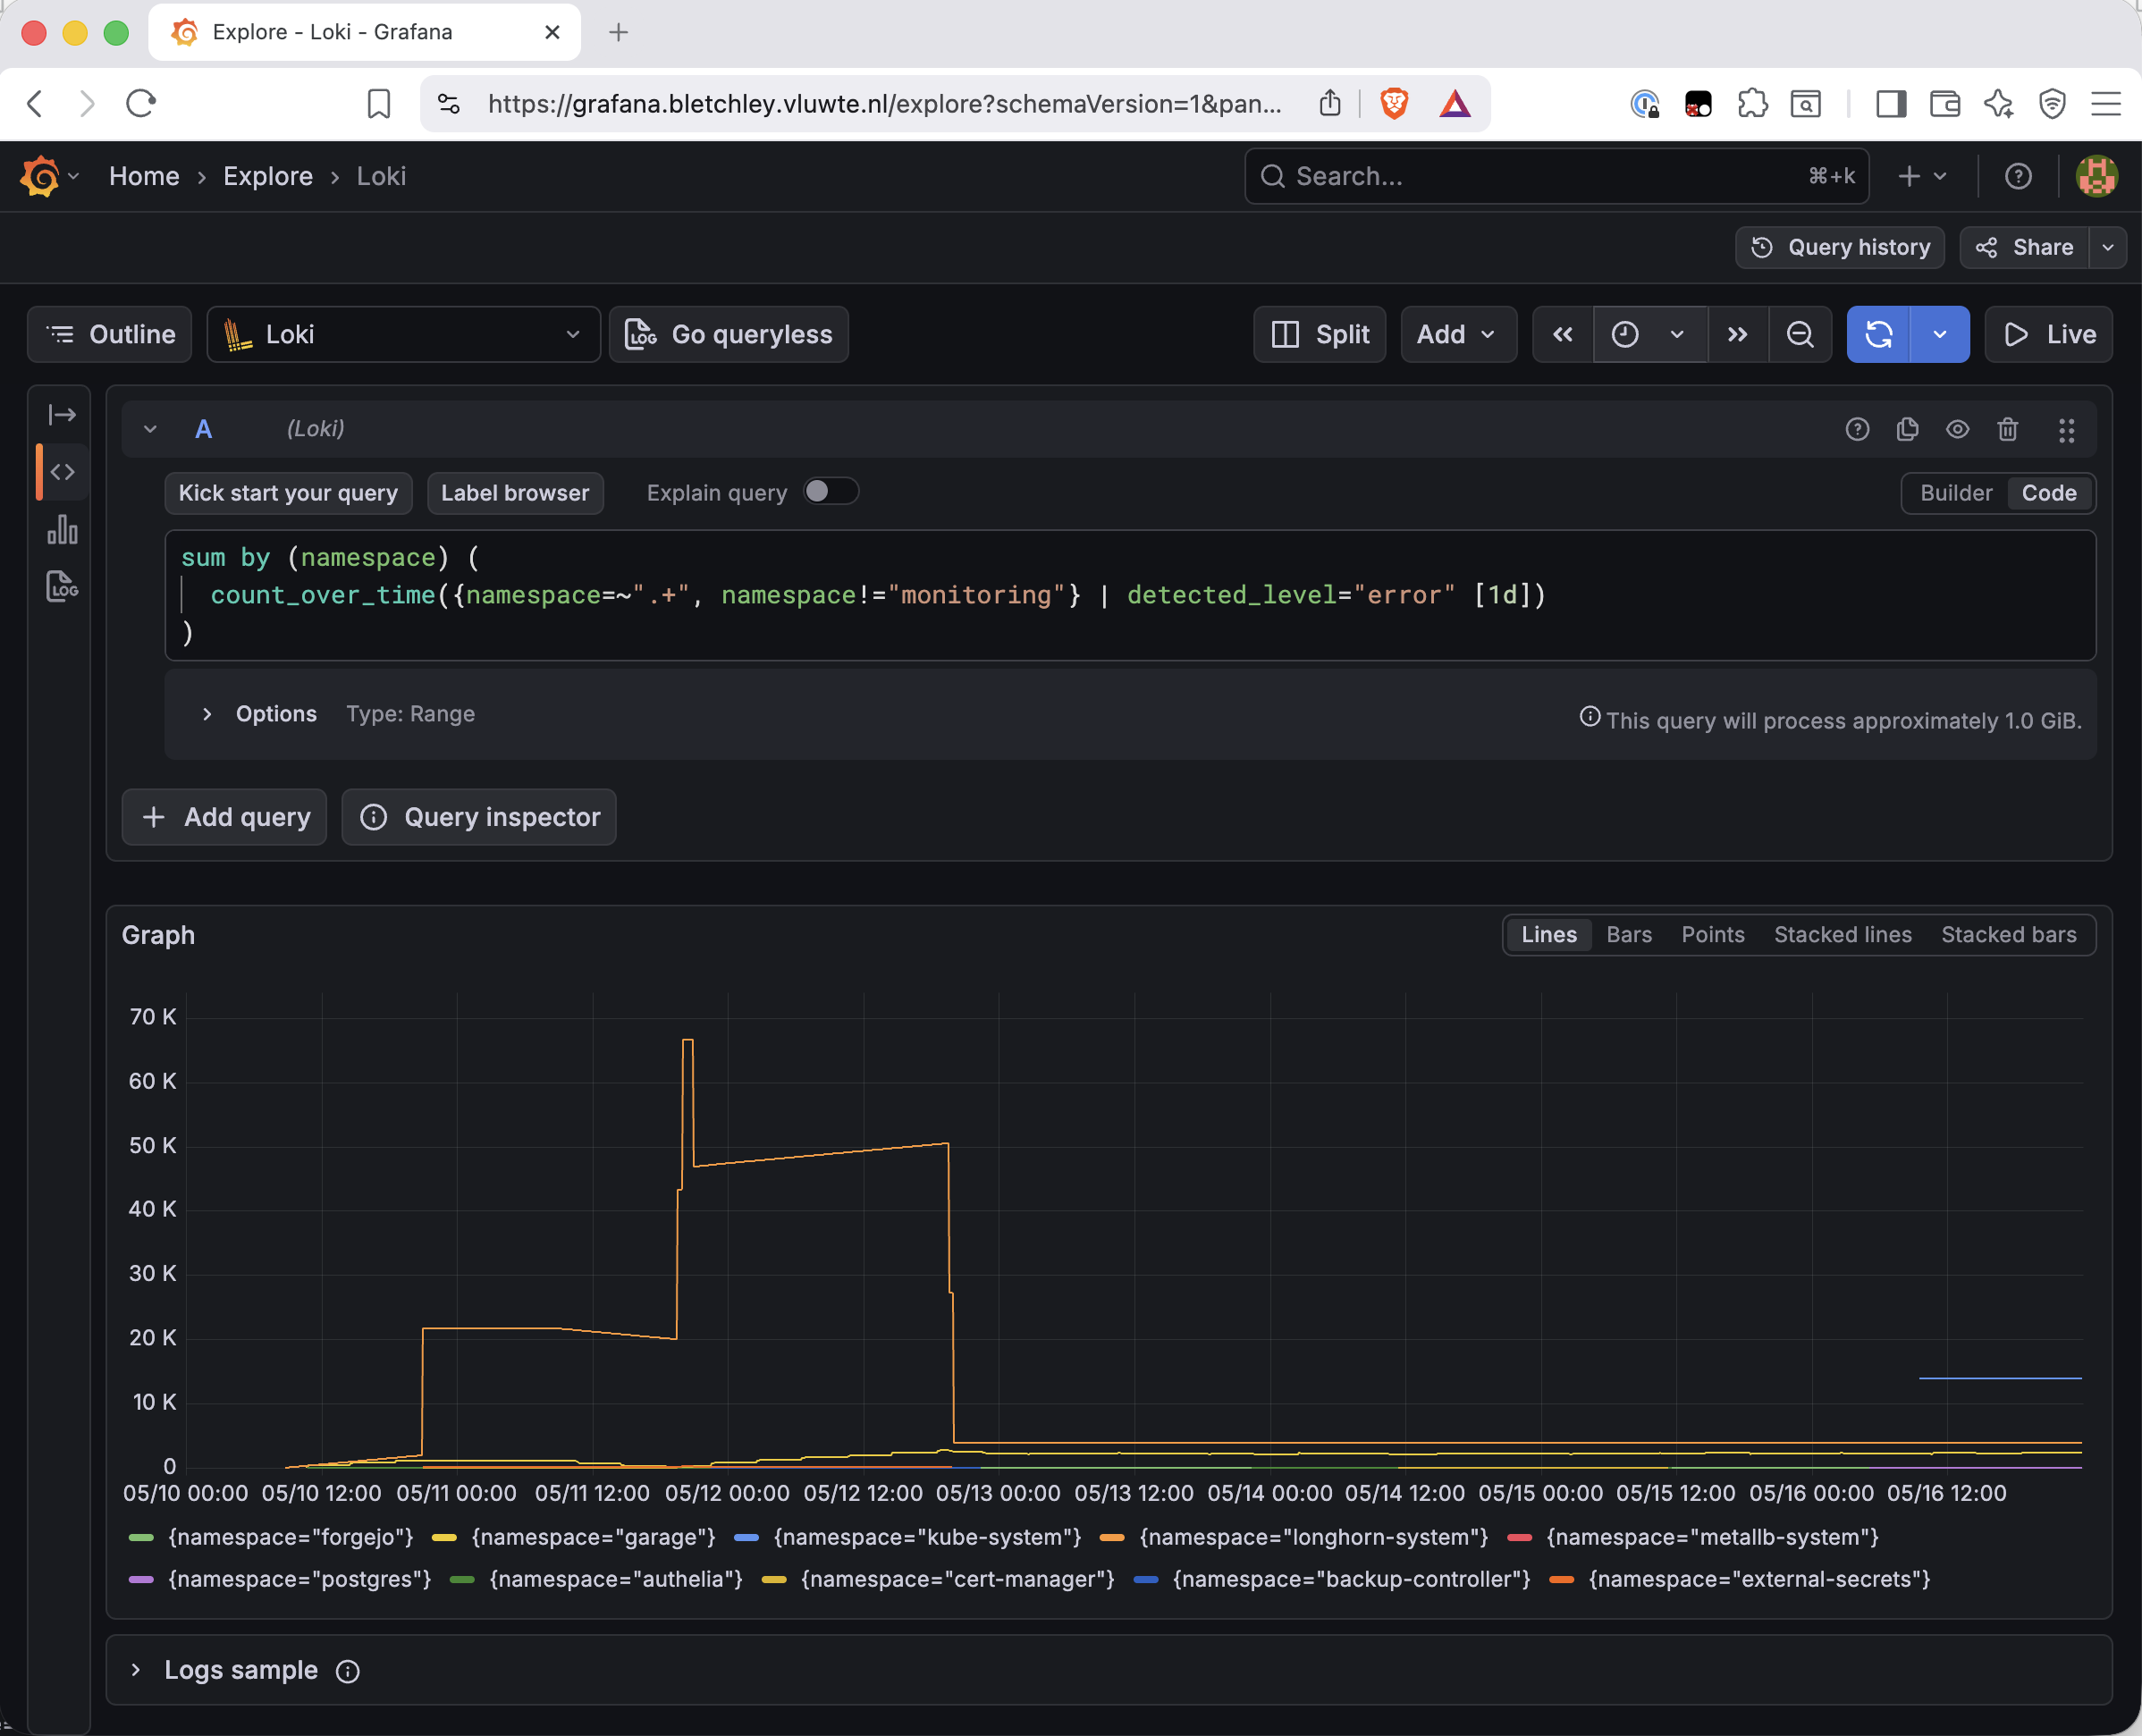
The first thing visible is a large spike around May 11–12 across several namespaces simultaneously — cert-manager, external-secrets, metallb, authelia, postgres. It looks like a cluster-wide incident. Investigating it reveals something different.
The Bootstrap Artefact
The May 11–12 spike is not a real event. Between May 11 and 13, Alloy underwent several config iterations as the collection pipeline was being tuned. Alloy normally persists log read positions across restarts using a write-ahead log, so a simple restart doesn't cause replays. However, structural changes to the pipeline configuration can invalidate or bypass previously tracked positions. Several of the bootstrap iterations did exactly that, causing historical log content to be replayed into Loki as if it were new. The Loki ingestion timestamps show May 11–12; the app timestamps embedded inside the log lines show weeks earlier.
The specific tell is in the external-secrets namespace: the first occurrence of its May 11 "spike" error is an ExternalSecret reconciliation failure with an app timestamp of 2026-04-29T17:54:51Z. The same message appears in the second "spike" on May 12. External-secrets wasn't misbehaving on May 11 — it was misbehaving back in late April, and the same log line was ingested twice.
The consequence: all data before May 13 00:00 is unreliable for this cluster's Loki instance. All investigations below use May 13 as the start of the window. Replayed ingestion also polluted log-derived metrics and any alerting based on them, which is why the pre-May 13 window had to be excluded entirely rather than merely interpreted carefully.
A second query zooms in on the namespaces that remain noisy after May 13, excluding the three highest-volume ones to see what's behind them:
sum by (namespace) (
  count_over_time({namespace=~".+", namespace!="monitoring", namespace!="kube-system",
    namespace!="longhorn-system", namespace!="garage"} | detected_level="error" [1d])
)
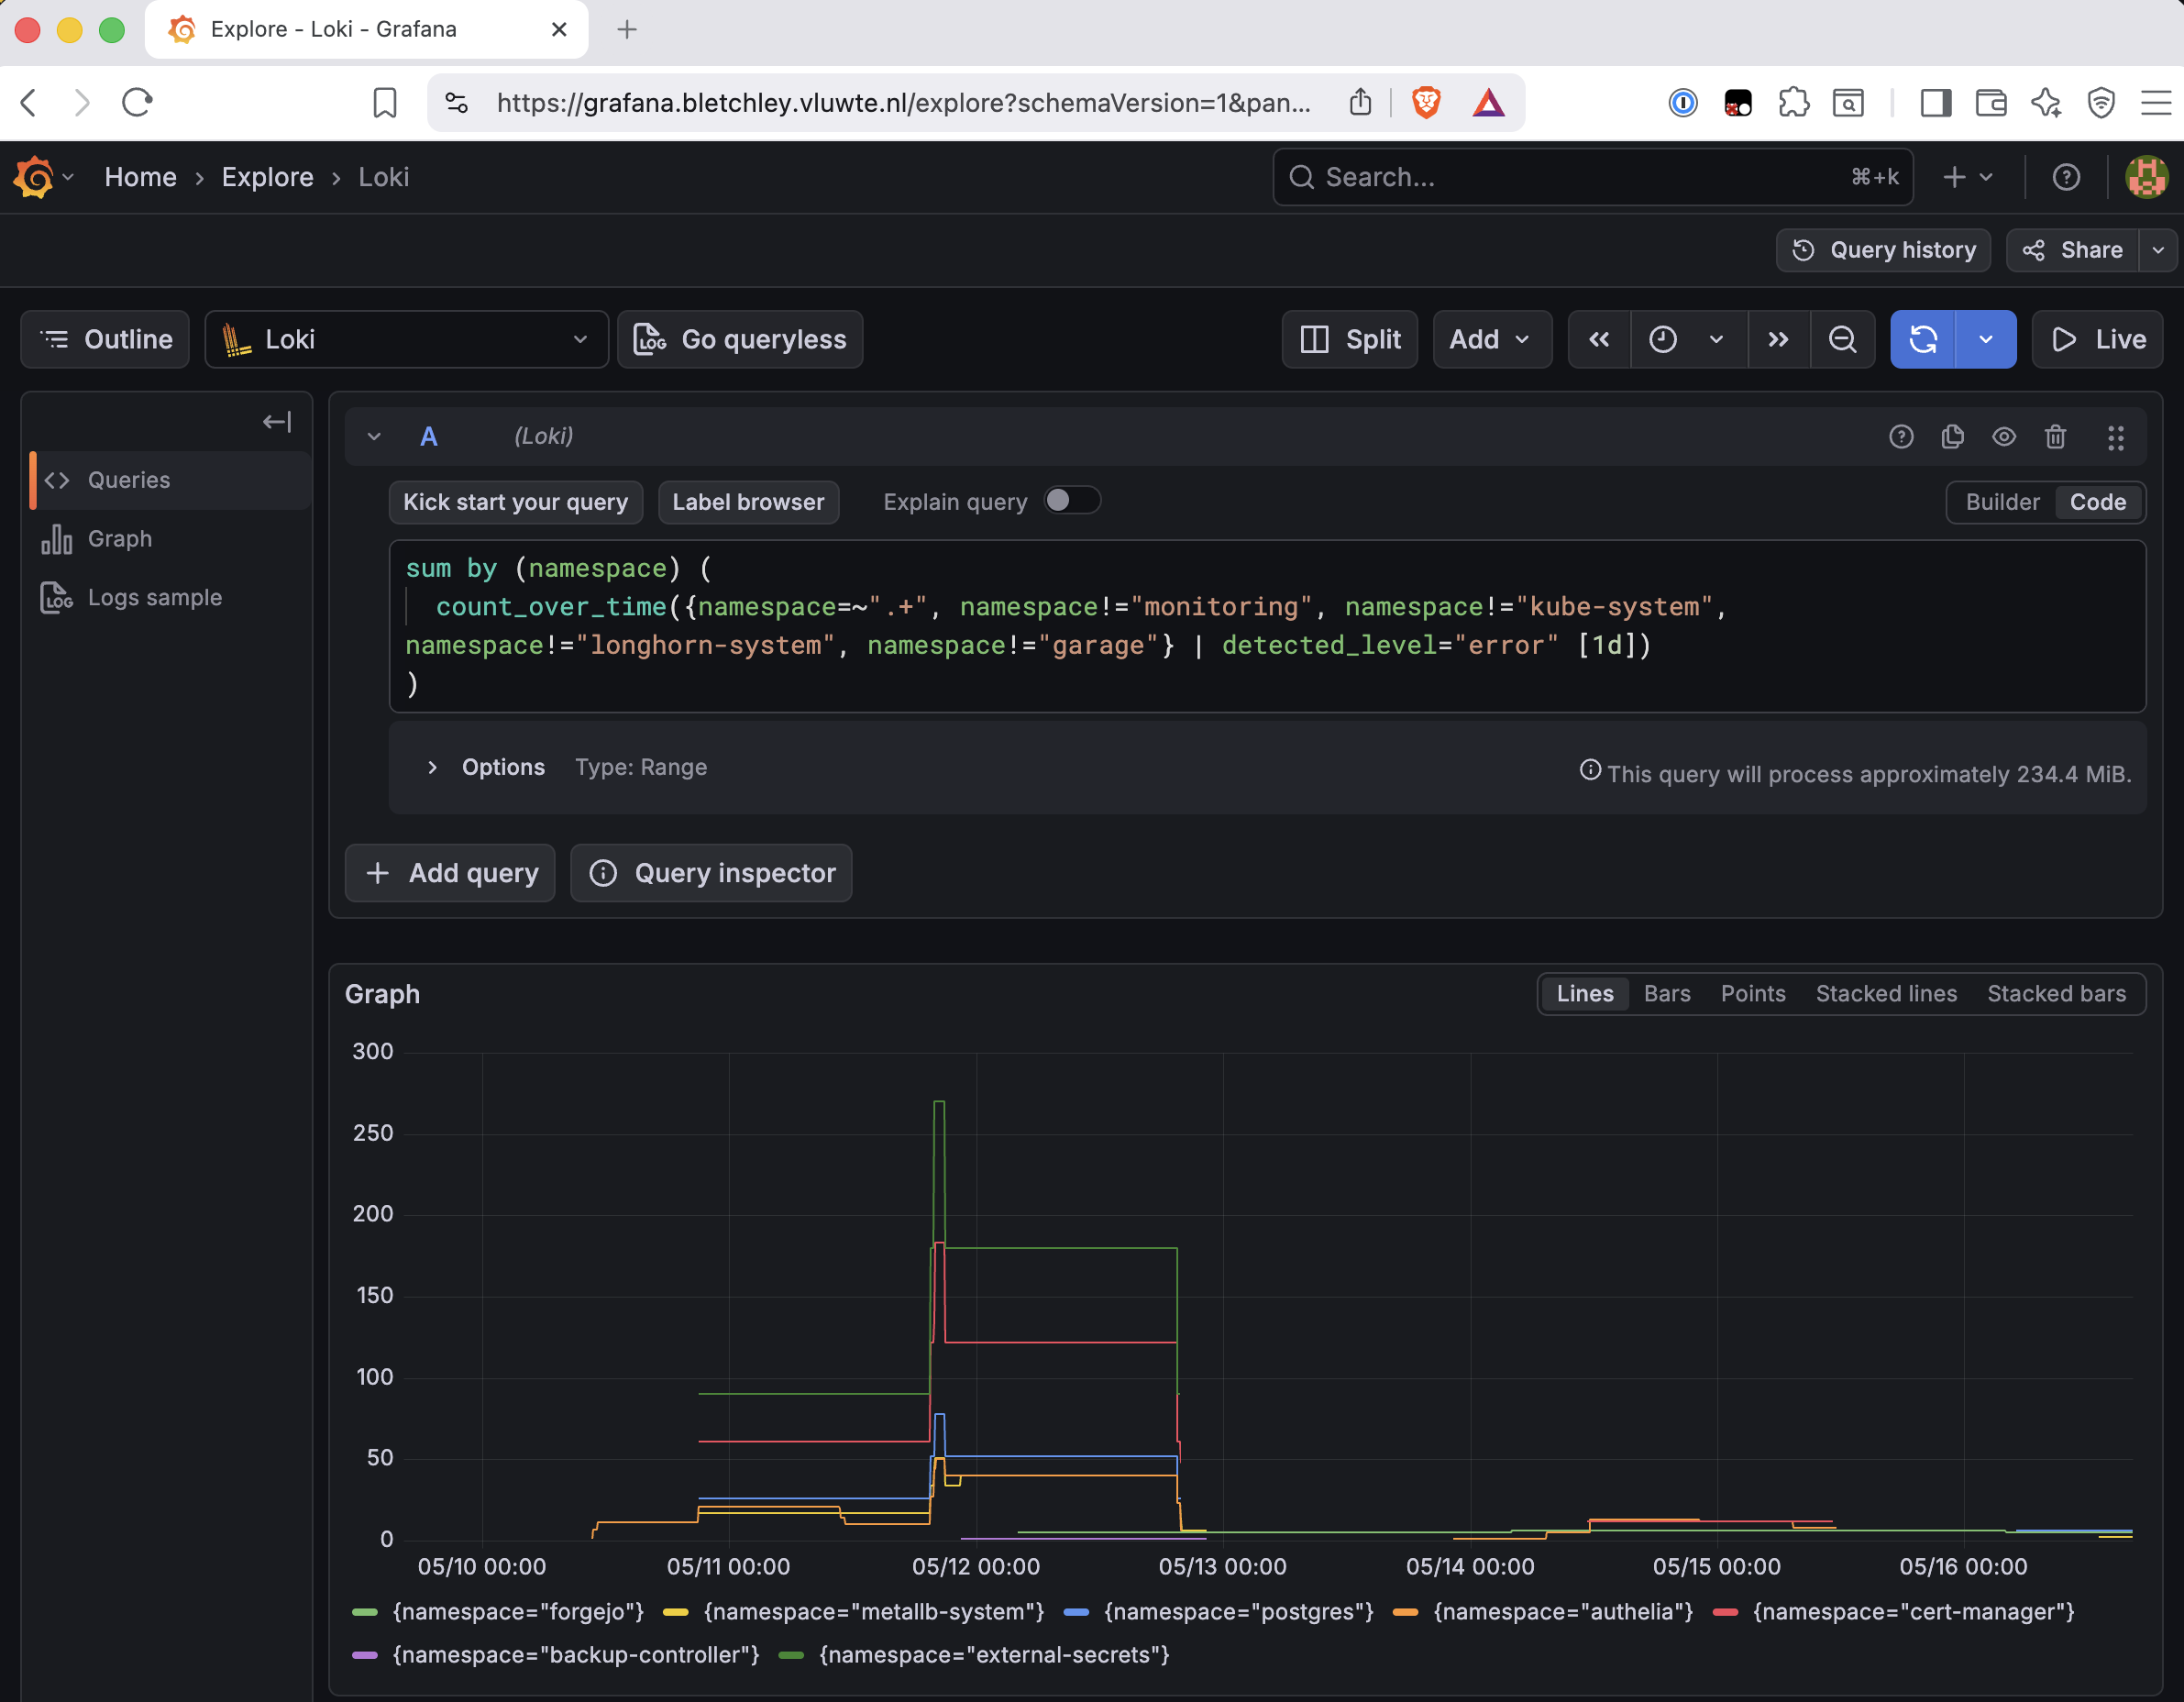
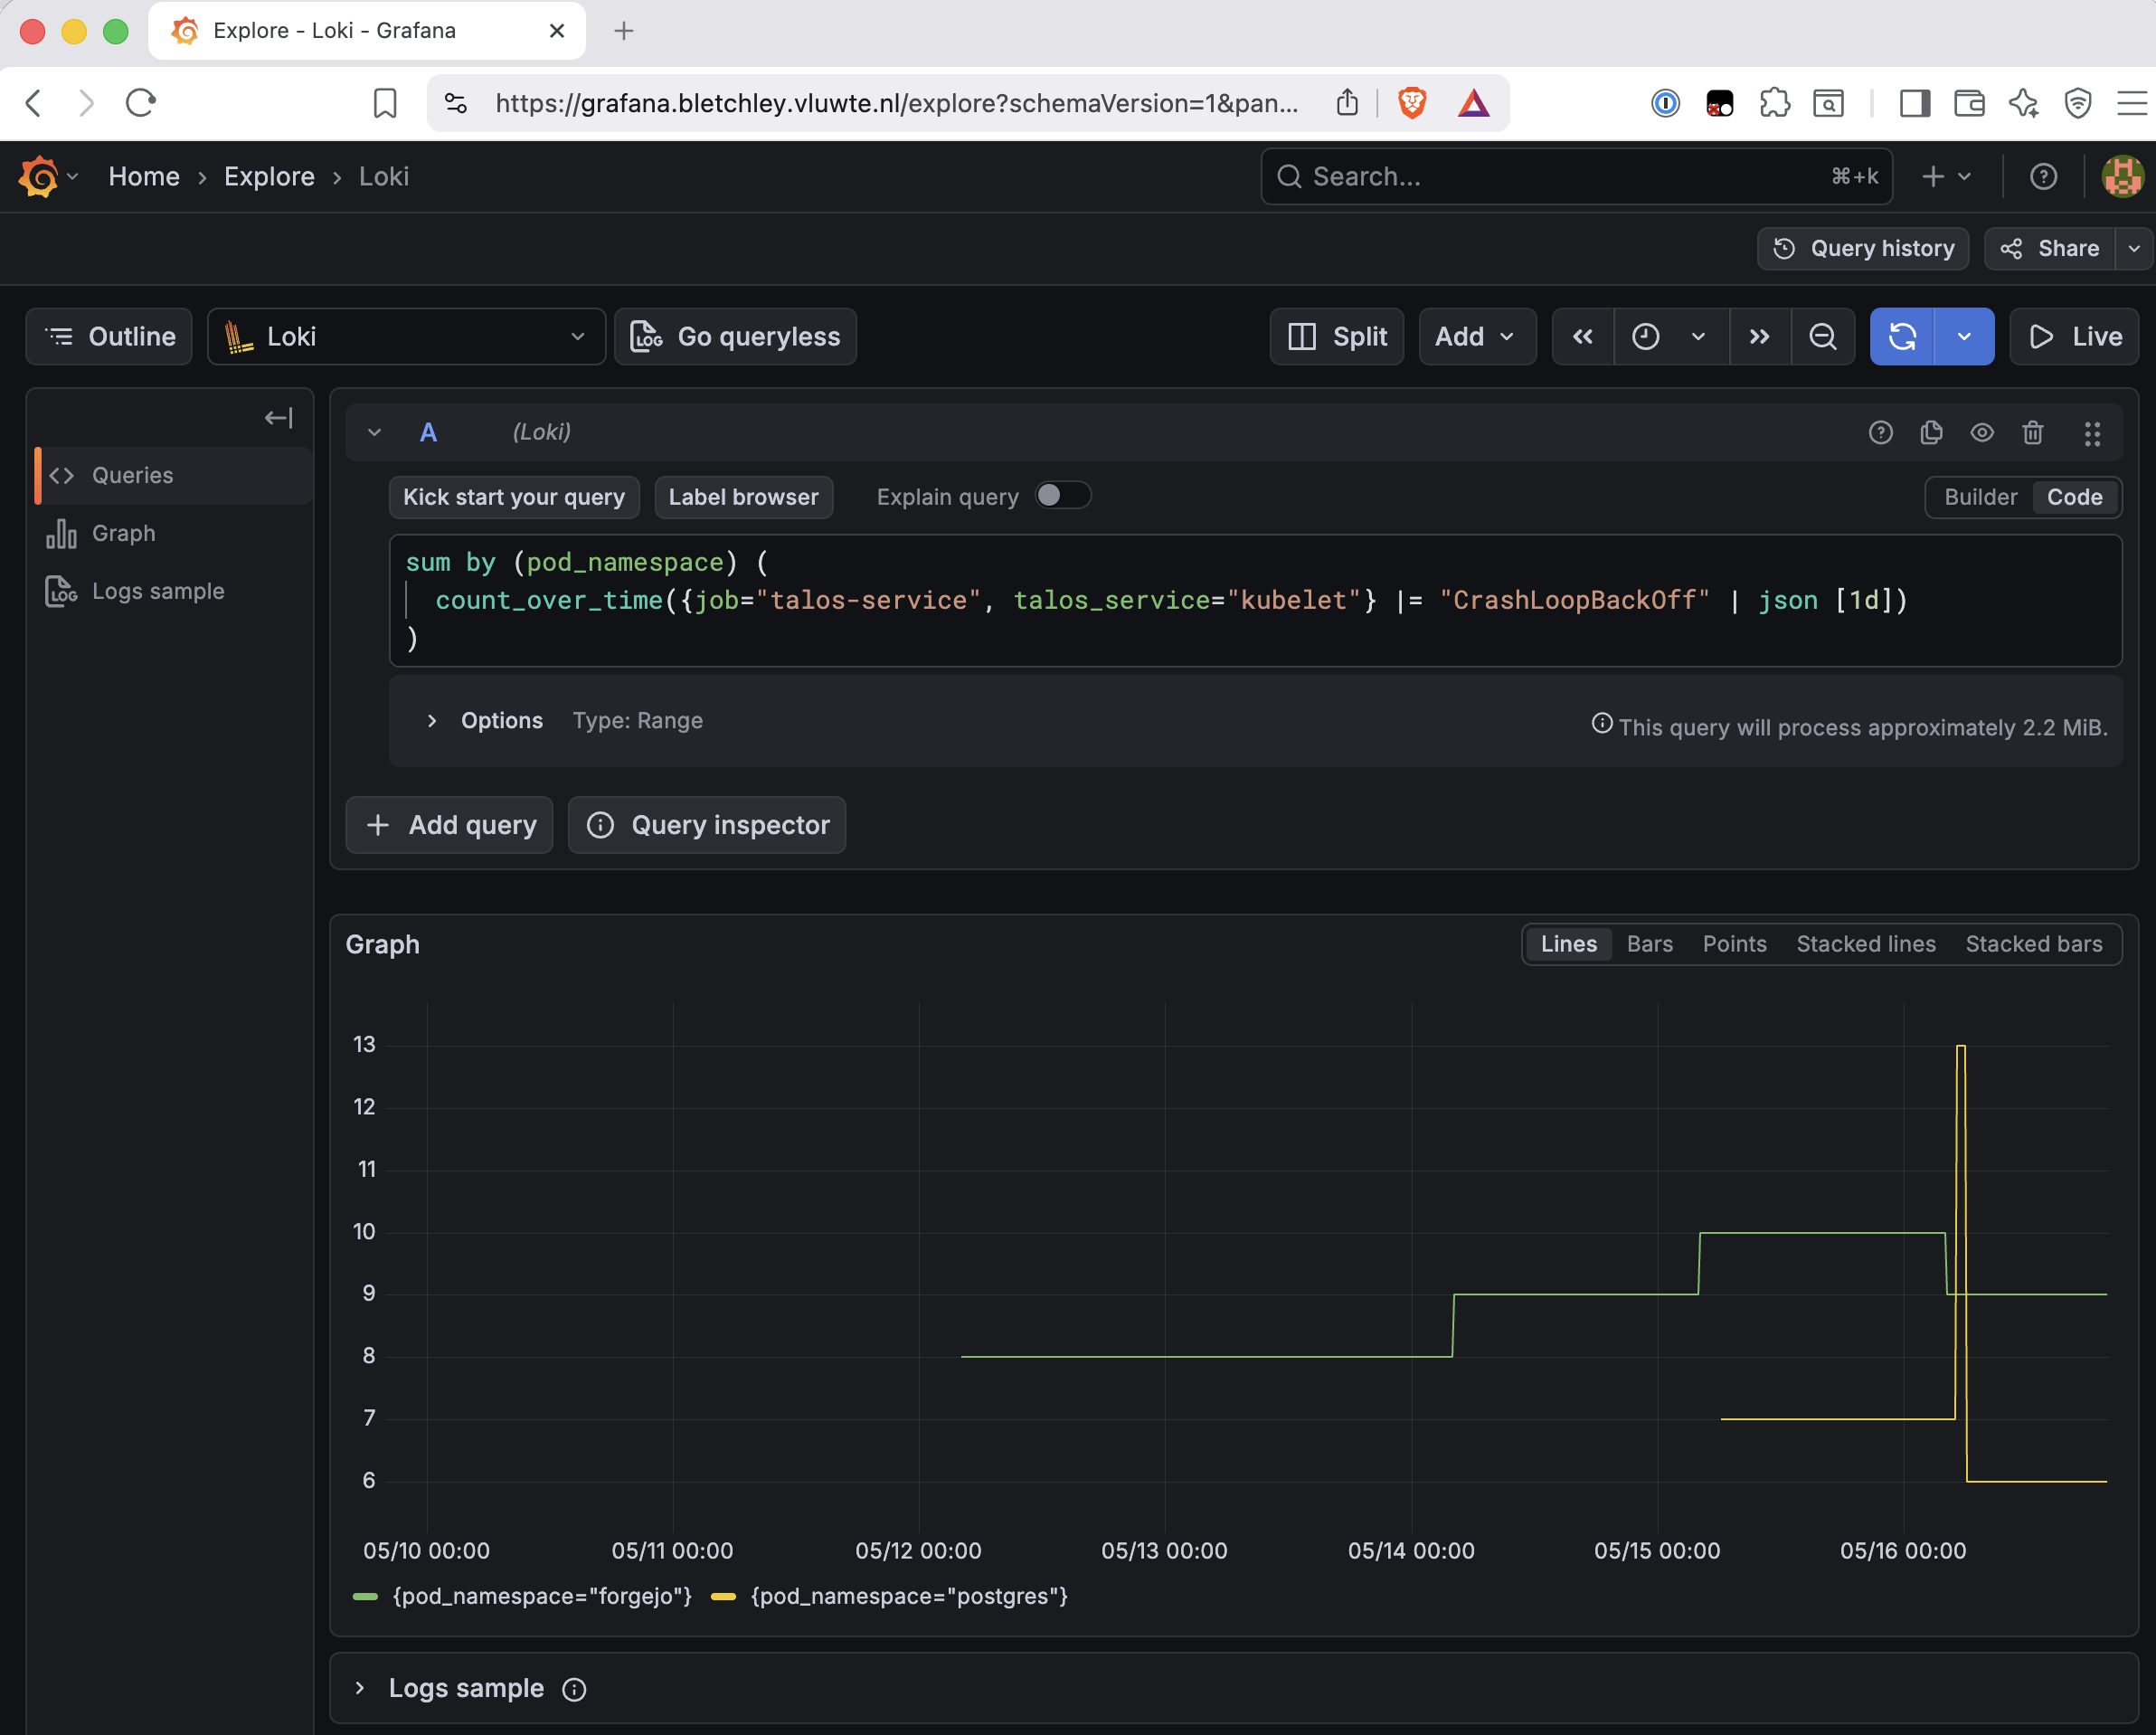
CrashLoopBackOff events are queried separately — they don't appear as errors in the namespace stream because CrashLoopBackOff is a kubelet/container restart condition surfaced through pod status rather than an application log line. The signal is in the kubelet stream:
sum by (pod_namespace) (
  count_over_time({job="talos-service", talos_service="kubelet"} |= "CrashLoopBackOff" | json [1d])
)
Triage
Before diving into individual investigations, the full picture from the wide-net queries:
| Namespace | Classification | Reason |
|---|---|---|
kube-system |
noise (mostly) | Pre-May 16 spike is retroactive backlog from static pod fix; post-May 16 errors are real — covered below |
longhorn-system |
signal | Consistent high volume from May 13 — investigate |
garage |
signal | detected_level unreliable; needs dedicated substring pass |
forgejo |
signal | CrashLoop confirmed from May 13, 8-9/day, not resolving |
cert-manager |
noise | All errors are pre-May 13 backlog; zero since |
authelia |
signal | Check May 13 onwards for i/o timeout sequence |
metallb-system |
noise | All errors pre-May 13 backlog; zero since |
postgres |
signal | CrashLoop from May 15, active Alertmanager alert |
external-secrets |
noise | All pre-May 13 backlog; zero since |
backup-controller |
noise | Single May 12 error is backlog |
talos-service |
signal | Low daily baseline; spike on May 12 is backlog; investigate May 13 onwards |
Five namespaces signal; six are noise. The noise is all explained by the bootstrap artefact. The signal namespaces get individual investigations below.
Investigation 1 — Postgres Housekeeping: Root Cause Across Two Namespaces
How It Started
An Alertmanager email arrived at 06:11 CEST on May 15:
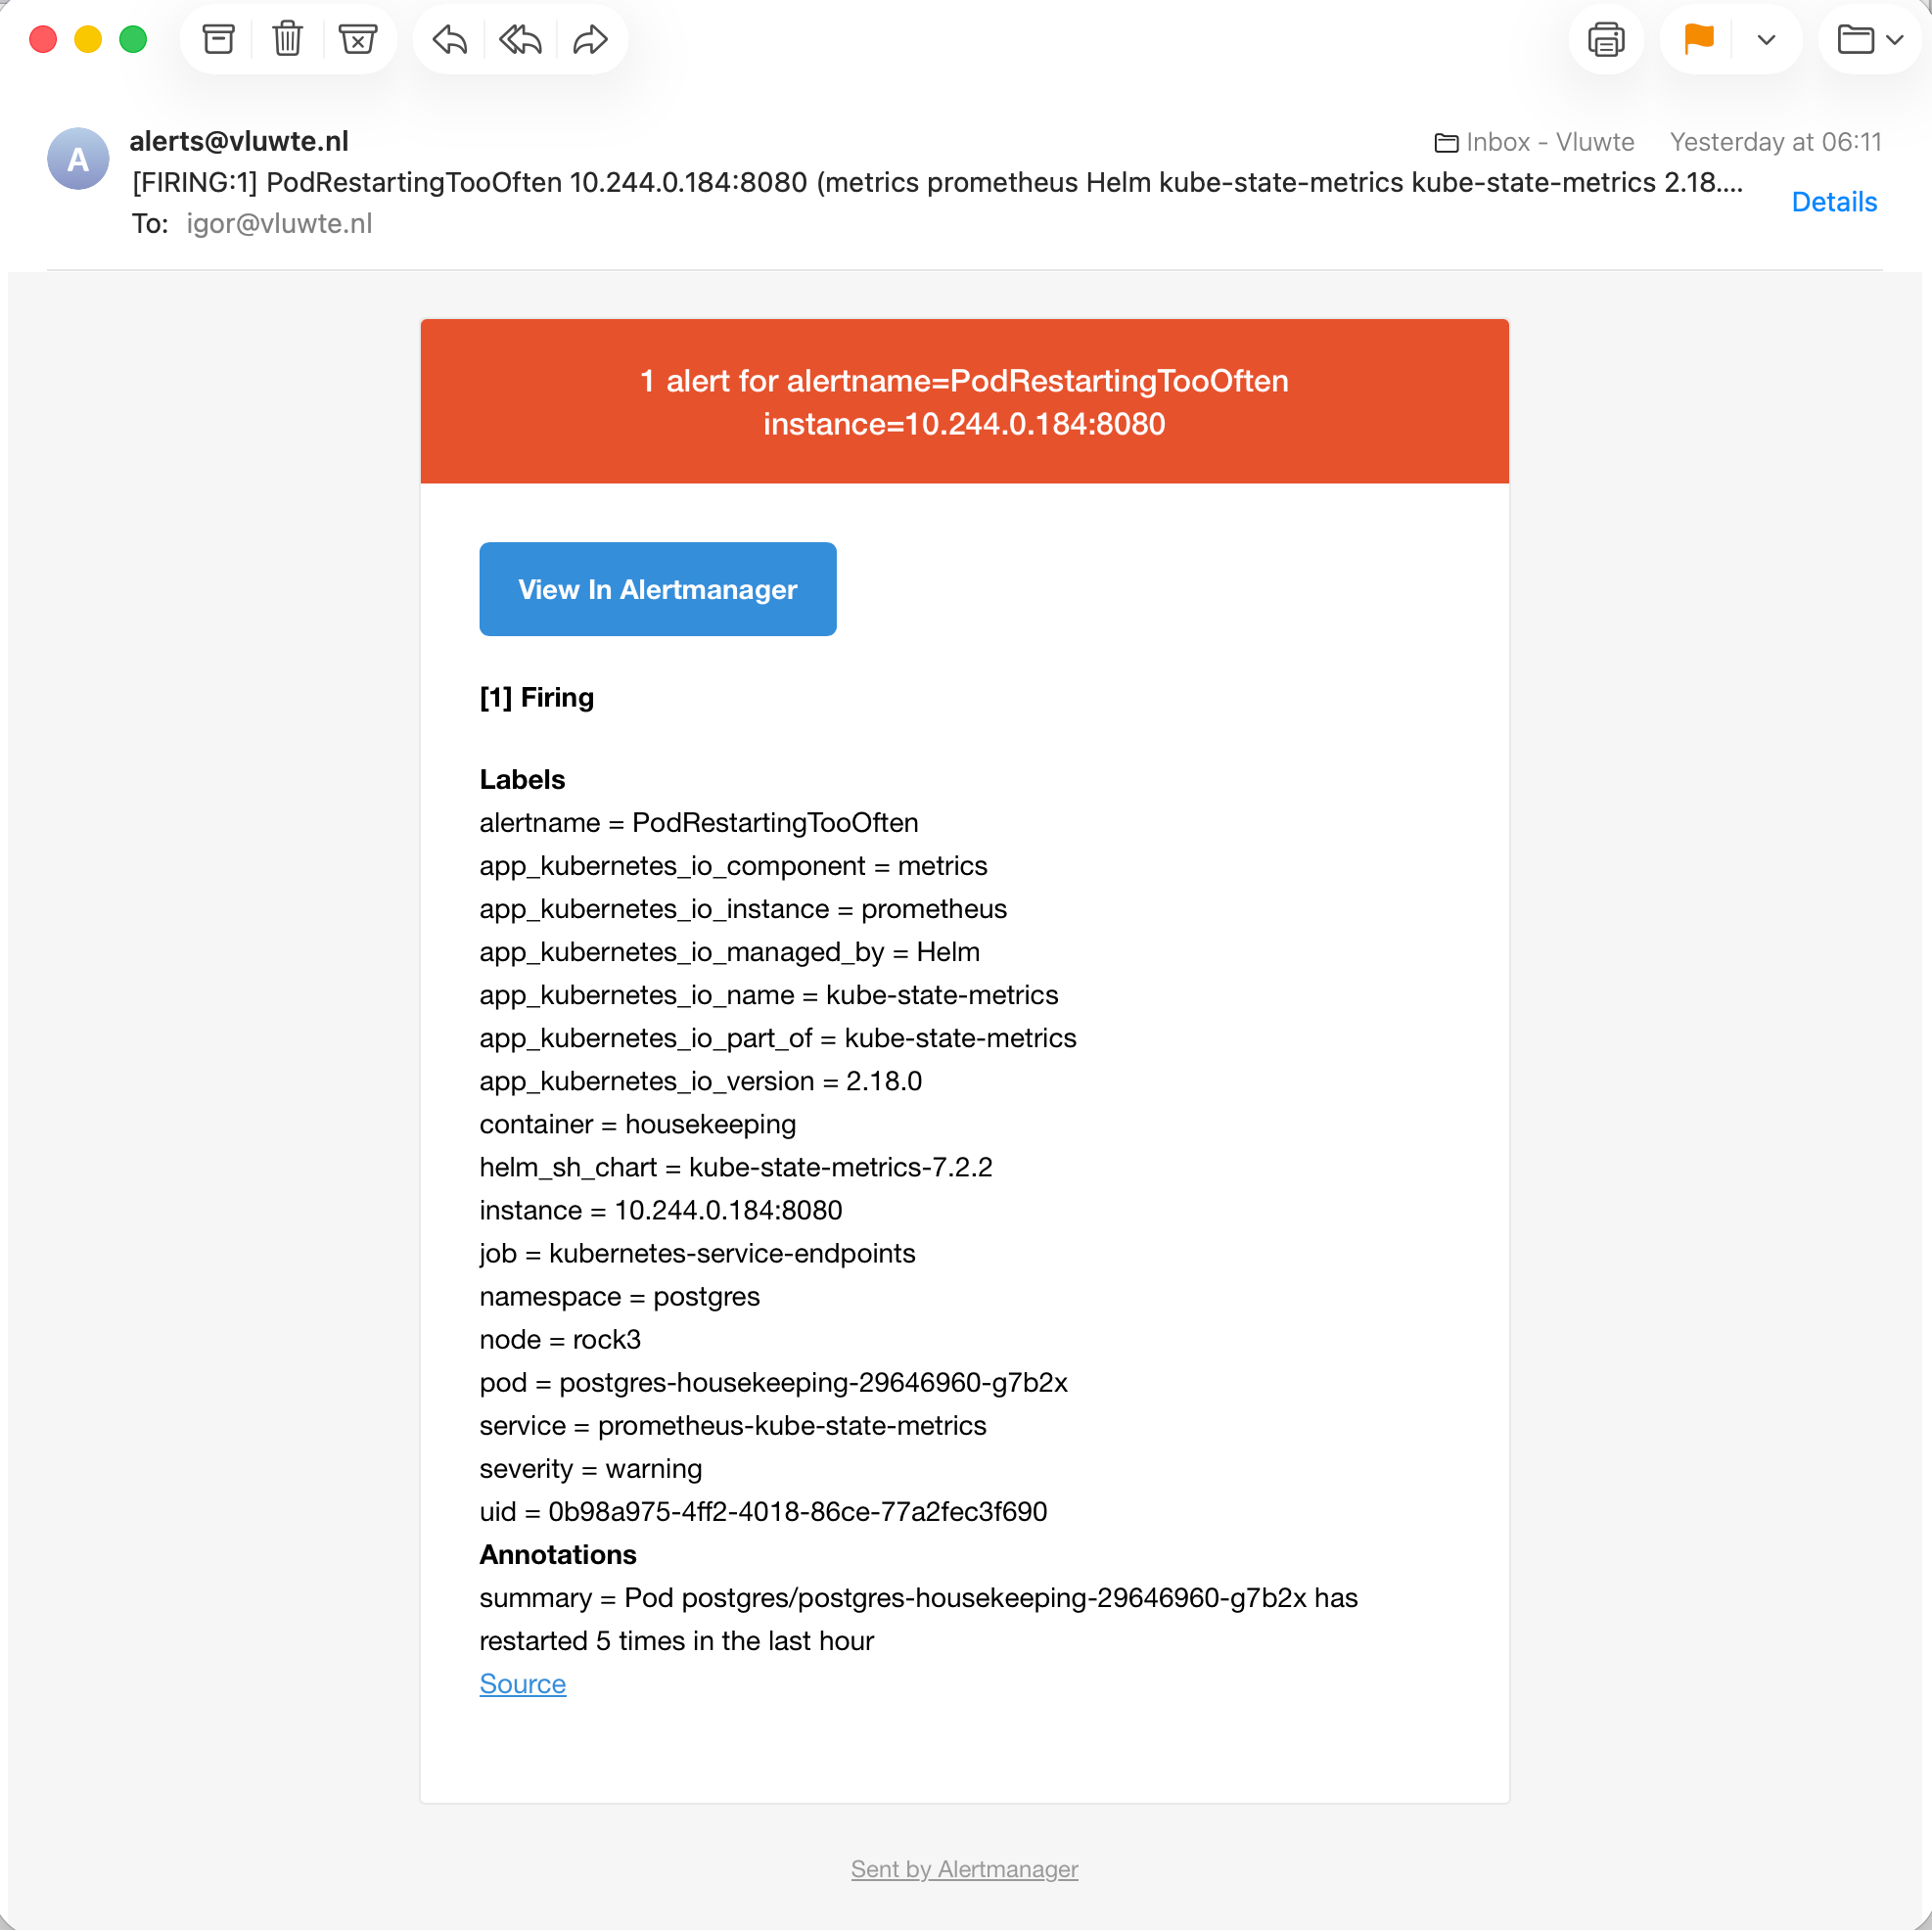
The PodRestartingTooOften rule is a metric-based alert from Part 4. It detected the symptom. Finding the cause required Loki.
The Query
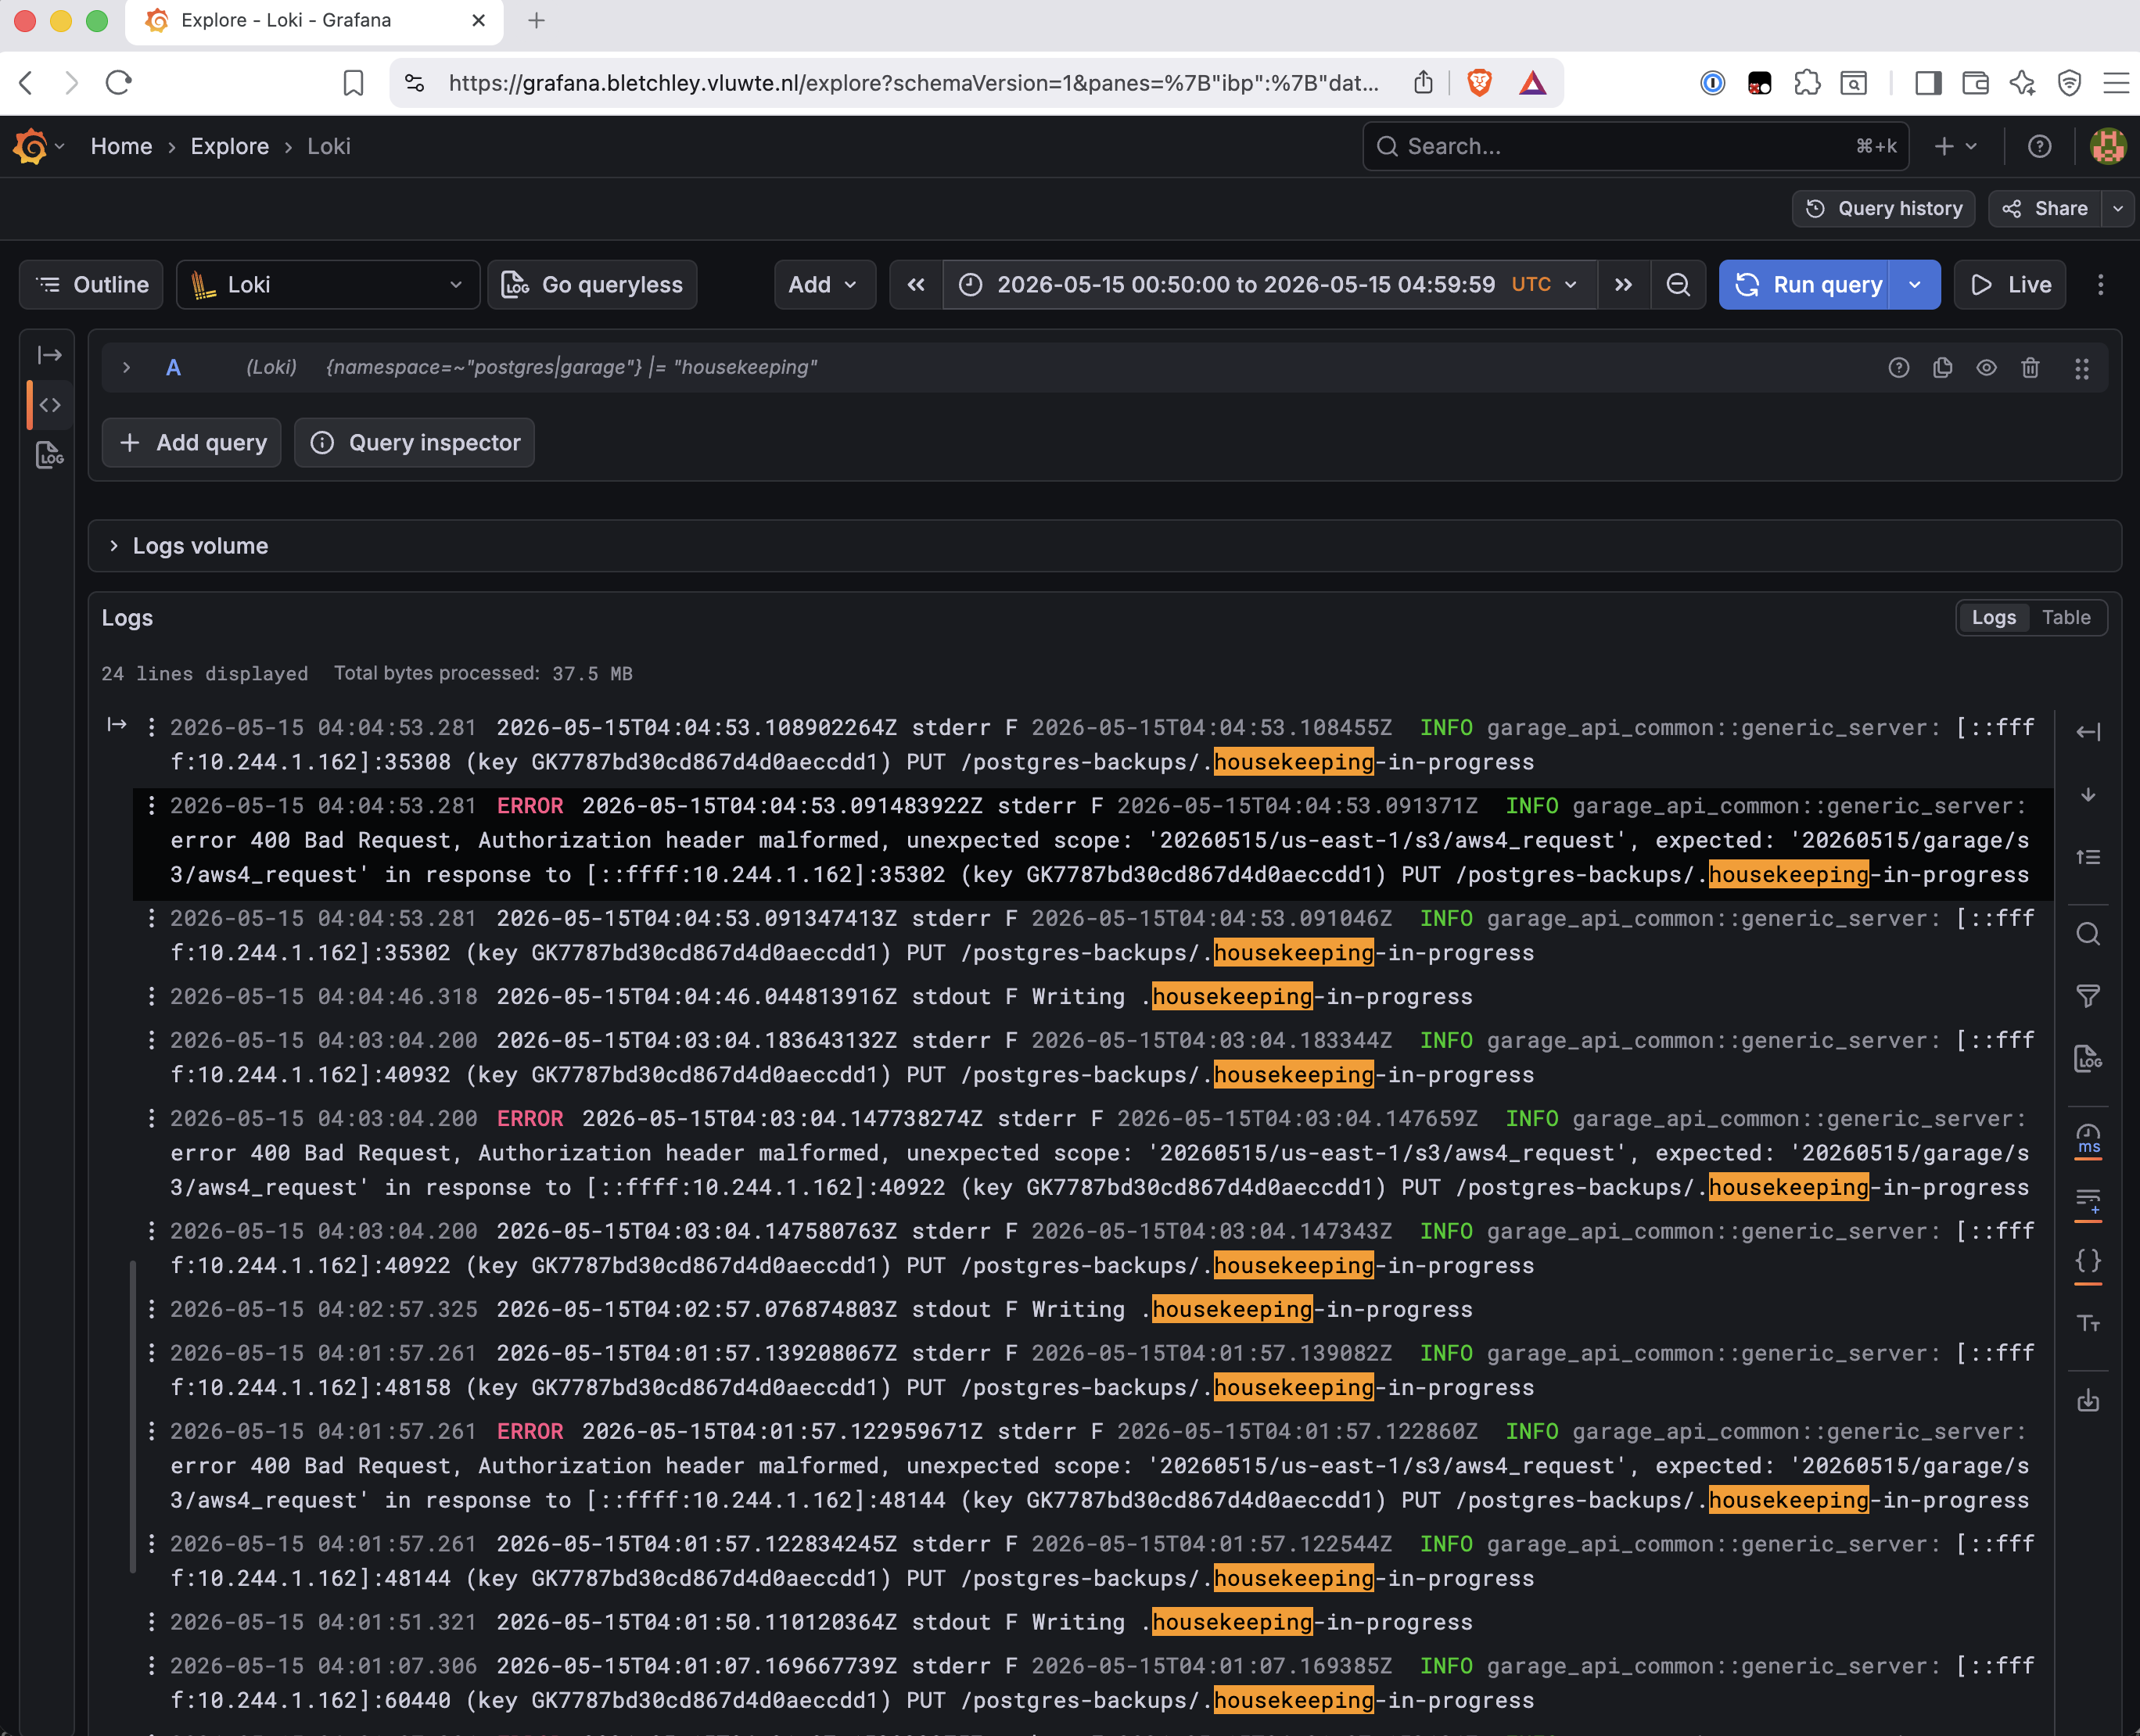
The housekeeping CronJob operates on PostgreSQL backups stored in Garage S3. Both namespaces are involved — the script runs in postgres, the S3 responses come from garage. A single cross-namespace query shows both sides:
{namespace=~"postgres|garage"} |= "housekeeping"
The Incident Sequence
Reading the log lines in time order:
- CronJob runs at 04:00 CEST on Friday May 15 — the weekly promotion code path
- Script logs
Writing .housekeeping-in-progressto stdout - Seven seconds later, Garage responds with
400 Bad Request— authorization header malformed - The error detail: got
20260515/us-east-1/s3/aws4_request, expected20260515/garage/s3/aws4_request - Script exits non-zero and the container enters a restart loop
- Pod restarts, retries — same failure, five times in ~50 minutes matching kubelet’s exponential restart backoff
- Alertmanager fires at 06:11
The root cause is an AWS CLI region string mismatch. The housekeeping script calls the AWS CLI with us-east-1 as the region, but Garage expects garage as the region identifier in the request signature. This only surfaces on Fridays because the weekly promotion code path is the only one that triggers this particular S3 operation — the daily backup path either uses a different operation or a different CLI invocation with the region set correctly.
The fix is straightforward: update the --region flag in the weekly promotion CLI call to garage. It was deferred — the next Friday run will fail again — but the root cause is understood and logged.
What the Logs Showed
Two things stand out about this investigation. First, the cause was only findable across two namespaces — the script log and the Garage response are in separate streams, but LogQL's regex label selector (namespace=~"postgres|garage") pulls them together in time order. Without log aggregation, diagnosing this would mean kubectl logs in one namespace, then another, then manually cross-referencing timestamps.
Second, the logs revealed the exact authorization header that was submitted and what Garage expected. There was no guessing involved — the error message is precise.
Investigation 2 — Forgejo Backup: Three Weeks of Silent Failure
Finding the Crash
The kubelet CrashLoopBackOff query pointed to the forgejo namespace, with 8–9 events per day from May 13 onwards. Drilling in to identify the pod:
{job="talos-service", talos_service="kubelet"} |= "CrashLoopBackOff" | json | pod_namespace="forgejo"
The crashing pod is forgejo-backup-* — not the main Forgejo application, but its backup CronJob. The main pod is healthy. Then the job's own logs:
{namespace="forgejo", pod=~"forgejo-backup-.*"}
The error, right before the crash:
cmd/dump.go:529:dumpDatabase() [E] [Error SQL Query]
SELECT id, repo_id, interval, enable_prune, updated_unix,
next_update_unix, lfs_enabled, lfs_endpoint, remote_address
FROM mirror [] - no such column: remote_address
The Root Cause
Forgejo was upgraded on April 23 — chart version bumped, main application image updated. The backup CronJob image was not updated. It remained pinned to code.forgejo.org/forgejo/forgejo:14.0.3-rootless, while the running Forgejo pod was at 15.0.0-rootless.
The forgejo-dump command in version 14.0.3 queries the mirror table including a remote_address column that was added or restructured in a later version. The schema at the 15.x level doesn't match what the 14.x dump tool expects. The backup Job fails on every scheduled run.
The timeline: the backup CronJob had been failing silently every night since April 23 — the day Forgejo was upgraded. Log collection only started on May 13, which is why it became visible then. Three weeks of failed backups, no alert, no visible impact on Forgejo itself.
The fix was a one-line change to the CronJob manifest:
- image: code.forgejo.org/forgejo/forgejo:14.0.3-rootless
+ image: code.forgejo.org/forgejo/forgejo:15.0.0-rootless
A manual backup run confirmed the fix:
forgejo-backup-test-26q5n forgejo-dump ... cmd/dump.go:517 [I] Dumping database...
forgejo-backup-test-26q5n forgejo-dump ... cmd/dump.go:421 [I] Finished dumping in file /dump/forgejo-dump-20260517-075329.zip
upload: ../dump/forgejo-dump-20260517-075329.zip to s3://forgejo-backup/dumps/...
What This Demonstrates
CronJob failures are easy to miss without dedicated alerting. The pod exits non-zero, the job is marked failed, and Kubernetes records the Job failure in status and Events, but generates no operator-facing alert or notification by default — no email, no visible change in the application. kube_job_status_failed from kube-state-metrics can drive a Prometheus alert rule for this, but that rule wasn't in place here. Loki made three weeks of nightly failures visible in a single query — and adding CronJob failure alerting is now on the list.
The lesson about version discipline is worth stating plainly: when upgrading an application, check whether any supporting jobs (backup CronJobs, migration jobs, maintenance scripts) use pinned images that also need updating. The main pod gets the new image; the CronJob is easy to miss.
Investigation 3 — Authelia: An i/o Timeout Reconstructed from Logs
What Happened
The query for Authelia errors:
{namespace="authelia"} | detected_level="error"
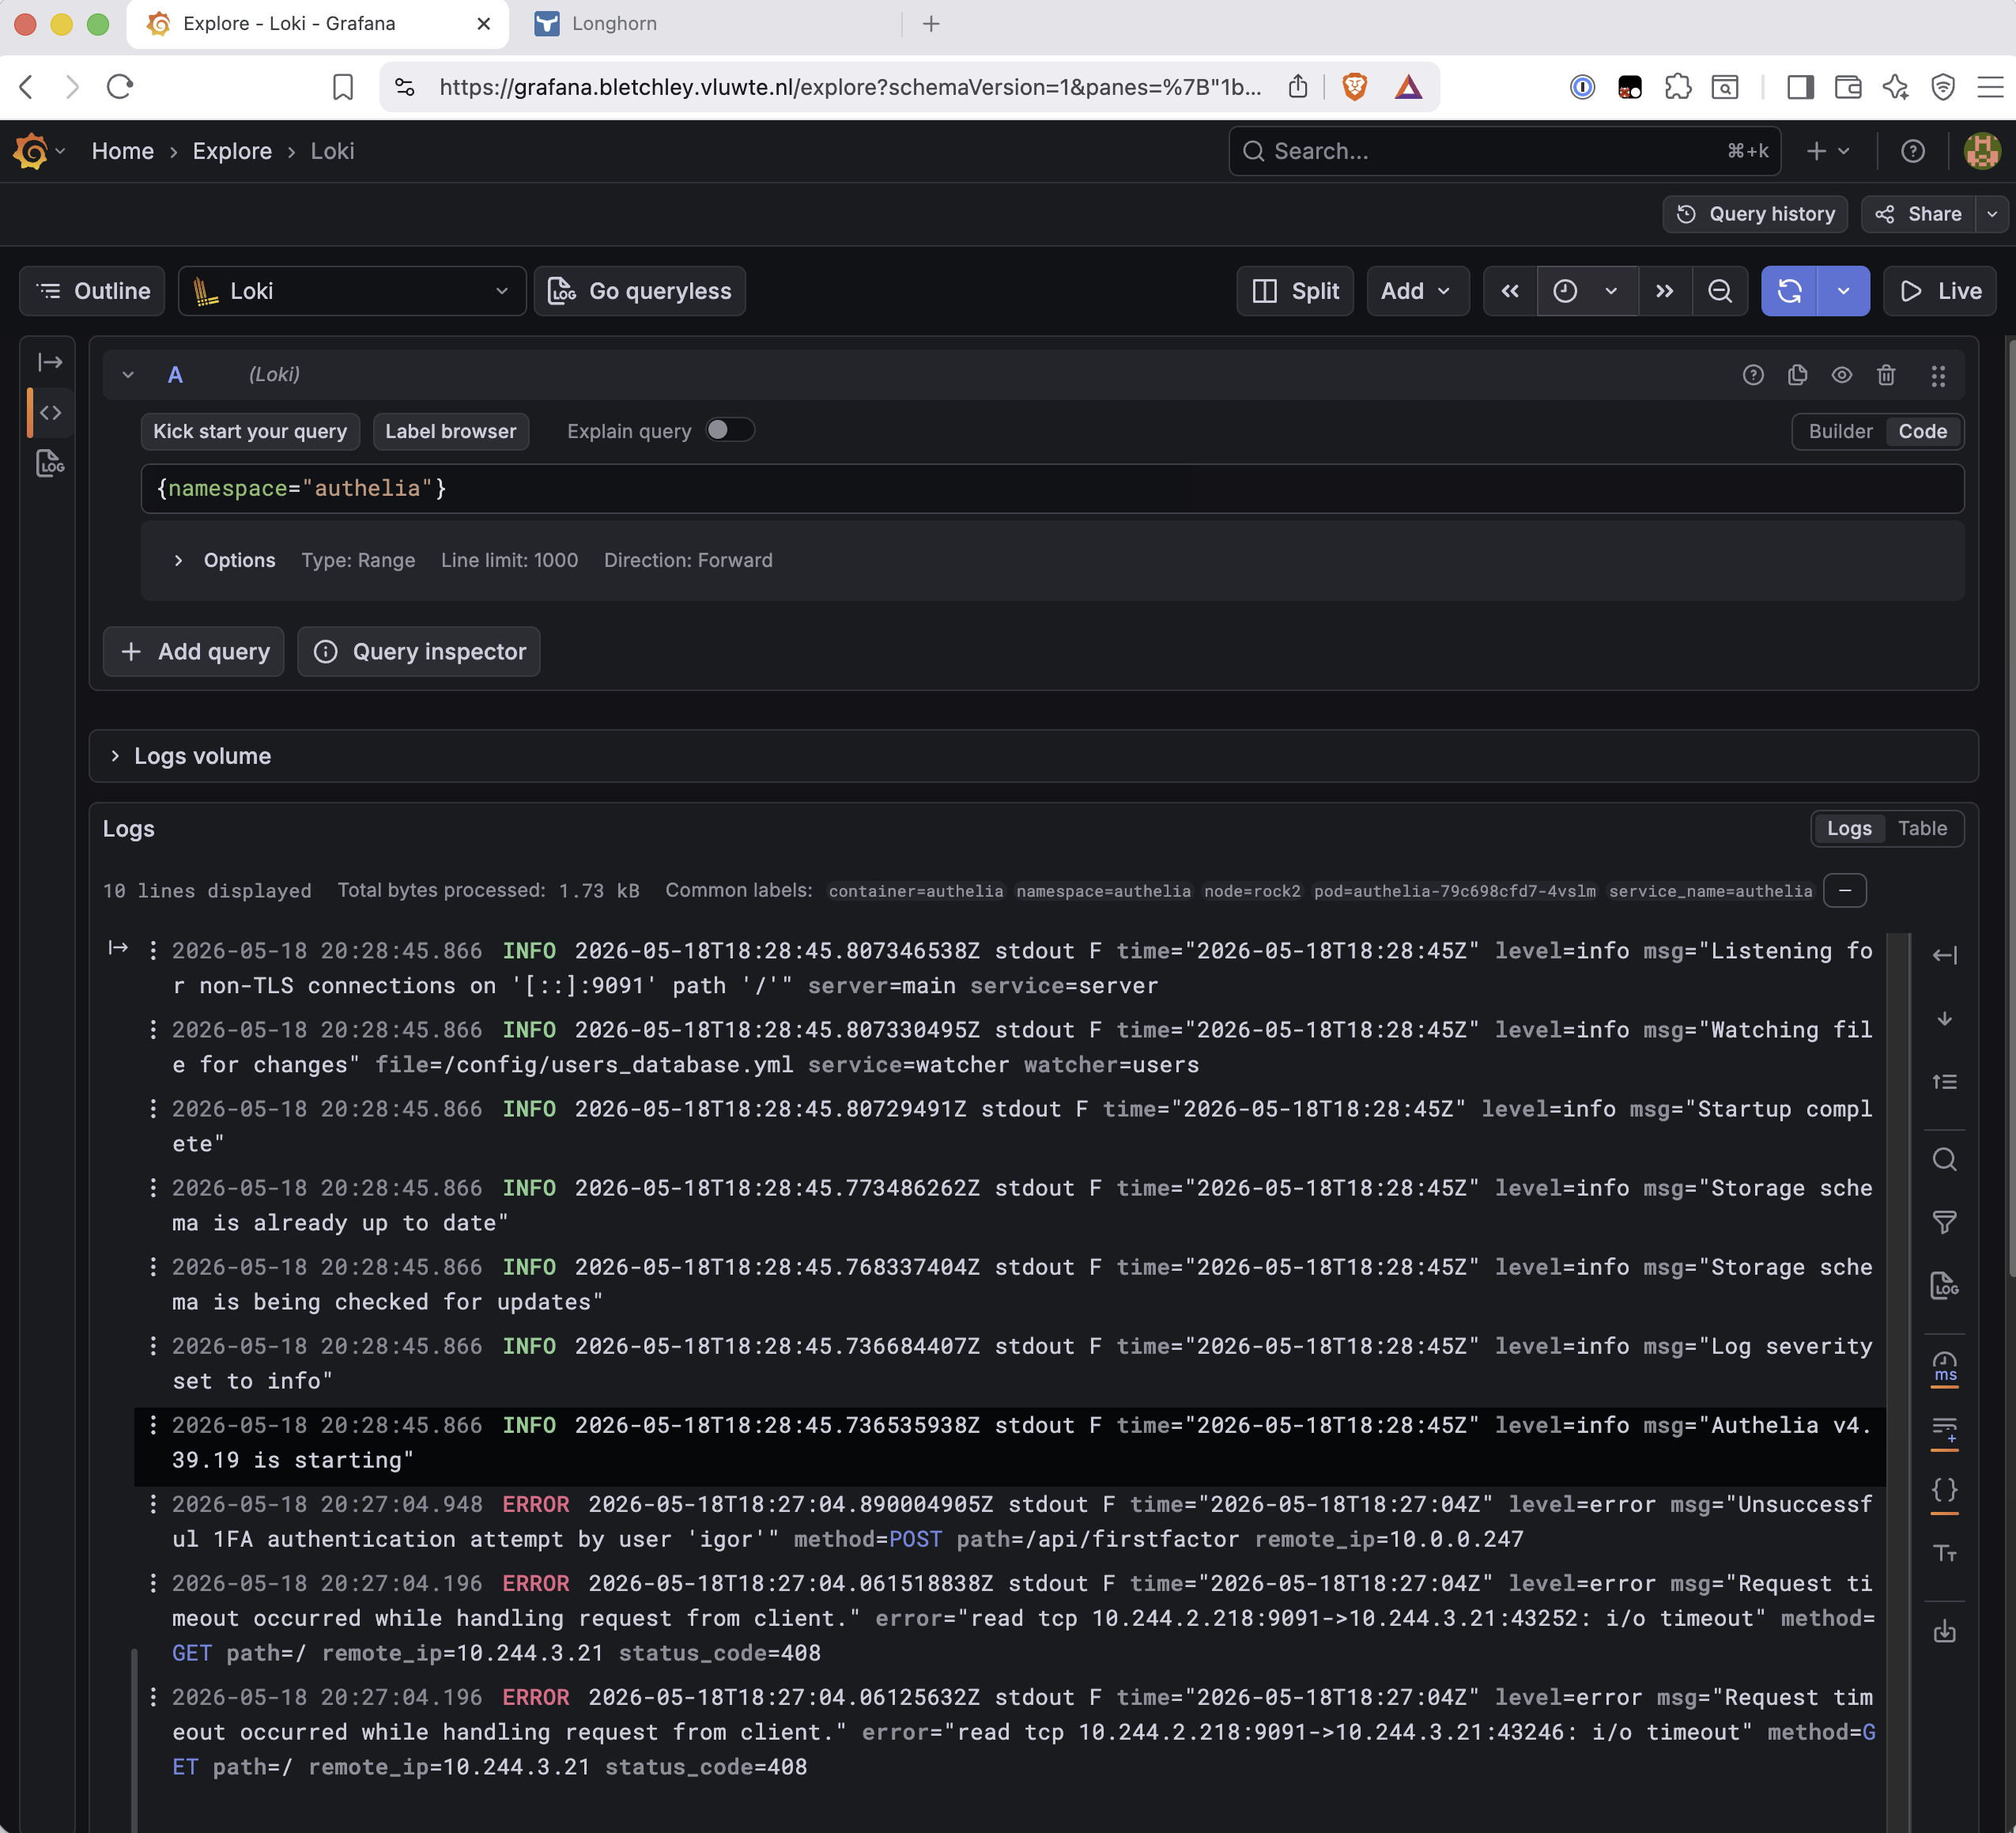
The sequence reads as follows:
- Wrong password entered at 18:27:04 — Authelia logs the failed authentication attempt
- At the same timestamp, Authelia hits its read timeout on two open ForwardAuth connections from Traefik (
10.244.3.21, rock4) - The TCP detail:
read tcp 10.244.2.218:9091->10.244.3.21:43252: i/o timeout— Authelia (10.244.2.218) waiting to read from Traefik. Traefik opened the connections and stopped sending, holding them open while waiting for browser input - Authelia returns
408 Request Timeoutto Traefik - At 18:28:45, Authelia restarts — "Authelia v4.39.19 is starting"
The browser shows "no available server" during the ~90-second restart window. This is reproducible on demand: enter a wrong password while multiple tabs are open to services behind Authelia.
Stern vs Loki for This Investigation
The Authelia issue is reproducible — which means it's actually better suited to live debugging with stern than to historical reconstruction in Loki. Running stern -n authelia authelia and triggering the failure gives the sequence in real time with no retention window constraints. Loki's value here is different: it shows the incident happened, establishes when, and reveals the cross-component chain (Traefik ForwardAuth → Authelia timeout → restart) without needing to have been watching at the time.
For fixing the issue — investigating Authelia's request timeout configuration and Traefik's ForwardAuth keepalive settings — stern is the right tool. For knowing the issue exists and understanding its pattern, Loki is what made it findable.
The fix is deferred. Operationally, the issue clears after the restart window (~90 seconds), though the underlying timeout/restart interaction still needs investigation.
Investigation 4 — Longhorn: High Volume, All Noise
The Apparent Signal
Longhorn-system generated the highest error volume of any namespace in the cluster — consistently 4K+ errors per day from May 13 onwards. The wide-net query makes it look like the most troubled part of the cluster.
Starting with a sum by (msg) to find what message type dominates:
sum by (msg) (
  count_over_time({namespace="longhorn-system", container="longhorn-manager"} | detected_level="error" | logfmt [1d])
)
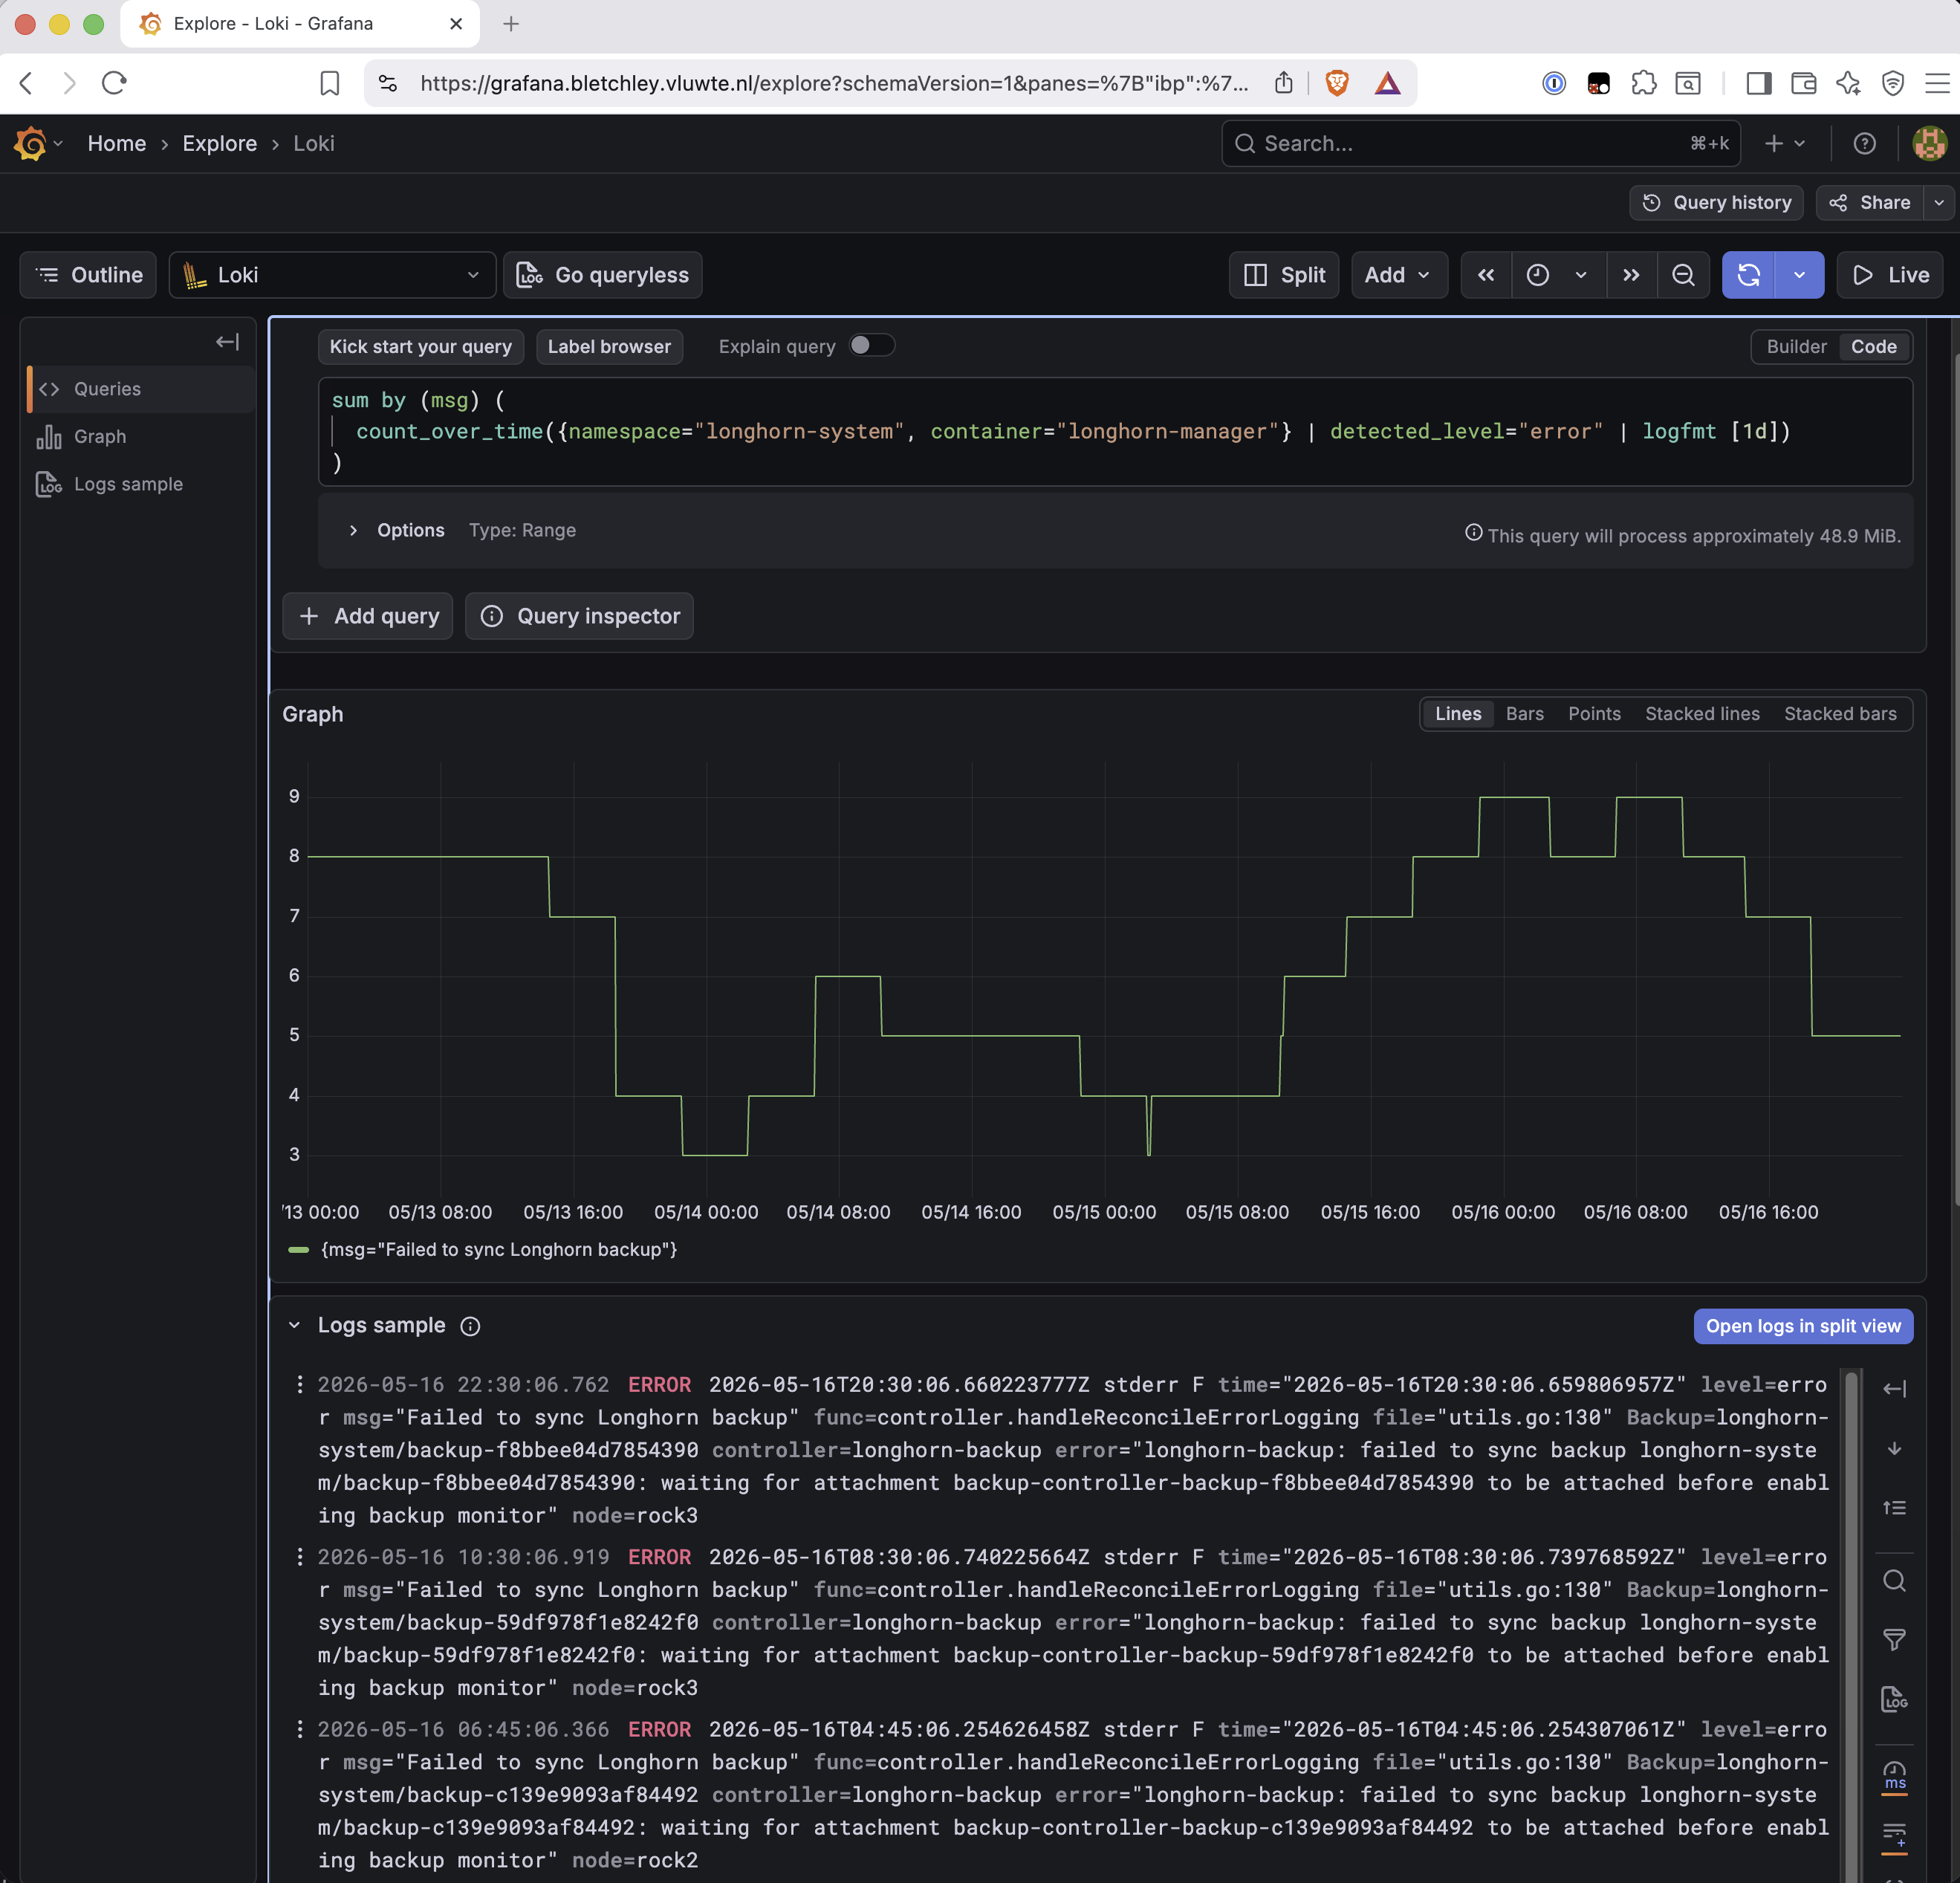
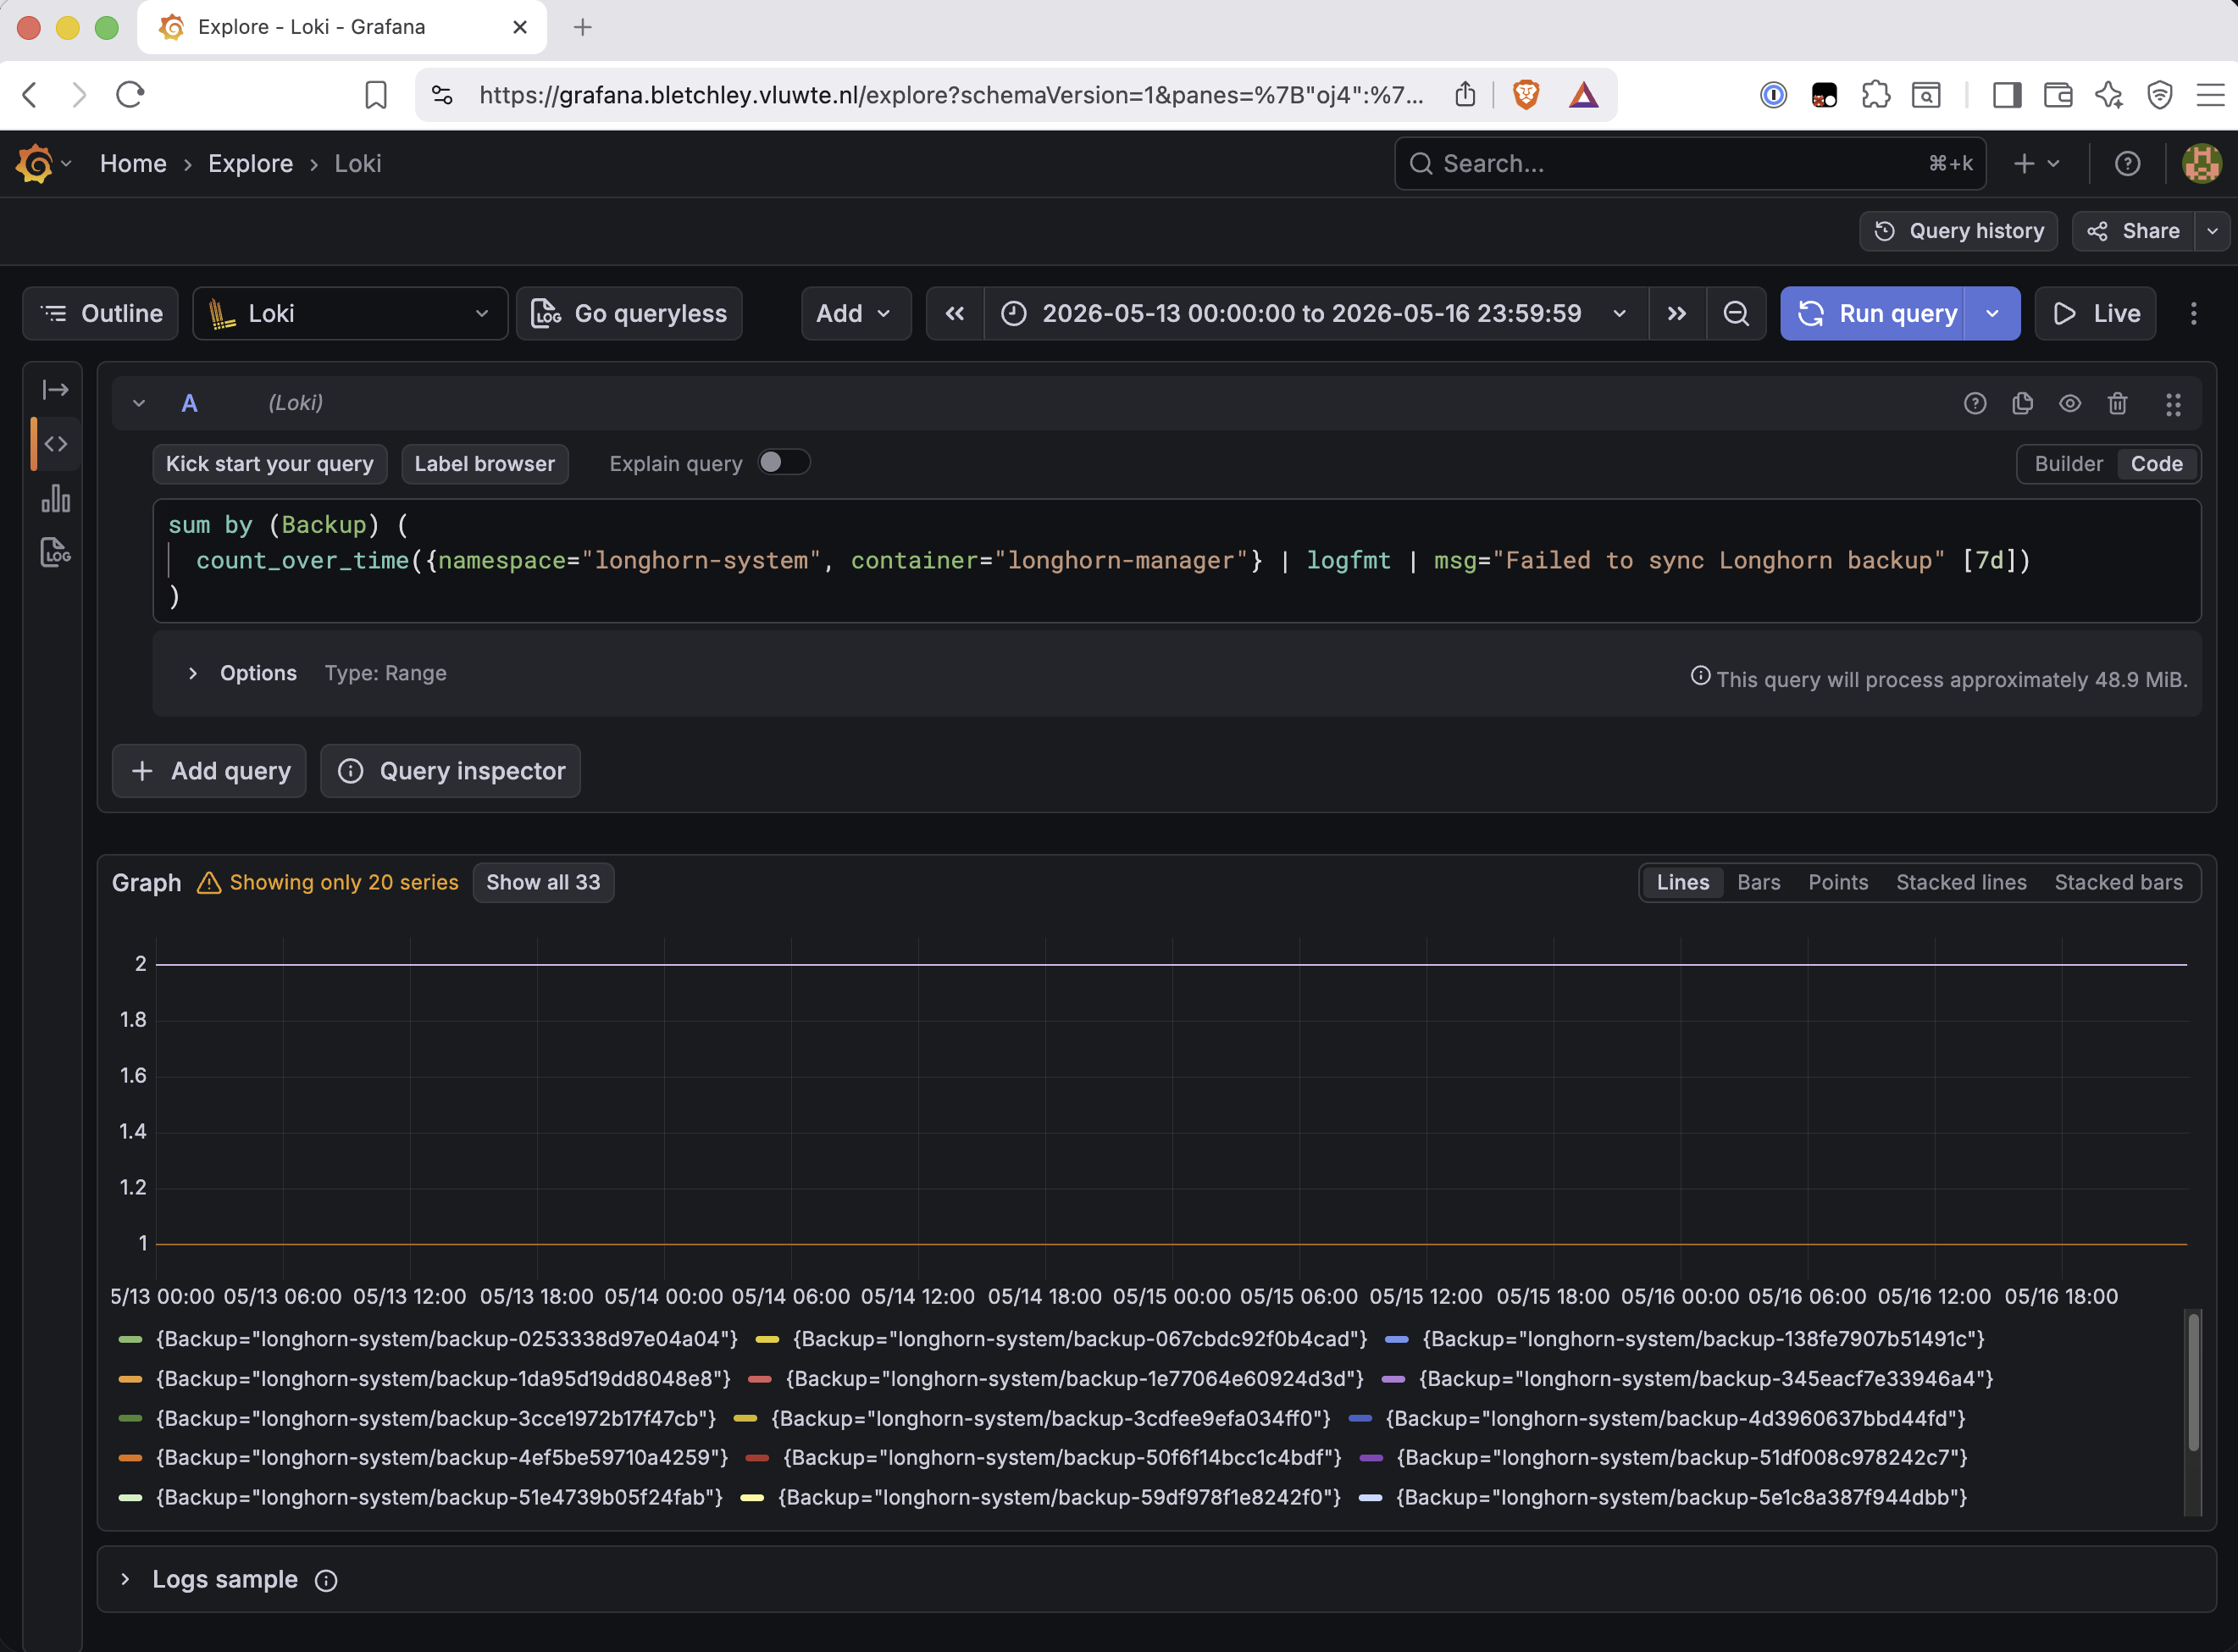
One message dominates: Failed to sync Longhorn backup with the detail waiting for attachment backup-controller-<id> to be attached before enabling backup monitor. Then checking whether any backup ID is appearing repeatedly — which would indicate something stuck — versus appearing once and resolving:
sum by (Backup) (
  count_over_time({namespace="longhorn-system", container="longhorn-manager"} | logfmt | msg="Failed to sync Longhorn backup" [7d])
)
The Conclusion
33 unique backup IDs over four days, each appearing once or at most twice (one retry). The timestamps cluster around :30 and :45 past the hour — matching the scheduled backup times. All four nodes are represented.
The Longhorn backup controller logs this transient attachment wait state at error level even though the backup completes successfully. There is no completion log line — Longhorn only logs the wait state, not success. The high error volume that looked alarming from the wide-net query is entirely noise. No storage issue is present, though the message would ideally be logged below error level to reduce noise.
This is the clearest example in the investigation of why error level does not equal actual error. Understanding what a message means — and checking whether it repeats — is what separates signal from noise.
Investigation 5 — Garage 404s: Longhorn Deduplication in Action
The Signal
Garage generated the highest raw 404 volume of anything in the cluster — around 2,200 per day, consistent across the entire May 13–16 window. As established in Part 9, detected_level="error" is misleading for Garage, so the correct query is:
{namespace="garage"} |= " 404 "
The logs volume chart showed steady red bars across every day, no spikes, no quiet periods. 17.5K 404s over four days. The first instinct was that something was broken.
What the Requests Actually Are
Reading the raw log lines, every 404 is a HEAD request from a Longhorn IP address targeting paths in the /longhorn-backups/backupstore/volumes/ bucket:
garage_api_common::generic_server: error 404 Not Found, Key not found in response to
[::ffff:10.244.2.164]:35778 HEAD /longhorn-backups/backupstore/volumes/74/65/
pvc-2c40ffe1-4553-49c5-b86c-aee3de4e18df/blocks/00/be/00befd...blk
HEAD requests — not GETs, not failed writes. Longhorn is asking "does this block exist?" before deciding whether to upload it. This is Longhorn's incremental backup deduplication: for each snapshot, the backup-controller checks every changed block against what's already in Garage. If the block is present (200), it's skipped. If it's absent (404), it's uploaded. The 404 is an expected part of the deduplication workflow rather than an operational failure.
Confirming Across All PVCs
The initial query used a regexp that assumed numeric directory prefixes in the path — volumes/\d+/\d+/pvc-... — and only returned 3 of the 7 backed-up PVCs. Garage uses both numeric and hex prefixes depending on the path type. A broader pattern captures all of them:
sum by (pvc) (
  count_over_time(
    {namespace="garage"} |= " 404 " | regexp `(?P<pvc>pvc-[a-f0-9-]+)/` [1d]
  )
)
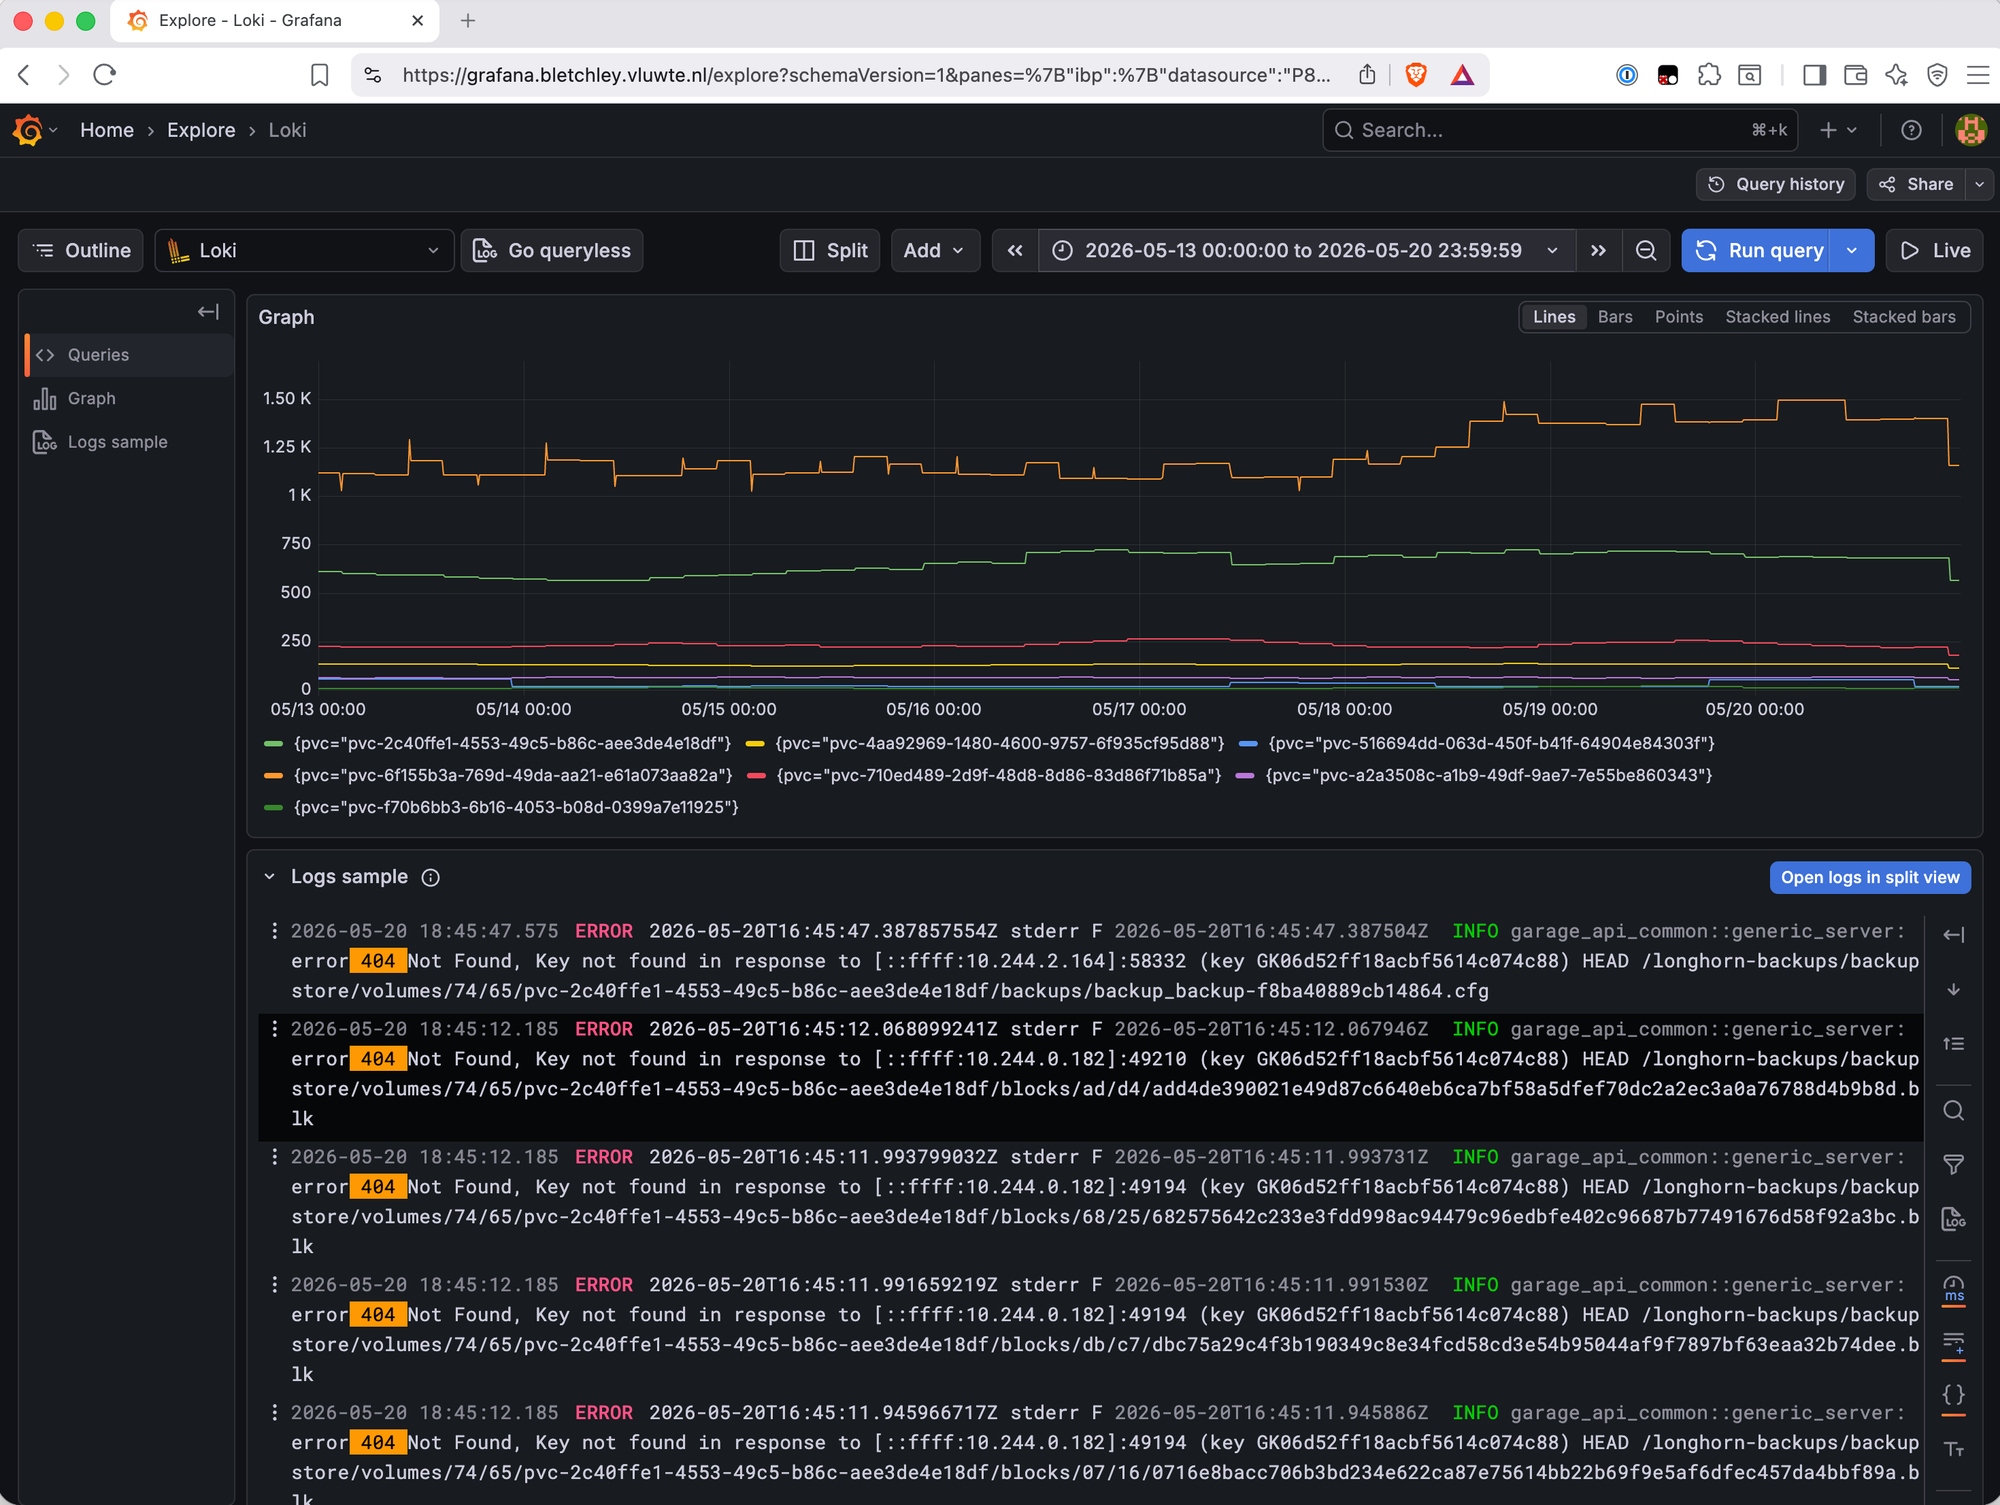
This returned all 7 PVCs. No PVC was producing disproportionate 404 volume. Cross-referencing with the Longhorn backup schedule confirmed the correlation: 404 activity in Garage clusters at :30 and :45 past the hour, matching the backup run times visible in kubectl get backupvolumes.
The Conclusion
The 17.5K 404s are entirely normal. Longhorn's backup deduplication generates one HEAD request per changed block per backup run — Garage returns 404 for new blocks, Longhorn uploads them, the backup completes. All 7 PVCs show healthy Completed backup state with no errors.
This is the second investigation (after Longhorn in Investigation 4) where high error volume turned out to be expected system behaviour. The difference from Investigation 4 is instructive: the Longhorn detected_level="error" noise was a logging level mismatch in the application itself. The Garage 404 noise required understanding the interaction between two systems — Longhorn's deduplication protocol and Garage's HTTP response logging — neither of which was broken. The signal only resolves when you understand both sides.
No action required. The corrected regexp (pvc-[a-f0-9-]+) is the more useful takeaway — it's the right tool for querying Garage logs by PVC going forward.
Investigation 6 — kube-system: Clean History, Backlog Artefacts
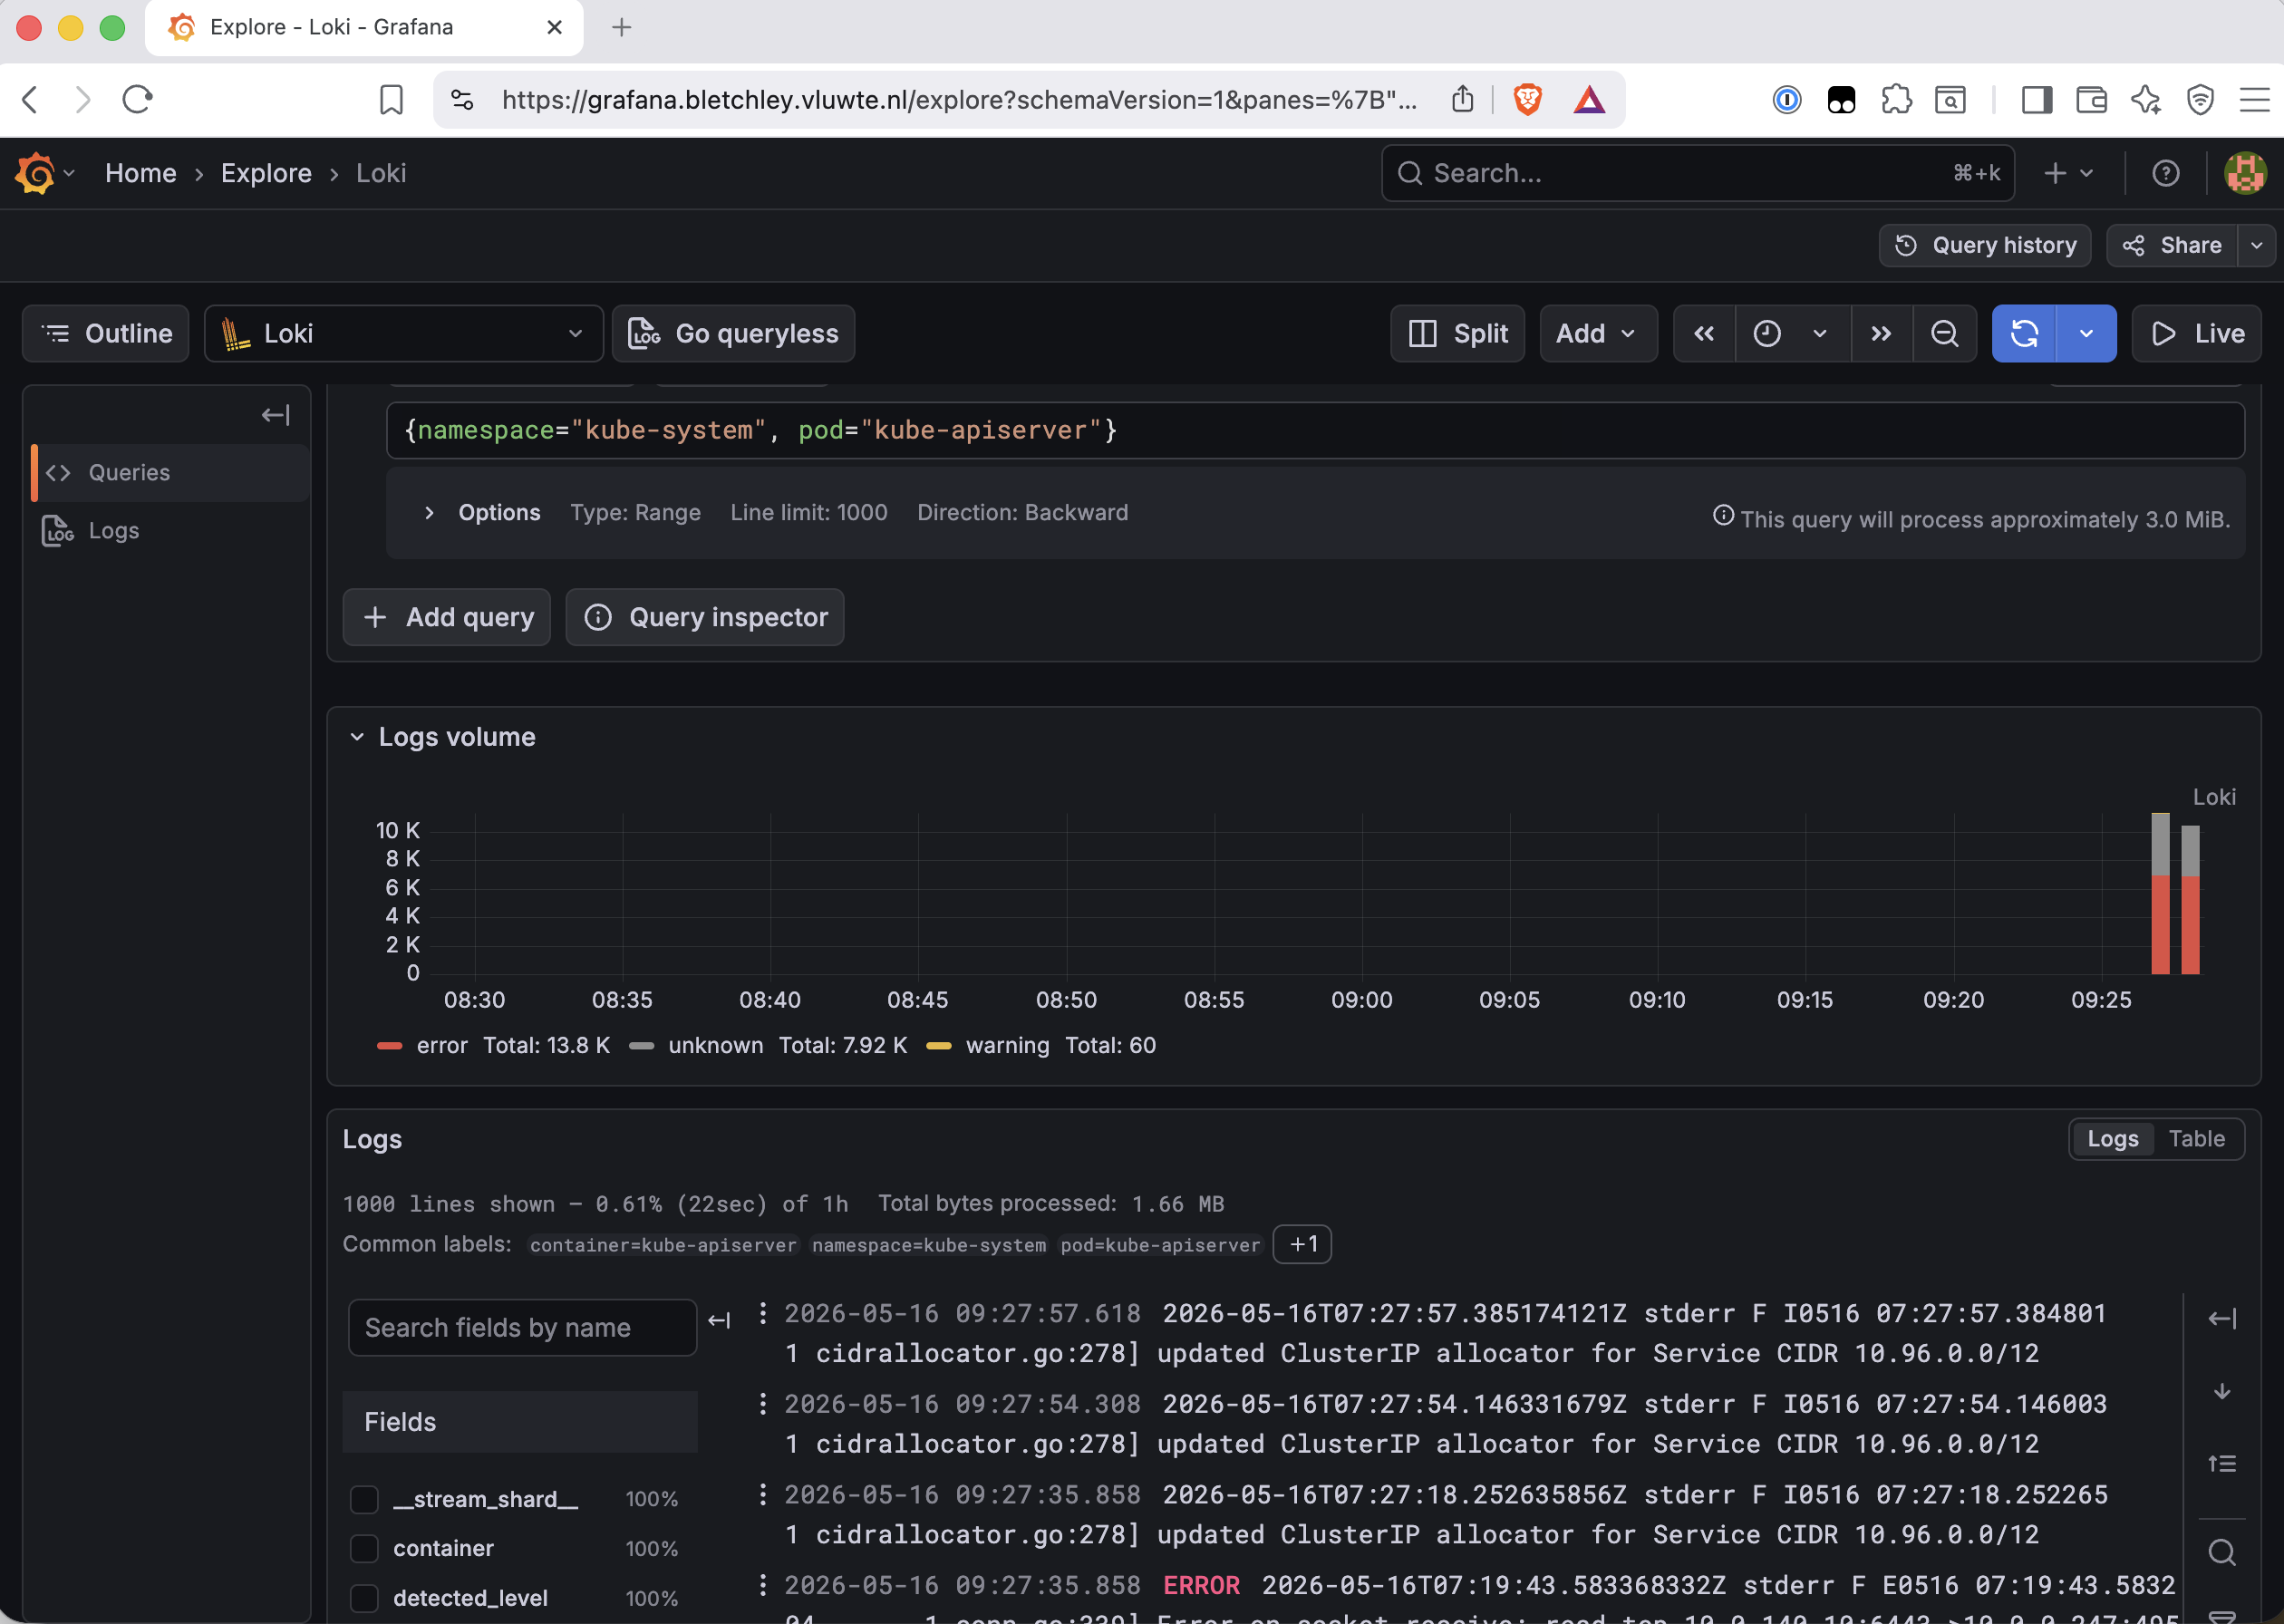
The kube-system errors visible in the wide-net query are dominated by the retroactive ingestion spike from May 16, when the static pod fix was applied and three weeks of on-disk logs arrived at once. Reading the app timestamps rather than the ingestion timestamps, the history is clean:
{namespace="kube-system", pod="kube-apiserver"} |~ "\\bE[0-9]{4}\\b"
Going through the actual app timestamps:
| Period (app timestamp) | Error | Assessment |
|---|---|---|
| April 22, 19:00 | etcd timeouts + handler timeouts during Longhorn settings apply | Bootstrap noise — one-time cluster setup |
| April 23, 02:00 | etcd timeout "possibly due to previous leader failure" | etcd leader election during early bring-up |
| May 2, 20:59 | Isolated etcd timeout | One-off, no follow-up errors |
| May 11, 18:35 | etcd timeout | Around rock1 reboot — expected |
| May 15, 20:33–35 | Three socket receive errors — 10.0.0.247:6443 closed connection |
kubectl session terminated by client (workstation) |
| May 16, 07:19 | One socket receive error — same pattern | kubectl session terminated by client |
The socket receive errors — conn.go:339 Error on socket receive: read tcp ... i/o timeout — are kubectl connections closing. Port 6443 is the workstation IP. These appear consistent with normal client disconnects from kubectl sessions rather than control-plane instability.
The etcd timeouts are all cluster bootstrap artefacts or correlated with known events (the May 11 reboot). No ongoing errors. The static pod log fix gave retroactive coverage back to April 22 — and the history it revealed is clean.
What the Cluster Is Telling Us
Six investigations. Summary:
| Finding | Severity | Status |
|---|---|---|
| Bootstrap artefact — pre-May 13 logs are unreliable duplicates | n/a | Understood — excluded from all queries |
| Postgres housekeeping CrashLoop — AWS CLI region mismatch with Garage | low | Known, fix deferred (next Friday will fail again) |
| Forgejo backup CrashLoop — backup job image pinned to old version | medium | Fixed — image updated, manual run successful |
| Authelia i/o timeout — Traefik ForwardAuth chain, wrong password → restart | medium | Known, fix deferred |
| Longhorn backup sync errors — transient wait state logged at error level | noise | No action required |
| Garage 404s — Longhorn backup deduplication HEAD checks across all 7 PVCs | noise | No action required |
| kube-system errors — bootstrap backlog and normal kubectl lifecycle | noise | No action required |
Two fixes applied during the investigation: the Forgejo backup image, and the Alloy static pod collection config from Part 9. The cluster is in better shape than the wide-net error counts suggested — the majority of the volume is noise from two well-understood system behaviours, and the remaining action items are bounded and non-urgent.
What Log Aggregation Actually Provided
The Forgejo silent failure is the clearest example. Without centralized log aggregation or dedicated Job failure alerting, the nightly failures remained effectively invisible. No alert, no visible impact, no indication in any dashboard. One LogQL query made the entire history visible immediately.
The Postgres/Garage cross-namespace reconstruction is the other one worth naming. The AWS region mismatch only became understandable by reading logs from two separate namespaces together — the script's stdout and Garage's HTTP response — in the correct time order. Reconstructing that timeline with kubectl logs alone would require manual correlation across multiple namespaces and pods.
The hard part of observability is rarely collecting telemetry. It's building enough system understanding to distinguish failure, retry, backlog, protocol mechanics, and expected transient states from each other.
What's Next
The next logical step is to make the two actionable findings — the postgres housekeeping failure and the Authelia restart — detectable before they generate alerts or silent failures. That's Part 11: configuring the Loki ruler to send log-based alerts directly to Alertmanager, using what this hunt found to design rules that actually fire on something real.
← Previous: Part 9: Know Your Logs
Questions or suggestions? Leave a comment below or reach out at igor@vluwte.nl.