Cluster Observability Part 7: Log Aggregation with Loki and Grafana Alloy
Loki + Grafana Alloy on ARM64: three deploy attempts, five Alloy River config gotchas, and logs finally flowing across all four cluster nodes.
Introduction
Metrics tell you that something is wrong. Logs tell you why. The Bletchley cluster has had Prometheus, Grafana, and Alertmanager in place since Part 1 — and that stack has been genuinely useful. But there's a gap it can't fill. When a pod crashes and restarts, or an error shows up in a graph, or an alert fires at 2am, the thing you actually want is the log output from the moment it happened. Without persistent log storage, those logs are gone the moment the pod dies.
The third pillar of observability is traces, but I'm not going there yet. Traces track a single request as it passes through multiple services, and Bletchley runs a small number of independent workloads with no chains of services calling each other. There's no practical benefit right now. Logs are the missing piece — persistent, queryable, correlated across pods and namespaces.
The goal here is straightforward: every pod's stdout and stderr, plus Kubernetes control plane component logs, should flow into a persistent in-cluster store, be retained for 30 days, and be queryable from Grafana using LogQL. Grafana Alloy runs as a DaemonSet on every node, collecting container logs from the host filesystem. Loki stores them. Everything connects to the existing Grafana instance.
Getting there took more iteration than expected. The Alloy River config syntax is less documented than Promtail's YAML ever was, and a few behaviours are non-obvious enough to cost real time. This post documents what actually worked, and why several things that looked correct on paper didn't.
This post is part of the Observability sub-series.
- Part 1: Prometheus and Node Exporter
- Part 2: Grafana Dashboards
- Part 3: MetalLB, Traefik and Ingress
- Part 4: Alerting with Alertmanager
- Part 5: Hardware Health Collectors
- Part 6: Hardware Health Dashboards and Alerts
- Part 7: Log Aggregation with Loki and Grafana Alloy
🏠 This is part of the Homelab Journey series - building a production Kubernetes cluster from scratch.
- PostgreSQL Backups
- Cluster Observability Part 7: Log Aggregation with Loki and Grafana Alloy (you are here)
This post assumes Prometheus and Grafana are already running in the monitoring namespace. If you're starting from scratch, Part 1 and Part 2 cover that setup.Why Loki and Alloy
The options for cluster-scale log aggregation are broader than they might look. The short version of the decision:
Promtail was the obvious first candidate — the Grafana Labs companion collector for Loki, well-documented, widely used. I ruled it out immediately: Grafana Labs has placed Promtail into long-term maintenance in favor of Alloy.
OpenObserve and VictoriaLogs are both interesting — single-binary deployments with lower resource footprints than Loki, and both have ARM64 support. I've flagged OpenObserve for future investigation. For now, Loki is the better choice: it's the current Grafana Labs stack, integrates directly with the existing Grafana instance as a datasource, and the community Helm chart is actively maintained.
OpenSearch with Fluent Bit adds an entirely separate UI and query language. At this scale with weeks of retention, it's substantial complexity without a clear payoff.
Loki + Grafana Alloy is the supported current-generation stack from Grafana Labs. Alloy is the successor to both Promtail and the Grafana Agent. It uses a configuration language called River (or Alloy HCL in newer documentation) rather than YAML, which is more expressive but less documented by example. That cost time. The benefit is avoiding a future migration.
Both grafana/loki and grafana/alloy publish multi-arch images with ARM64 support. On this cluster, with the ARM64 image debugging from Part 5 still fresh, that was the first thing checked.
Deploying Loki
Loki in monolithic mode runs as a single binary handling reads and writes. For a 4-node cluster with weeks of retention, the distributed/microservices mode adds complexity without justification. Monolithic mode is the most practical deployment shape here.
This deployment also uses Loki's filesystem storage backend on a Longhorn PVC rather than object storage. Filesystem storage is appropriate for small single-replica deployments, but larger or highly-available Loki clusters should use object storage instead.
The Loki community Helm chart is at oci://ghcr.io/grafana-community/helm-charts/loki and I pinned to version 13.6.2 (appVersion 3.7.1). The chart went through a naming change between versions — deploymentMode: Monolithic replaced SingleBinary in chart v12, and some values key names shifted. Worth knowing if you're working from older examples.
The values file went through three rounds before Loki ran cleanly.
First attempt — the filesystem path trap
My initial values included explicit chunks_directory and rules_directory paths under loki.storage.filesystem. Adding explicit filesystem path overrides caused the chart validation logic to treat the deployment as incompatible with monolithic filesystem storage:
Error: execution error at (loki/templates/validate.yaml:19:4): Cannot run scalable targets
(backend, read, write) or distributed targets without an object storage backend.
The fix was to remove those sub-keys and let the chart use its default filesystem paths. Combined with explicitly zeroing out the backend, read, and write replicas, the chart accepted the configuration as unambiguously monolithic:
backend:
  replicas: 0
read:
  replicas: 0
write:
  replicas: 0
Second attempt — the compactor crash
With the path issue resolved, Loki started but loki-0 immediately entered CrashLoopBackOff. The logs were clear:
level=error ts=... msg="validating config" err="CONFIG ERROR: invalid compactor config:
compactor.delete-request-store should be configured when retention is enabled"
When retention_enabled: true, the compactor needs an explicit store for delete requests. One line fixes it:
compactor:
  delete_request_store: filesystem
Third attempt — memcached eating all the RAM
After the two config fixes, Loki came up — but loki-chunks-cache-0 stayed in Pending. Describing the pod showed why:
Requests:
  memory: 9830Mi
The chart deploys Memcached by default as a performance cache for chunks and query results. On a 4-node ARM cluster with limited RAM, nearly 10 GiB for a cache component is not viable. For small deployments, Memcached is an optimisation with no practical benefit. Disabling it:
chunksCache:
  enabled: false

resultsCache:
  enabled: false
With those two lines added, all pods came up cleanly.
The working values file
apps/monitoring/loki/values.yaml:
deploymentMode: Monolithic

loki:
  auth_enabled: false  # single-tenant in-cluster — no credentials needed

  commonConfig:
    replication_factor: 1

  storage:
    type: filesystem

  schemaConfig:
    configs:
      - from: "2024-04-01"
        store: tsdb
        object_store: filesystem
        schema: v13
        index:
          prefix: loki_index_
          period: 24h

  ingester:
    wal:
      enabled: true
      dir: /var/loki/wal

  limits_config:
    retention_period: 30d
    ingestion_rate_mb: 4
    ingestion_burst_size_mb: 8
    max_streams_per_user: 10000

  compactor:
    retention_enabled: true
    compaction_interval: 10m
    retention_delete_delay: 2h
    delete_request_store: filesystem

  ruler:
    enable_api: true
    alertmanager_url: http://prometheus-alertmanager.monitoring.svc.cluster.local:9093
    storage:
      type: local
      local:
        directory: /var/loki/rules
    rule_path: /var/loki/rules-temp

singleBinary:
  replicas: 1
  persistence:
    storageClass: longhorn
    size: 20Gi
    whenDeleted: Retain
    labels:
      backup.vluwte.nl/name: loki       # Bletchley specific backup-controller label
      backup.vluwte.nl/enabled: "true"  # Bletchley specific backup-controller label
      backup.vluwte.nl/start: "0045"    # Bletchley specific backup-controller label

backend:
  replicas: 0
read:
  replicas: 0
write:
  replicas: 0

chunksCache:
  enabled: false

resultsCache:
  enabled: false
A note on the singleBinary key: despite deploymentMode: Monolithic, the PVC configuration lives under singleBinary, not monolithic. This is a chart naming quirk that caught me out on the first deploy — the PVC size came out at 10 Gi instead of 20 Gi because the monolithic.persistence block I used first had no effect. Setting whenDeleted: Retain is also important: the default chart behaviour deletes the PVC on helm uninstall, which can catch you out if you need to reinstall.
Deploy:
helm upgrade --install loki \
  oci://ghcr.io/grafana-community/helm-charts/loki \
  --version 13.6.2 \
  --namespace monitoring \
  --values apps/monitoring/loki/values.yaml
The community Helm chart deploys an nginx gateway by default in front of the Loki binary. The chart-supported ingress point is http://loki-gateway.monitoring.svc.cluster.local/loki/api/v1/push — not the direct Loki port at 3100. This distinction matters both for Alloy's config and for the Grafana datasource URL, and it caused connection failures in both places before I understood the architecture.
Deploying Grafana Alloy
Alloy runs as a DaemonSet — one pod per node — so every node collects logs from its own pods. It needs read access to /var/log/pods/ on the host filesystem, where Kubernetes writes container log files on Talos.
Alloy also maintains a positions file tracking how far it has read through each log file. Without persistent positions storage, a pod restart can cause short gaps or duplicate ingestion while Alloy catches up from the start of each file. For this cluster, the default ephemeral positions state is acceptable, but larger or production environments should persist positions on disk.
The OCI 403
The plan was to install Alloy via the OCI path at oci://ghcr.io/grafana/helm-charts/alloy. That returned a 403. The Alloy chart has not moved to OCI — it's still in the standard HTTP Helm repo:
helm repo add grafana https://grafana.github.io/helm-charts
helm repo update
Values structure surprises
Several values keys were in unexpected locations. tolerations must be under controller, not at the top level. extra volumes must also be under controller, while mounts.extra is under alloy. These distinctions are not obvious from the chart README, and the error messages when they're wrong are not always clear.
apps/monitoring/alloy/values.yaml:
controller:
  type: daemonset
  tolerations:
    - operator: Exists  # run on control plane nodes too
  volumes:
    extra:
      - name: run-containerd
        hostPath:
          path: /run/containerd

alloy:
  mounts:
    varlog: true  # mounts /var/log from host
    extra:
      - name: run-containerd
        mountPath: /run/containerd
        readOnly: true

  configMap:
    create: true
    content: ""  # supplied via --set-file

  resources:
    requests:
      cpu: 100m
      memory: 256Mi
    limits:
      cpu: 250m
      memory: 512Mi

rbac:
  create: true

service:
  enabled: true
  type: ClusterIP
The tolerations: - operator: Exists covers all node taints, which is necessary for Alloy to schedule on the Talos control plane nodes. Without it, logs from the API server, etcd, and scheduler would not be collected.
Writing the Alloy River Config
This is where the most iteration happened. Alloy's configuration language (River) is composable — each component is declared separately and wired together explicitly. It's more powerful than Promtail's YAML, but also more unforgiving about the order and structure of declarations.
The original plan included Talos system logs — pushed over TCP from each node to an Alloy listener — collected alongside container logs in the same pipeline. In Alloy v1.16.1, there is no loki.source.tcp component suitable for ingesting raw json_lines TCP streams. loki.source.api exists, but it expects Loki's HTTP push format. Talos system log collection is deferred to a follow-up post.
Three things that surprised me about discovery.kubernetes
First: discovery.kubernetes does not set __path__ automatically. Unlike some collectors, Alloy's Kubernetes pod discovery gives you pod metadata labels but does not construct a file path from them. The path has to be built explicitly in a discovery.relabel rule.
Second: The path building rule must come before the labeldrop rule that removes __meta_* labels. I had the labeldrop rule first in my initial config, which silently dropped the UID and container name before they could be used to build the path. The result was empty paths and no logs collected.
Third: loki.source.file expects resolved file targets rather than raw glob expansion. In practice, a local.file_match component is needed between discovery.relabel and loki.source.file to turn glob patterns into concrete file paths.
The correct path pattern on Talos
The log directory structure on a Talos node looks like this:
/var/log/pods/kube-system_kube-apiserver-rock3_30a259a73789d8a6e32b1f3c2ea94a66/kube-apiserver/0.log
The directory name is namespace_podname_uid, and the log file is at container/0.log. The correct glob pattern uses the UID wrapped in wildcards to match this naming convention, with the separator between __meta_kubernetes_pod_uid and __meta_kubernetes_pod_container_name set to ; to keep both values accessible via capture groups:
rule {
  source_labels = ["__meta_kubernetes_pod_uid", "__meta_kubernetes_pod_container_name"]
  separator     = ";"
  regex         = "(.+);(.+)"
  target_label  = "__path__"
  replacement   = "/var/log/pods/*$1*/$2/*.log"
}
The working config
apps/monitoring/alloy/config.alloy:
// Destination — Loki gateway
loki.write "default" {
  endpoint {
    url = "http://loki-gateway.monitoring.svc.cluster.local/loki/api/v1/push"
  }
}

// Discover all pods in the cluster
discovery.kubernetes "pods" {
  role = "pod"
}

// Build file paths and promote labels
// Anti-cardinality: only namespace, pod, container, node become stream labels.
// Do NOT add version labels, pod-template-hash, or annotations —
// each unique combination creates a new stream.
discovery.relabel "pod_logs" {
  targets = discovery.kubernetes.pods.targets

  // Path rule MUST come before labeldrop
  rule {
    source_labels = ["__meta_kubernetes_pod_uid", "__meta_kubernetes_pod_container_name"]
    separator     = ";"
    regex         = "(.+);(.+)"
    target_label  = "__path__"
    replacement   = "/var/log/pods/*$1*/$2/*.log"
  }

  rule {
    source_labels = ["__meta_kubernetes_namespace"]
    target_label  = "namespace"
  }
  rule {
    source_labels = ["__meta_kubernetes_pod_name"]
    target_label  = "pod"
  }
  rule {
    source_labels = ["__meta_kubernetes_pod_container_name"]
    target_label  = "container"
  }
  rule {
    source_labels = ["__meta_kubernetes_node_name"]
    target_label  = "node"
  }

  // Drop all remaining __meta_ labels
  rule {
    regex  = "__meta_.*"
    action = "labeldrop"
  }
}

// Expand globs into actual file paths
local.file_match "pod_logs" {
  path_targets = discovery.relabel.pod_logs.output
  sync_period  = "5s"
}

// Read log files and forward to Loki
loki.source.file "pod_logs" {
  targets    = local.file_match.pod_logs.targets
  forward_to = [loki.write.default.receiver]
}
Deploy with --set-file to pass the config:
helm upgrade --install alloy grafana/alloy \
  --version 1.8.1 \
  --namespace monitoring \
  --values apps/monitoring/alloy/values.yaml \
  --set-file alloy.configMap.content=apps/monitoring/alloy/config.alloy
One hardening option worth knowing about: the config above relies on local.file_match to implicitly scope each Alloy pod to its own node — only paths that exist locally are surfaced as targets. If you want to make that scoping explicit, you can expose the node name as an environment variable via the Helm values and add a keep rule in discovery.relabel that filters targets to only those scheduled on the current node. I intend to make that change before Part 8, and will include the updated config there.
Adding Loki to Grafana
The Loki datasource is added to the existing Grafana Helm values file. The URL must point at the gateway, not the direct Loki port:
datasources:
  datasources.yaml:
    apiVersion: 1
    datasources:
      - name: Loki
        type: loki
        url: http://loki-gateway.monitoring.svc.cluster.local
Upgrade Grafana with the pinned chart version:
helm upgrade grafana grafana/grafana \
  --version 10.5.15 \
  --namespace monitoring \
  --values apps/monitoring/grafana/grafana-values.yaml
In this setup, datasource provisioning changes were not picked up until the Grafana pod restarted:
kubectl rollout restart deployment grafana -n monitoring
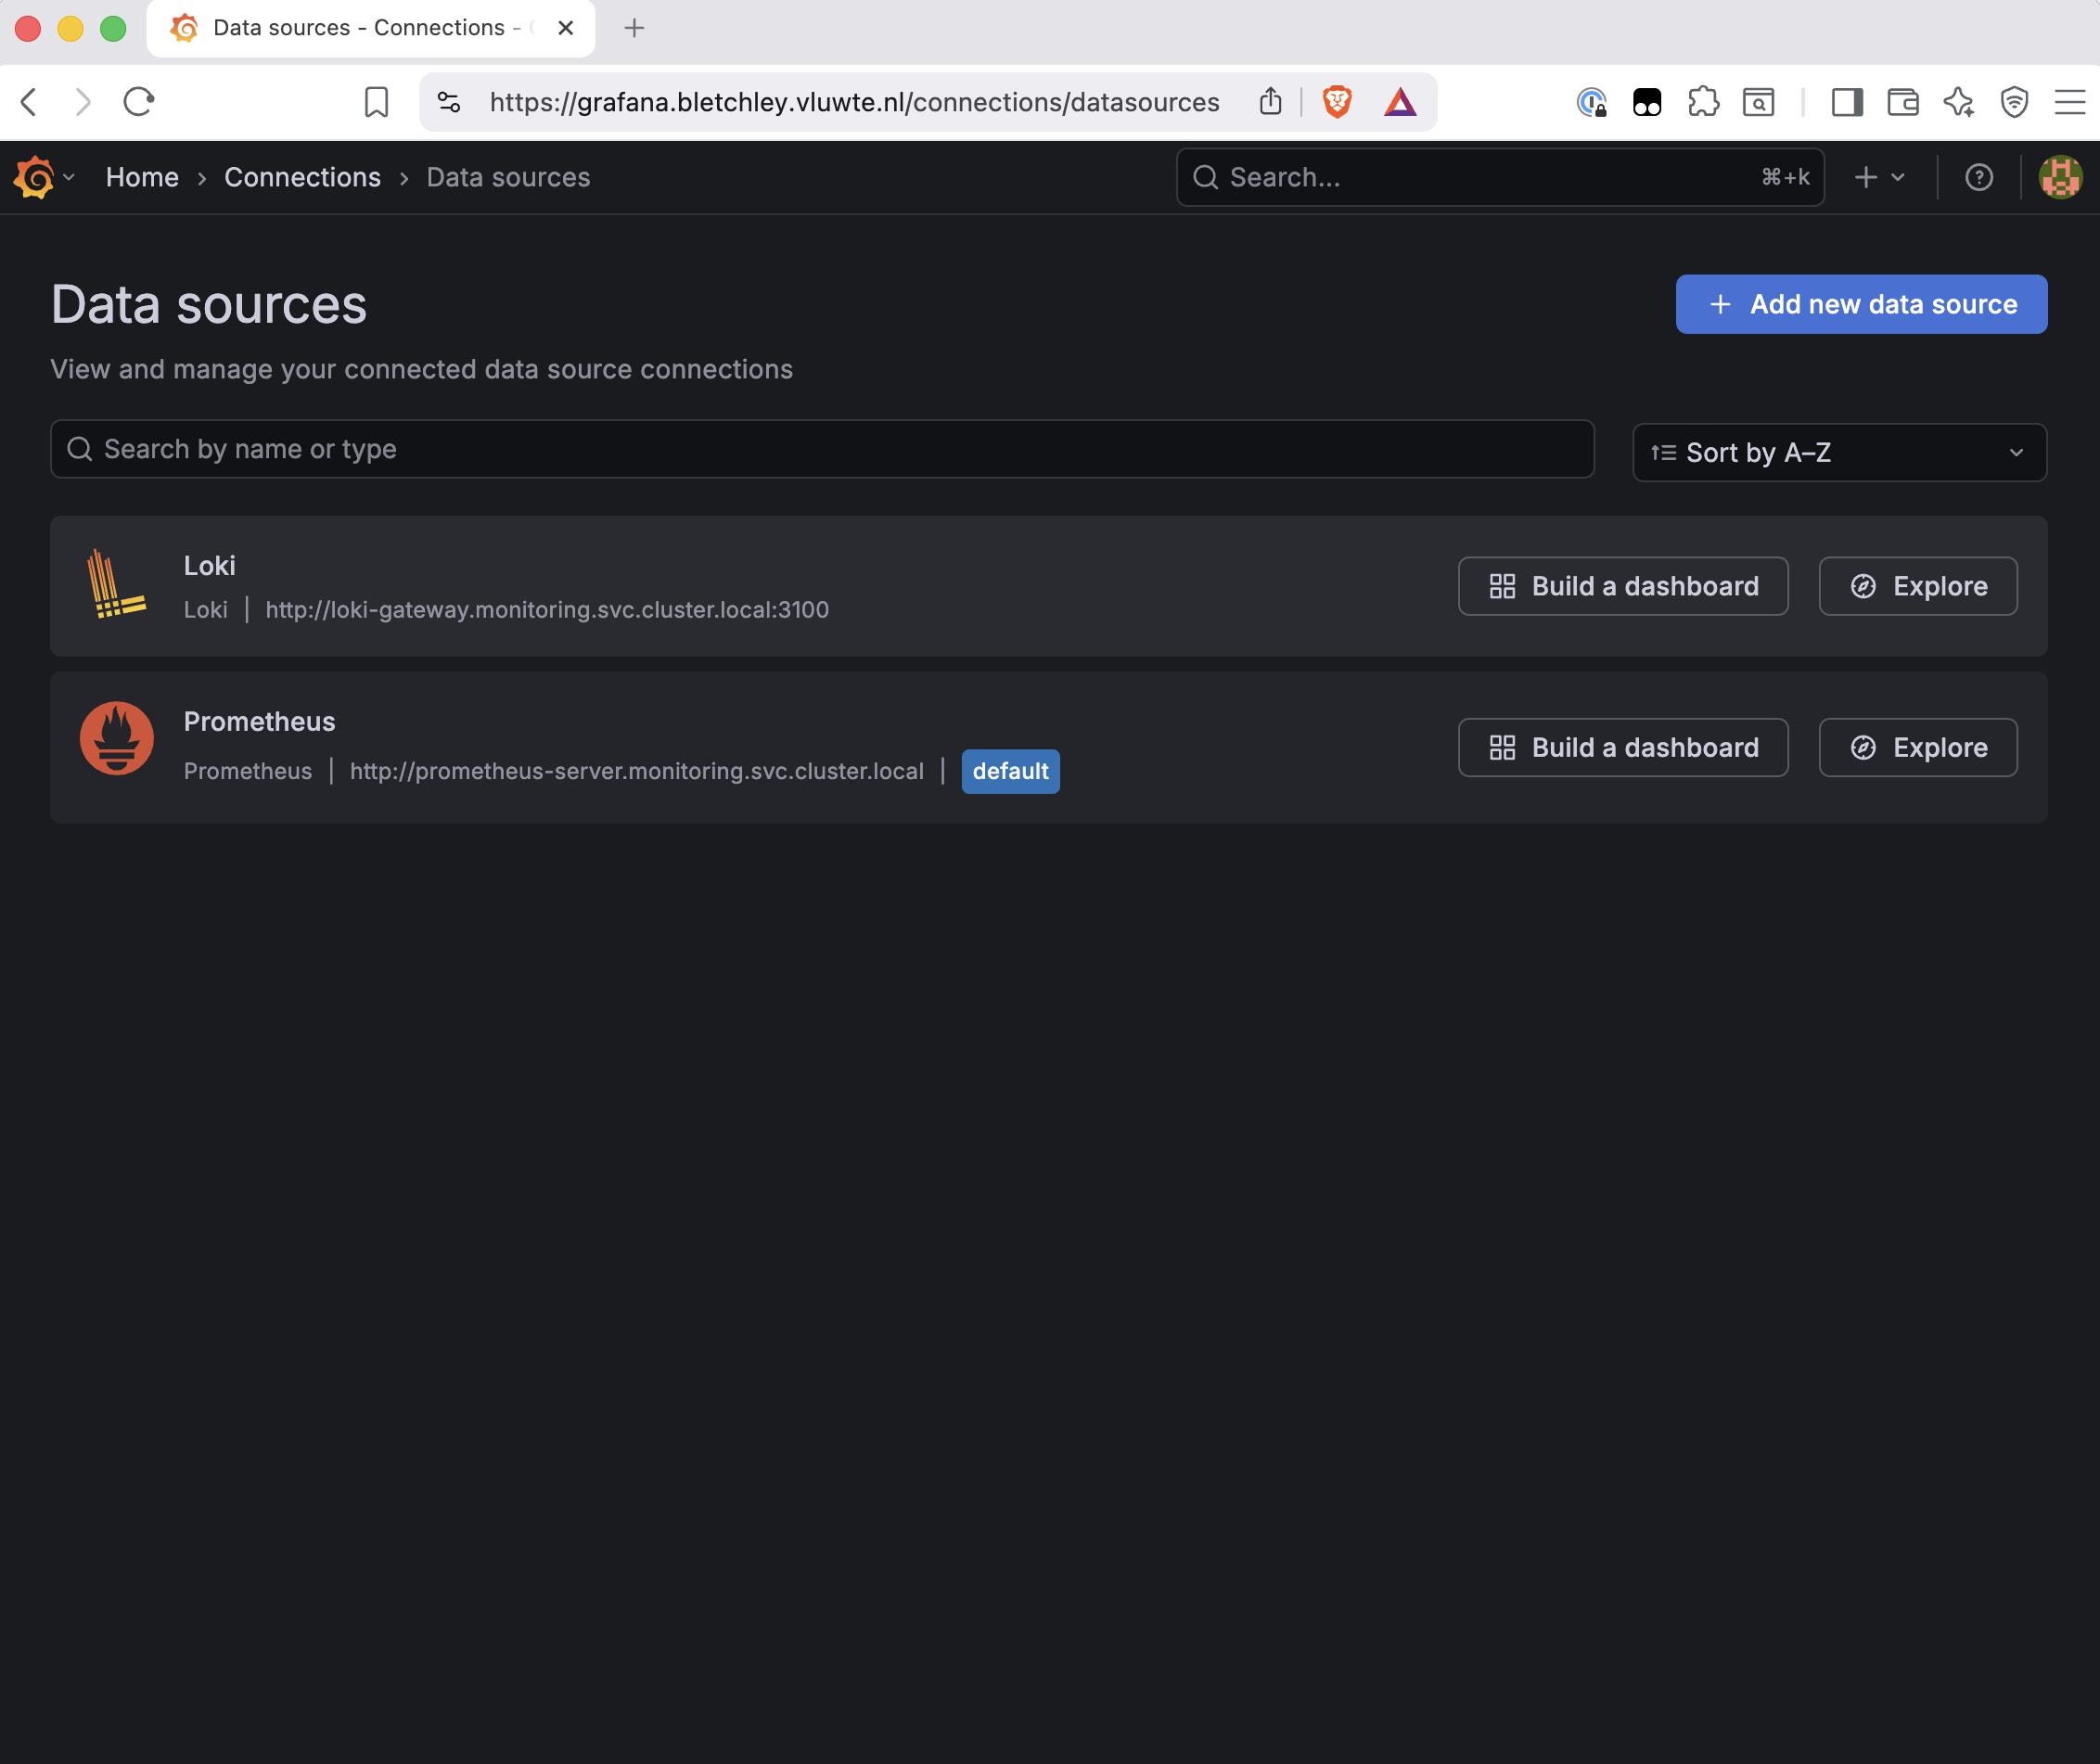
Once restarted, the Loki datasource appears in Grafana under Connections → Data Sources:
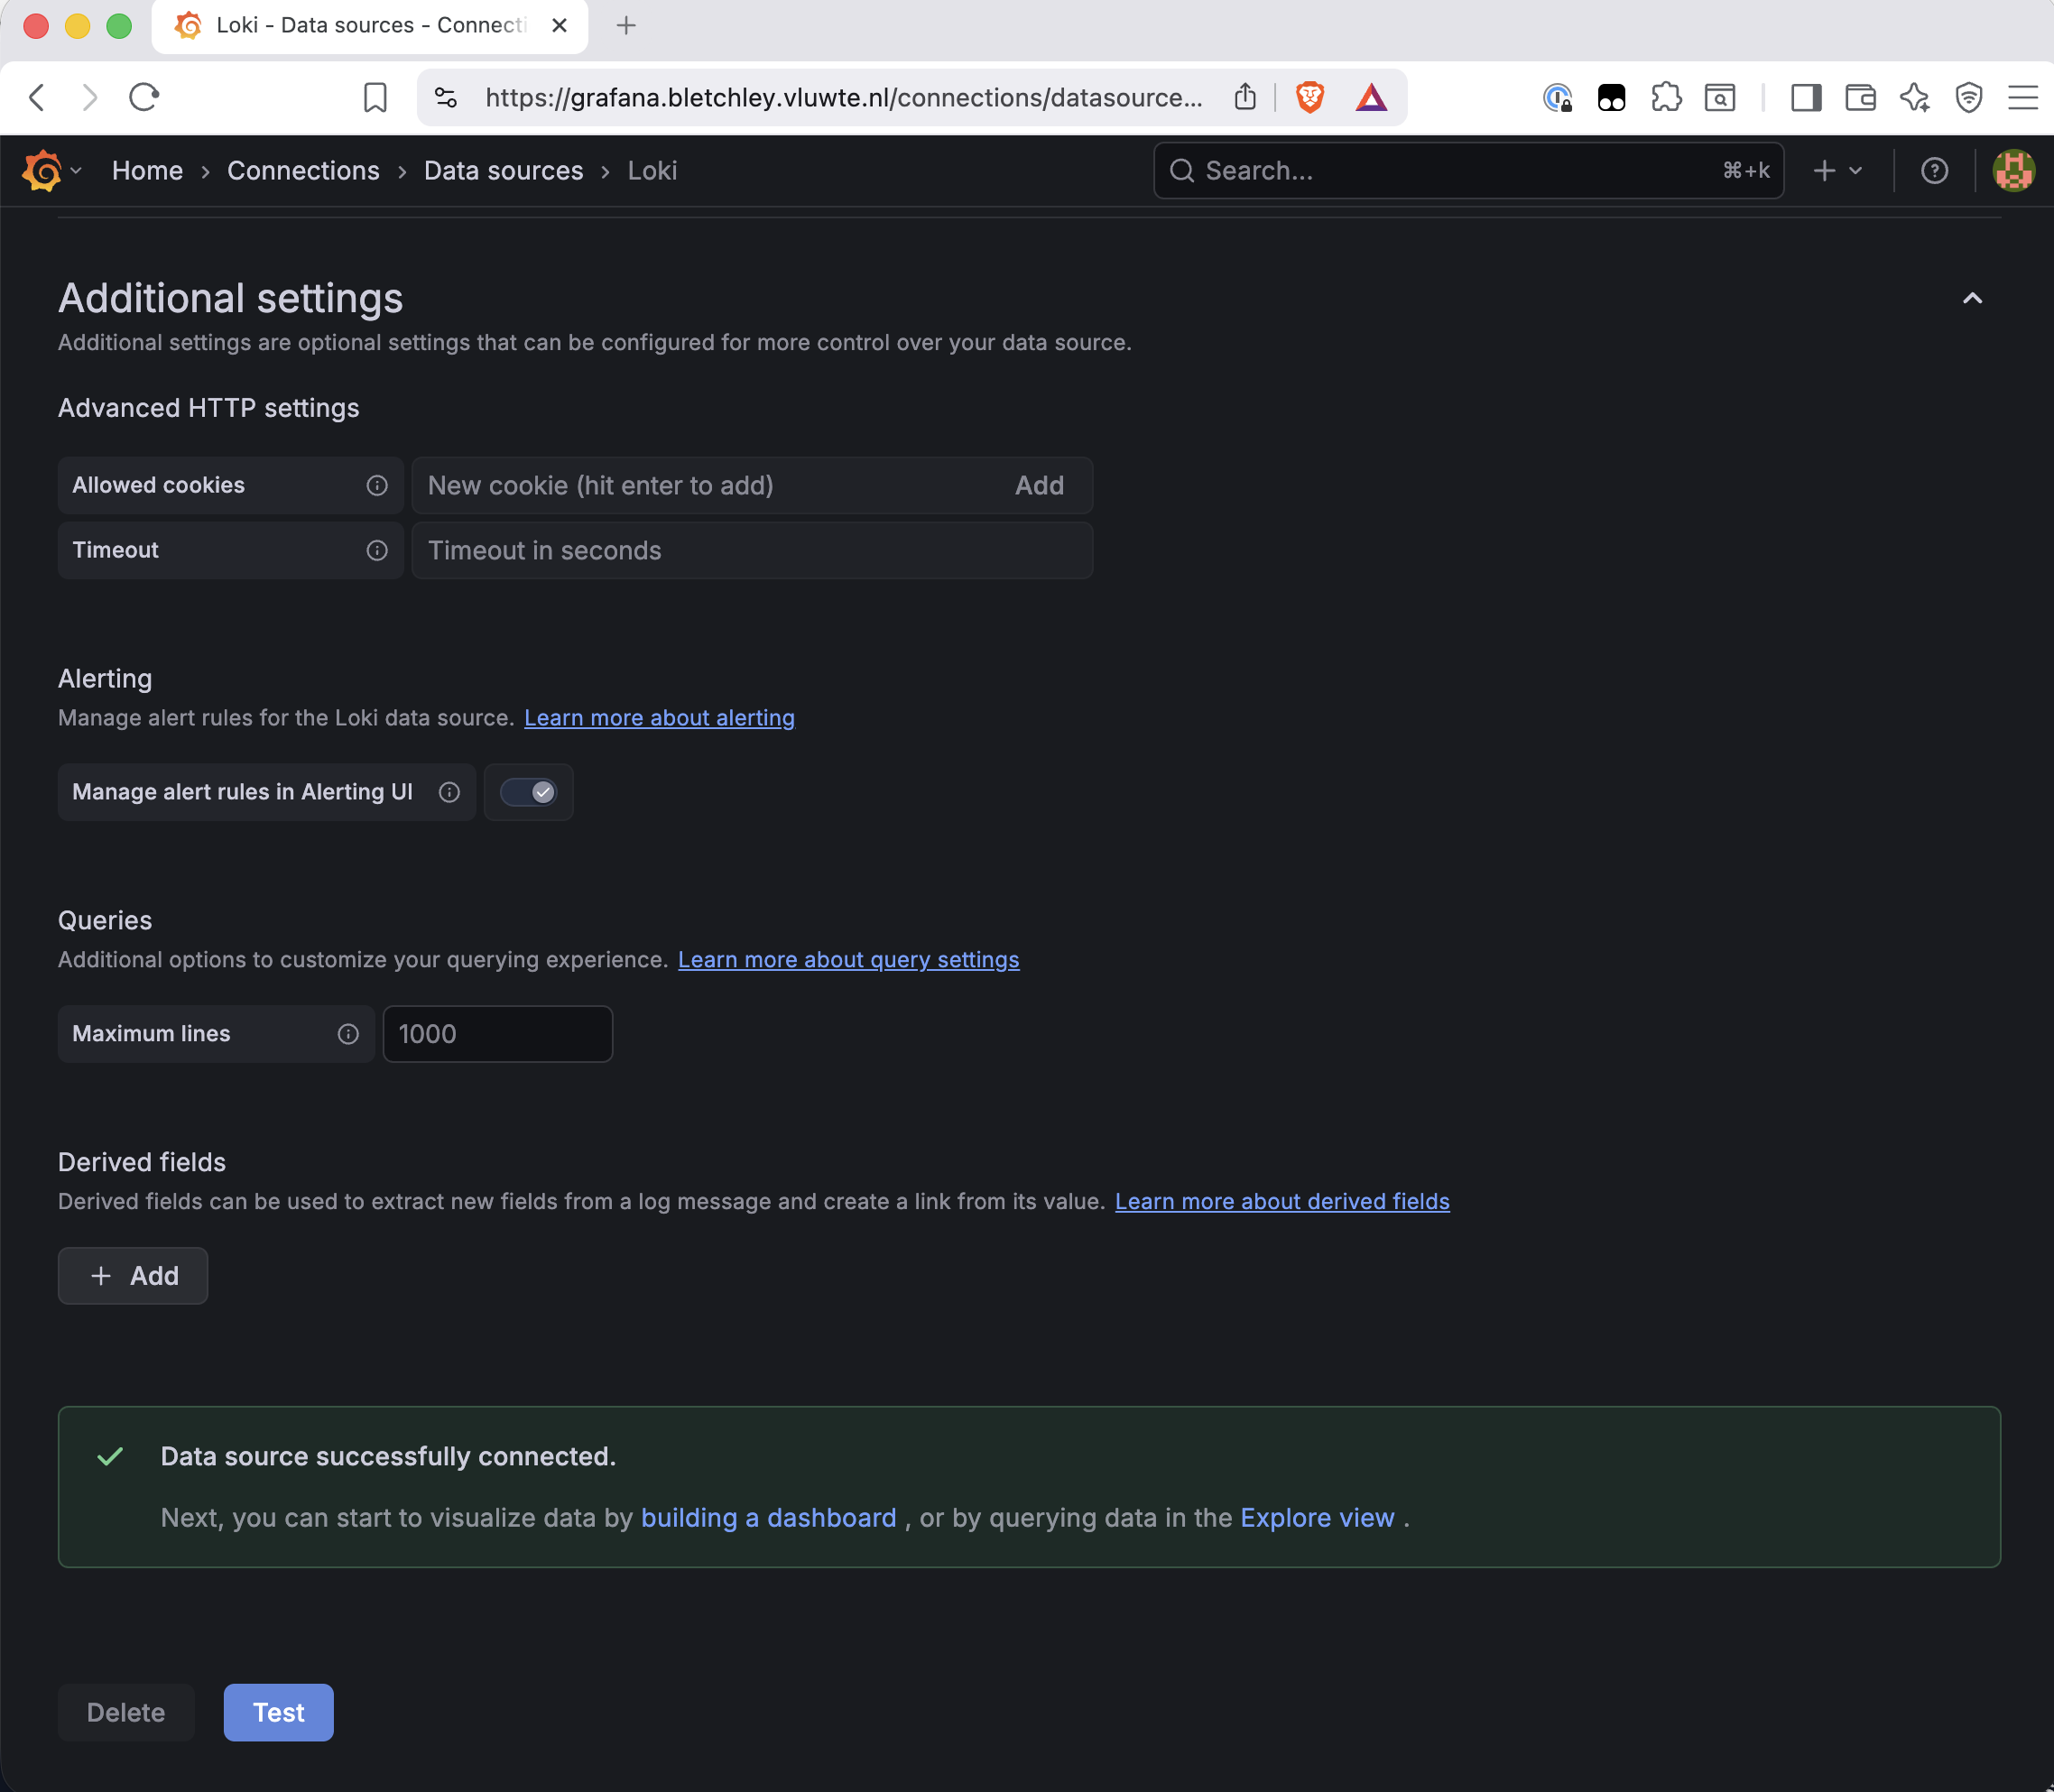
The datasource test confirms connectivity:
Querying Logs in Grafana Explore
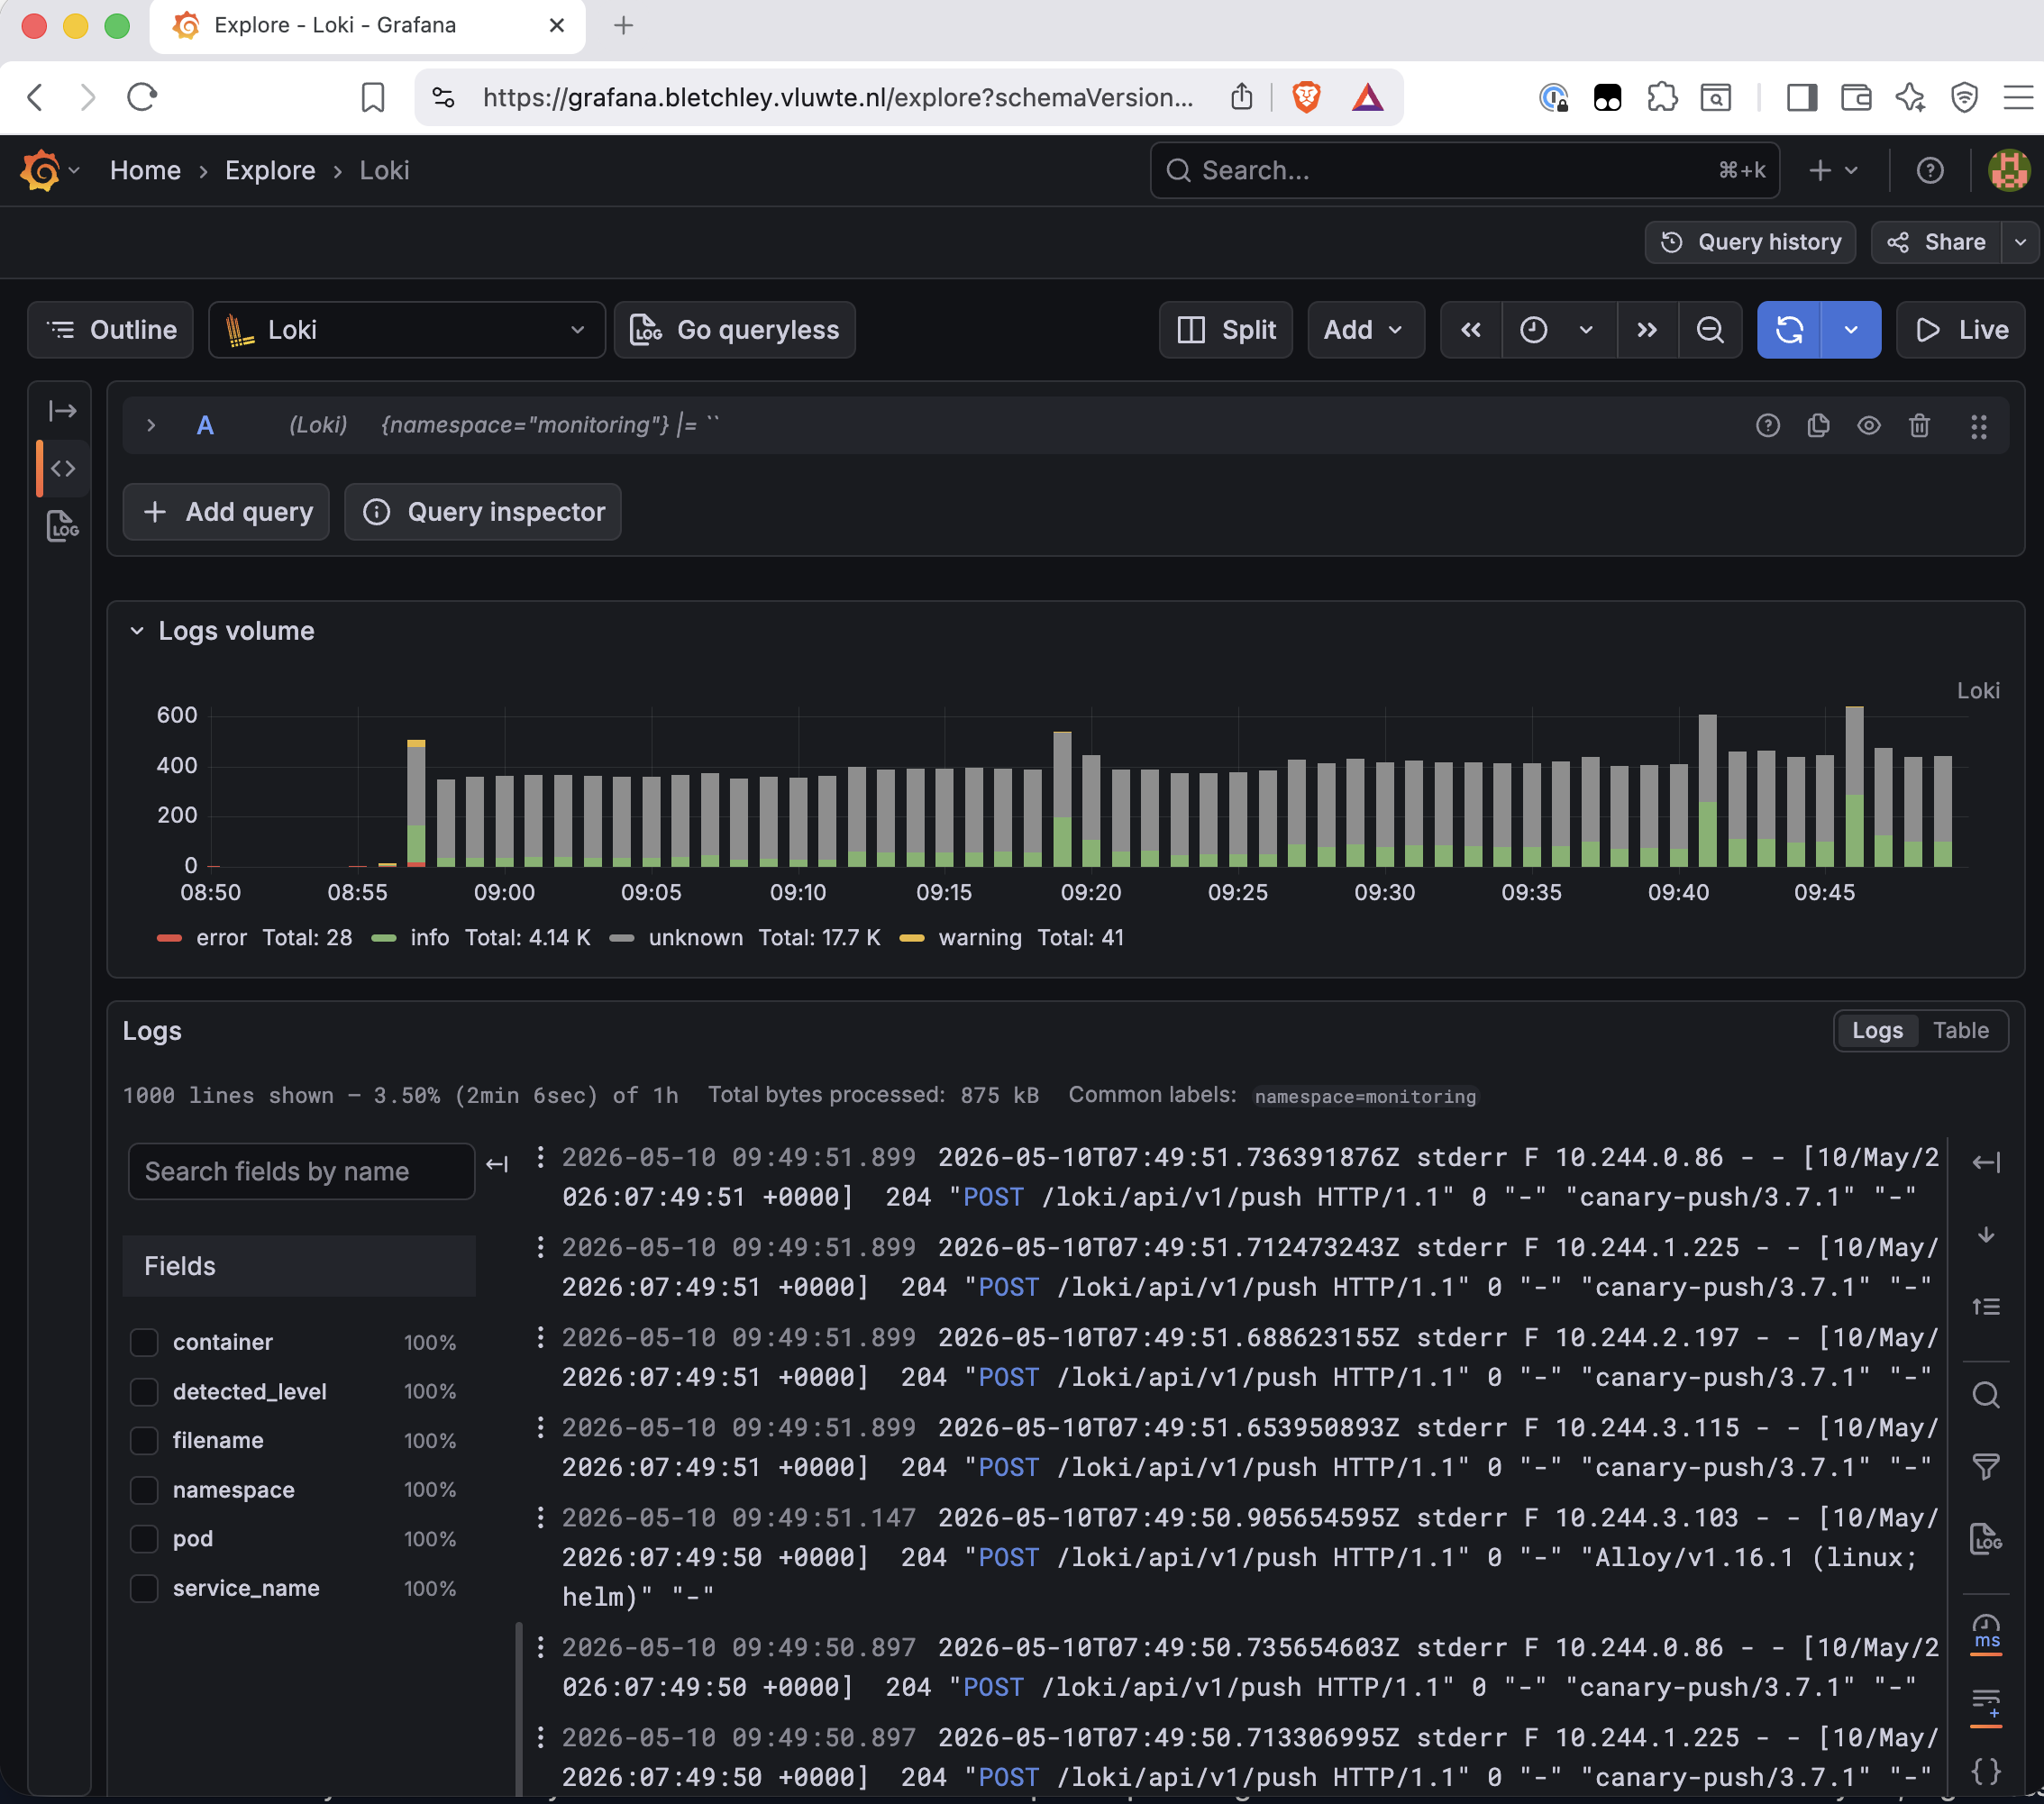
With the datasource connected, Grafana Explore becomes a window into the cluster's log history. The monitoring namespace immediately shows the Loki stack's own logs:
A query across all namespaces for errors, filtering out pipeline noise:
{namespace=~".+"} |= "error" | __error__=""
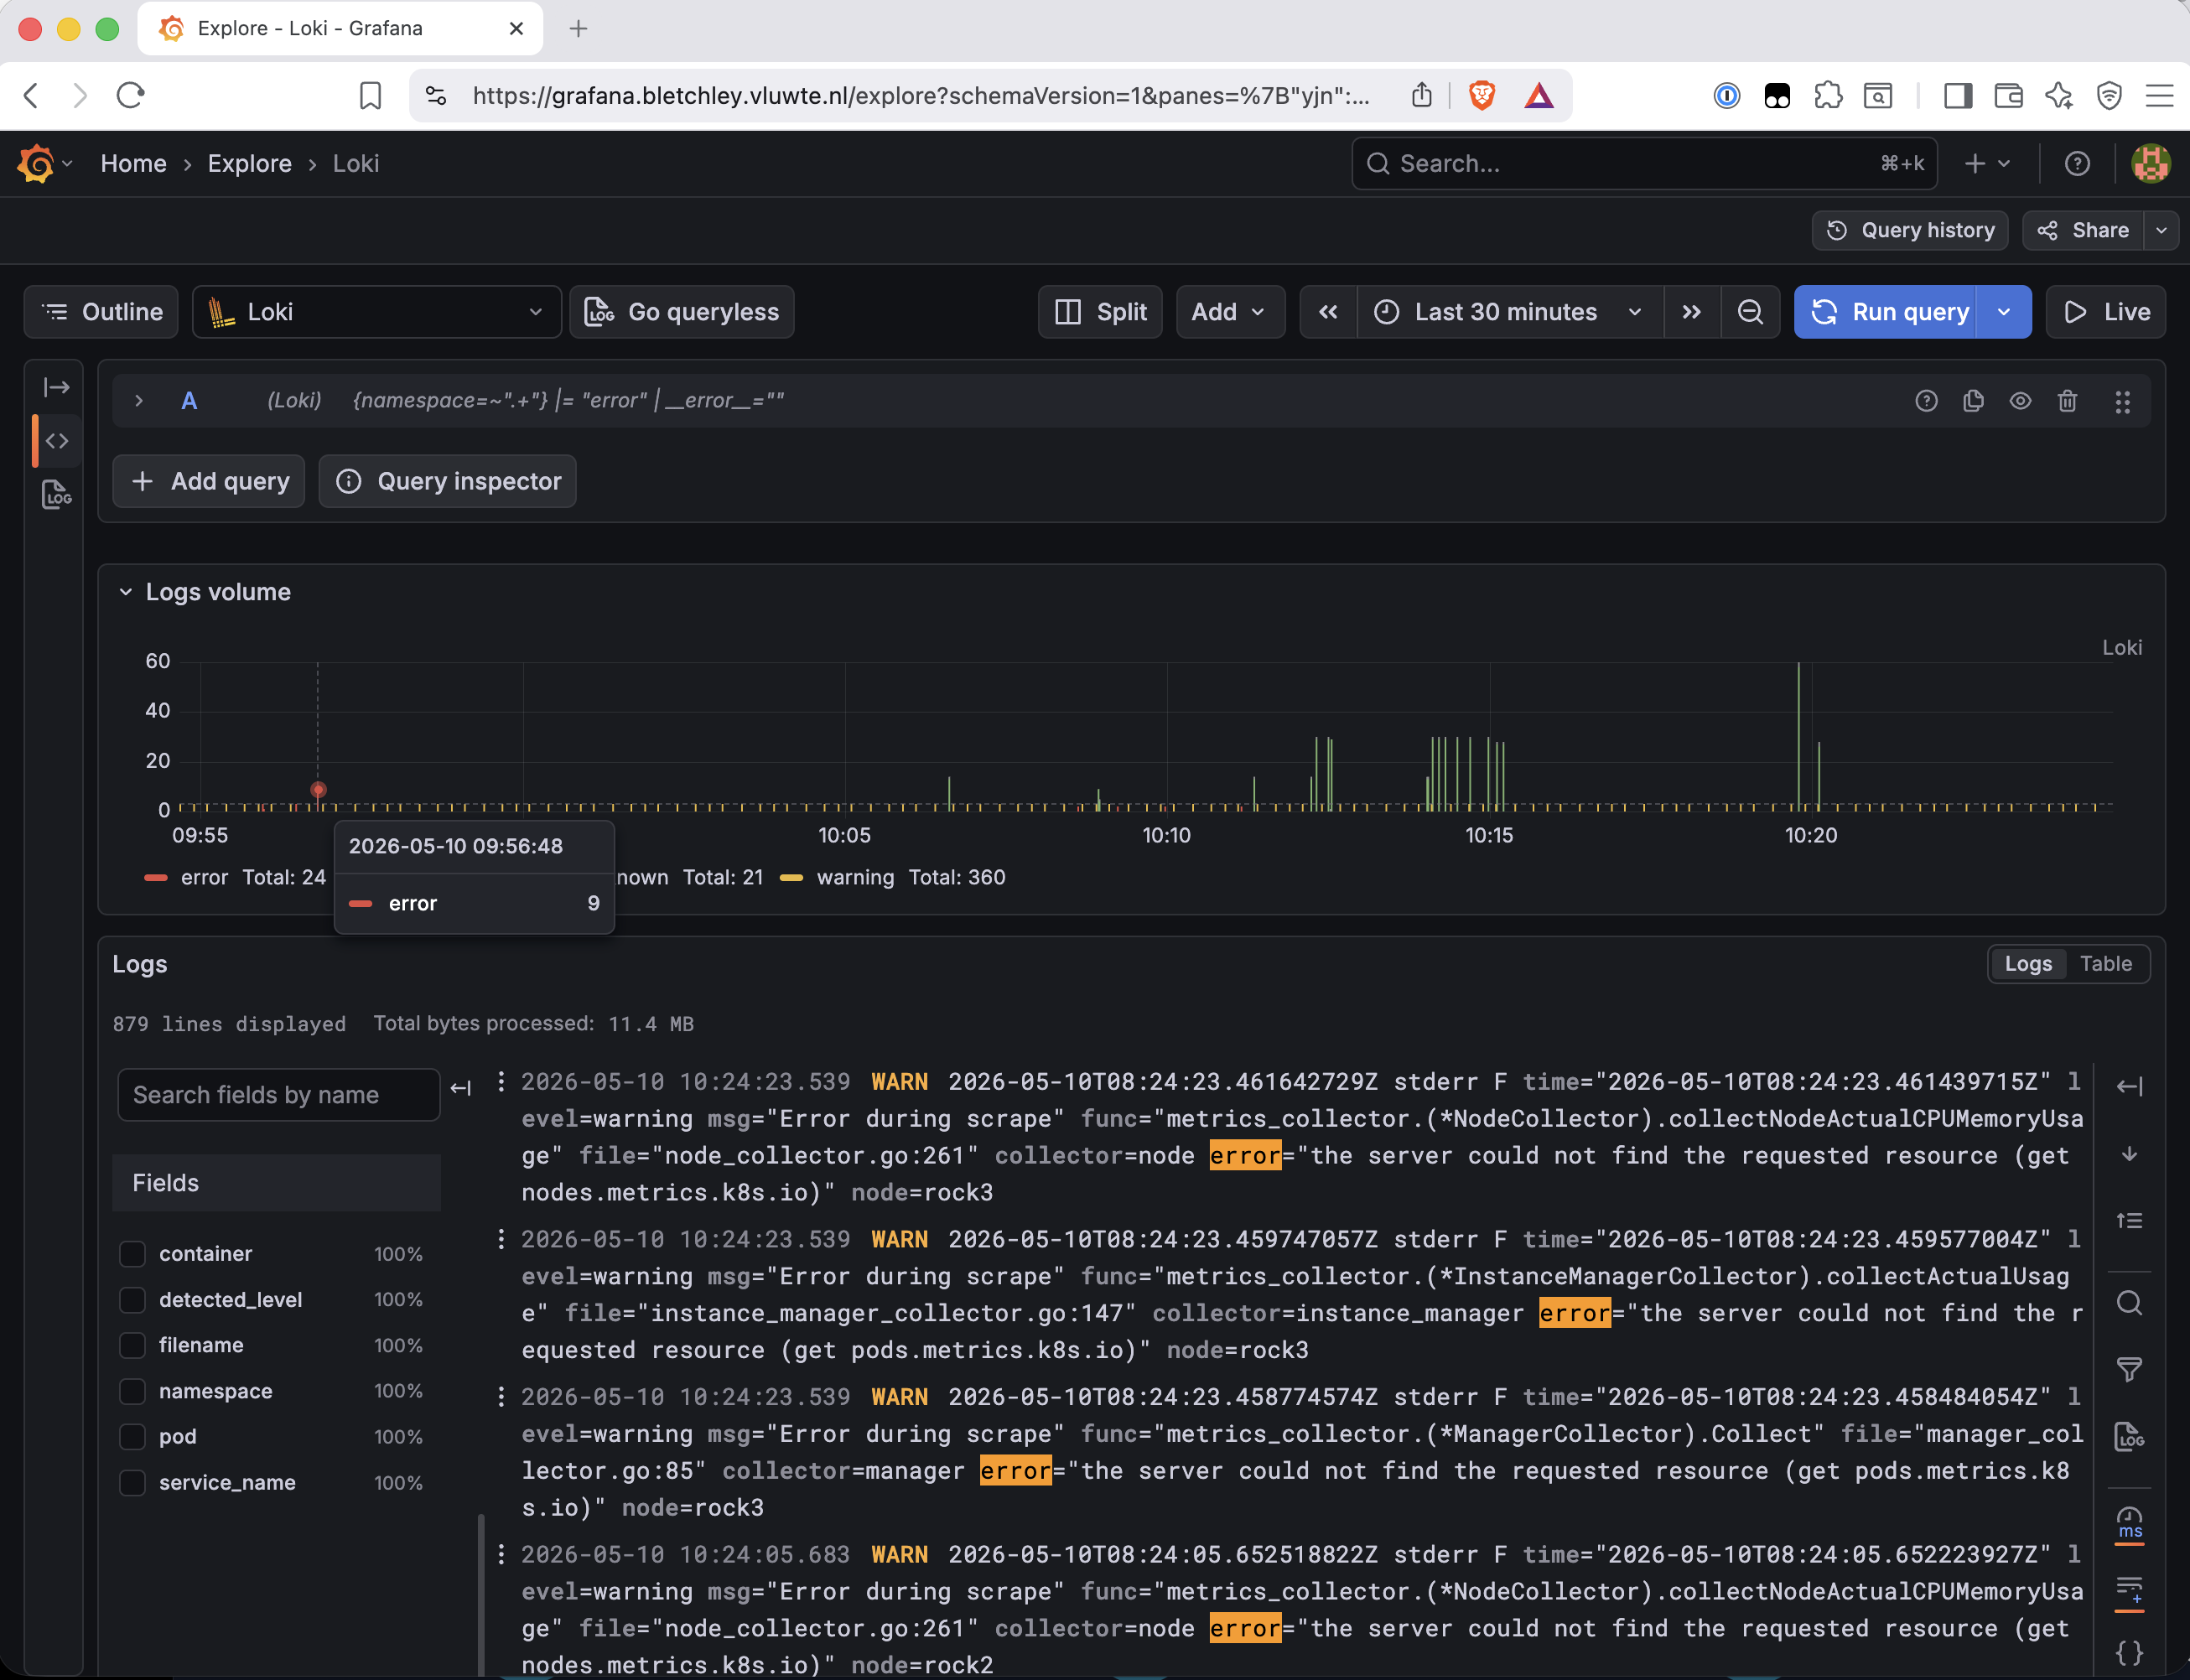
The fields panel on the left shows namespace, pod, container, and node at 100% — the label set is consistent across the cluster, which makes filtering and correlation straightforward.
What's Working Now
- ✅ Loki running in monolithic mode on a 20 Gi Longhorn PVC with 30-day retention
- ✅ Loki canary deployed and confirming end-to-end pipeline health (write → read)
- ✅ Alloy DaemonSet running on all 4 nodes, collecting container logs from
/var/log/pods/ - ✅ Control plane component logs (kube-apiserver, etcd, scheduler) visible — collected as static pod logs as per Talos
- ✅ Loki datasource added to Grafana, test green, LogQL queries returning results
- ✅ Backup controller managing Loki PVC —
RecurringJob backup-monitoring-lokiactive - ⚠️ Known limitation: Talos system logs (machined, kubelet, containerd) not yet collected —
loki.source.tcpdoes not exist in Alloy v1.16.1; requires a Vector intermediary, deferred to the next post - ⚠️ Known limitation: Log-based alerting not yet configured — deferred to a follow-up post
Lessons Learned
- Read the architecture before writing config — the Loki chart deploys an nginx gateway in front of the Loki binary. Every URL reference — in Alloy, in Grafana, in the Helm notes — needs to point at the gateway service, not the direct Loki port. One wrong assumption propagated into three separate connection failures.
deploymentMode: Monolithicis not enough on its own — you also needbackend/read/write: replicas: 0and both caches disabled. The chart's defaults assume a larger deployment than a 4-node homelab cluster, and without explicitly zeroing out the other components, you'll fight validation errors and OOM pod scheduling.- Rule order in Alloy River matters and the errors are silent — the
labeldroprule that removes__meta_*labels must come after the path building rule, not before. Get it wrong and targets silently produce no output. The same goes for thelocal.file_matchstage betweendiscovery.relabelandloki.source.file— without it, glob paths are accepted but never expanded. loki.source.tcpdoesn't exist — it's not missing from the docs, it simply isn't implemented in Alloy v1.16.1. The Talos system log collection path needs rethinking. Vector as an intermediary is the likely direction.- Grafana datasource changes require a pod restart —
helm upgradeupdates the ConfigMap but Grafana doesn't pick it up until the pod restarts.kubectl rollout restart deployment grafana -n monitoringis the required extra step. - The PVC size and
whenDeletedpolicy need to be right before first deploy — the PVC is created on first install and changes to size require either a manual PVC expansion or a full reinstall. SettingwhenDeleted: Retainfrom the start prevents the PVC from being silently deleted onhelm uninstall, which is especially important if you're doing a clean reinstall.
What's Next
The observability series continues:
- Part 8 will cover Talos system logs — why
loki.source.tcpdoesn't work, what Vector provides as an intermediary, and how to get machined, kubelet, and containerd logs flowing into Loki. - Part 9 will cover LogQL in practice: useful queries, the Authelia crash reconstruction from this deployment, and log-based alerting through the existing Alertmanager.
← Previous: PostgreSQL Backups
Questions or suggestions? Leave a comment below or reach out at igor@vluwte.nl.