Cluster Observability Part 8: Talos System Logs
Talos system logs via Vector: why loki.source.tcp doesn't exist, how Vector fills the gap, and fixing Alloy's node-local filter in the same pass.
Introduction
Part 7 got Loki and Grafana Alloy running. Container logs from all namespaces flow into Loki and are queryable in Grafana — Kubernetes workloads, static pod control plane components, everything running as a container. One category was left out: Talos system logs.
Talos stores logs from machined, kubelet, containerd, and other system services in an in-memory circular buffer. They are not written to disk. There is no file path to tail. The primary supported way to access them is via talosctl logs <service> in real time, or by configuring Talos to push them over TCP to an external listener. Without a persistent capture in place, any system-level event that happened before the last talosctl logs command is simply gone.
Part 7 planned to use loki.source.tcp in Alloy to receive Talos's raw TCP stream directly. That component does not exist. This post documents the detour that followed: what failed, why, and how Vector ended up filling the gap. Along the way, the Alloy node-local filtering problem left over from Part 7 also gets fixed — both configs are touched in this post anyway, so it makes sense to close both issues together.
This post is part of the Observability sub-series.
- Part 1: Prometheus and Node Exporter
- Part 2: Grafana Dashboards
- Part 3: MetalLB, Traefik and Ingress
- Part 4: Alerting with Alertmanager
- Part 5: Hardware Health Collectors
- Part 6: Hardware Health Dashboards and Alerts
- Part 7: Log Aggregation with Loki and Grafana Alloy
- Cluster Observability Part 8: Talos System Logs (you are here)
Why Talos system logs are different
On a standard Linux system, systemd writes service logs to journald. You can read them with journalctl, tail a file, or point a log shipper at /var/log/journal/. Talos does not have systemd. It does not have journald. System service logs go into an in-memory ring buffer managed by machined.
Talos primarily exposes that buffer through two mechanisms. The first is talosctl logs machined — an ad hoc command that shows what's in the buffer right now. The second is machine.logging.destinations in the Talos machine config — a push configuration that tells Talos to stream logs over TCP (or UDP) to a specified endpoint as they arrive. Once you configure a destination, logs flow continuously from that point forward. Everything before the configuration was applied is gone.
Kernel logs work the same way but are configured separately. The talos.logging.kernel kernel argument tells Talos where to push kernel messages, and that argument only takes effect at boot — so a node reboot is required to activate kernel log forwarding.
This push model is non-obvious if you're used to pull-based log collection. There is no file to discover, no socket to read, no sidecar that can scrape the buffer. Talos has to send the logs to you.
The dead end: loki.source.tcp
The Part 7 plan assumed that Alloy had a loki.source.tcp component. The idea was straightforward: configure Talos to push json_lines over TCP, configure Alloy to receive them on that port, and pass them straight to Loki. No intermediary, no extra component.
What Alloy v1.16.1 actually returned when that config was applied:
Error: /etc/alloy/config.alloy:76:1: cannot find the definition of component name "loki.source.tcp"
The component doesn't exist. Alloy v1.16.1 does have loki.source.syslog, which accepts TCP connections — but it expects RFC5424 or RFC3164 syslog format. Talos sends raw json_lines. Without an additional translation layer, loki.source.syslog cannot consume Talos’s json_lines format.
At the time of writing, Alloy lacks a native raw TCP Loki source for Talos-style json_lines. A different tool is needed.
The solution: Vector as the intermediary
Vector is a purpose-built observability data pipeline. Its socket source accepts arbitrary TCP input with configurable decoding — json codec handles Talos's json_lines format natively. Its remap transform uses VRL (Vector Remap Language) for field extraction and reshaping. Its loki sink pushes to Loki's push API in the format Loki expects.
OpenTelemetry Collector could also fill this role, but Vector's native socket source with json decoding and VRL transforms made the Talos json_lines pipeline more straightforward to implement.
The topology is simple. Vector runs as a DaemonSet — one pod per node — with hostNetwork: true so it can listen on the node's network interfaces directly. Talos on each node pushes its logs to the Vector pod running on that same node. Vector parses the JSON, extracts labels, and forwards to Loki. Each log entry arrives in Loki with the correct node attribution.
dnsPolicy: ClusterFirstWithHostNet is required alongside hostNetwork: true. Without it, pods running in host network mode lose access to in-cluster DNS, which means the Loki gateway URL won't resolve.
ARM64 support was the first thing to verify before writing any config — the hard lesson from earlier posts in this series. Vector publishes a multi-arch manifest; ARM64 is covered. Helm chart version 0.52.0 ships Vector app version 0.55.0 — the chart and app versions are decoupled, which is easy to miss.
Fixing the Alloy node-local filter (bonus)
Before deploying Vector, there's a Part 7 loose end worth closing. Alloy's discovery.kubernetes discovers all pods across the entire cluster on every DaemonSet pod. But each Alloy pod can only access /var/log/pods/ on its own node — log files for pods scheduled elsewhere don't exist locally. The result is a steady stream of "failed to tail" errors in the Alloy logs. Operationally harmless, but noisy, and it means each pod is attempting to open hundreds of paths that don't exist.
The fix is a keep rule in discovery.relabel that filters targets to only the pods scheduled on the same node as the Alloy pod. Simple in principle; getting the label name and env var right took three attempts.
First attempt — the planning file used NODE_NAME as the env var name, injected via controller.env. The values file injected K8S_NODE_NAME. In Alloy River, env("NODE_NAME") returns an empty string when the variable isn't set. An empty string regex matches everything, so the keep rule silently passed all targets. No errors, no filtering — the logs appeared to work while duplication was happening across all pods.
Second attempt — the planning file used __meta_kubernetes_node_name as the source label. The correct label exposed by discovery.kubernetes for the pod's node is __meta_kubernetes_pod_node_name. Using the wrong label causes the keep rule to match nothing — output: [] in the Alloy UI with no error message.
Third attempt — both issues identified via the Alloy component graph. kubectl port-forward -n monitoring <alloy-pod> 12345:12345 exposes the Alloy UI, which shows the actual targets and their labels. The targets JSON from discovery.relabel.pod_logs showed __meta_kubernetes_pod_node_name as the correct label. The correct env var turned out to be HOSTNAME, which Kubernetes sets automatically on every pod to the pod name — in this DaemonSet deployment on Talos, the pod hostname matched the node name. No explicit injection needed.
The working keep rule:
rule {
  source_labels = ["__meta_kubernetes_pod_node_name"]
  regex         = env("HOSTNAME")
  action        = "keep"
}
This rule must be the first rule in discovery.relabel. If placed after labeldrop, __meta_kubernetes_pod_node_name has already been removed and the rule silently matches nothing. If placed after the path-building rule, paths are built for all pods on all nodes before the filter runs.
The complete updated config.alloy:
// apps/monitoring/alloy/config.alloy
// ============================================================
// Destination — Loki
// ============================================================
loki.write "default" {
  endpoint {
    url = "http://loki-gateway.monitoring.svc.cluster.local/loki/api/v1/push"
  }
}

// ============================================================
// Source — Container / pod logs from /var/log/pods/
// ============================================================
discovery.kubernetes "pods" {
  role = "pod"
}

discovery.relabel "pod_logs" {
  targets = discovery.kubernetes.pods.targets

  // Keep only pods scheduled on this node — prevents cross-node "no such file" errors
  // Kubernetes automatically sets HOSTNAME inside the pod.
  // In this DaemonSet deployment on Talos, the pod hostname matched the node name,
  // so no explicit env injection was required.
  rule {
    source_labels = ["__meta_kubernetes_pod_node_name"]
    regex         = env("HOSTNAME")
    action        = "keep"
  }

  rule {
    source_labels = ["__meta_kubernetes_pod_uid", "__meta_kubernetes_pod_container_name"]
    separator     = ";"
    regex         = "(.+);(.+)"
    target_label  = "__path__"
    replacement   = "/var/log/pods/*$1*/$2/*.log"
  }

  rule {
    source_labels = ["__meta_kubernetes_namespace"]
    target_label  = "namespace"
  }
  rule {
    source_labels = ["__meta_kubernetes_pod_name"]
    target_label  = "pod"
  }
  rule {
    source_labels = ["__meta_kubernetes_pod_container_name"]
    target_label  = "container"
  }
  rule {
    source_labels = ["__meta_kubernetes_pod_node_name"]
    target_label  = "node"
  }

  rule {
    regex  = "__meta_.*"
    action = "labeldrop"
  }
}

local.file_match "pod_logs" {
  path_targets = discovery.relabel.pod_logs.output
  sync_period  = "5s"
}

loki.source.file "pod_logs" {
  targets    = local.file_match.pod_logs.targets
  forward_to = [loki.write.default.receiver]
}
The updated values.yaml removes the dead extraPorts entry for port 3101 that was added during Part 7 for the loki.source.tcp approach that turned out not to exist:
# apps/monitoring/alloy/values.yaml
controller:
  type: daemonset
  tolerations:
    - operator: Exists
  volumes:
    extra:
      - name: run-containerd
        hostPath:
          path: /run/containerd

alloy:
  mounts:
    varlog: true
    extra:
      - name: run-containerd
        mountPath: /run/containerd
        readOnly: true

  # extraPorts for talos-logs removed — Vector handles TCP reception on port 6051
  configMap:
    create: true
    content: ""

  resources:
    requests:
      cpu: 100m
      memory: 256Mi
    limits:
      cpu: 250m
      memory: 512Mi

rbac:
  create: true

service:
  enabled: true
  type: ClusterIP
Verify the filter is working after the upgrade:
kubectl logs -n monitoring -l app.kubernetes.io/name=alloy --prefix=true | grep -i "failed to tail"
# Should return nothing
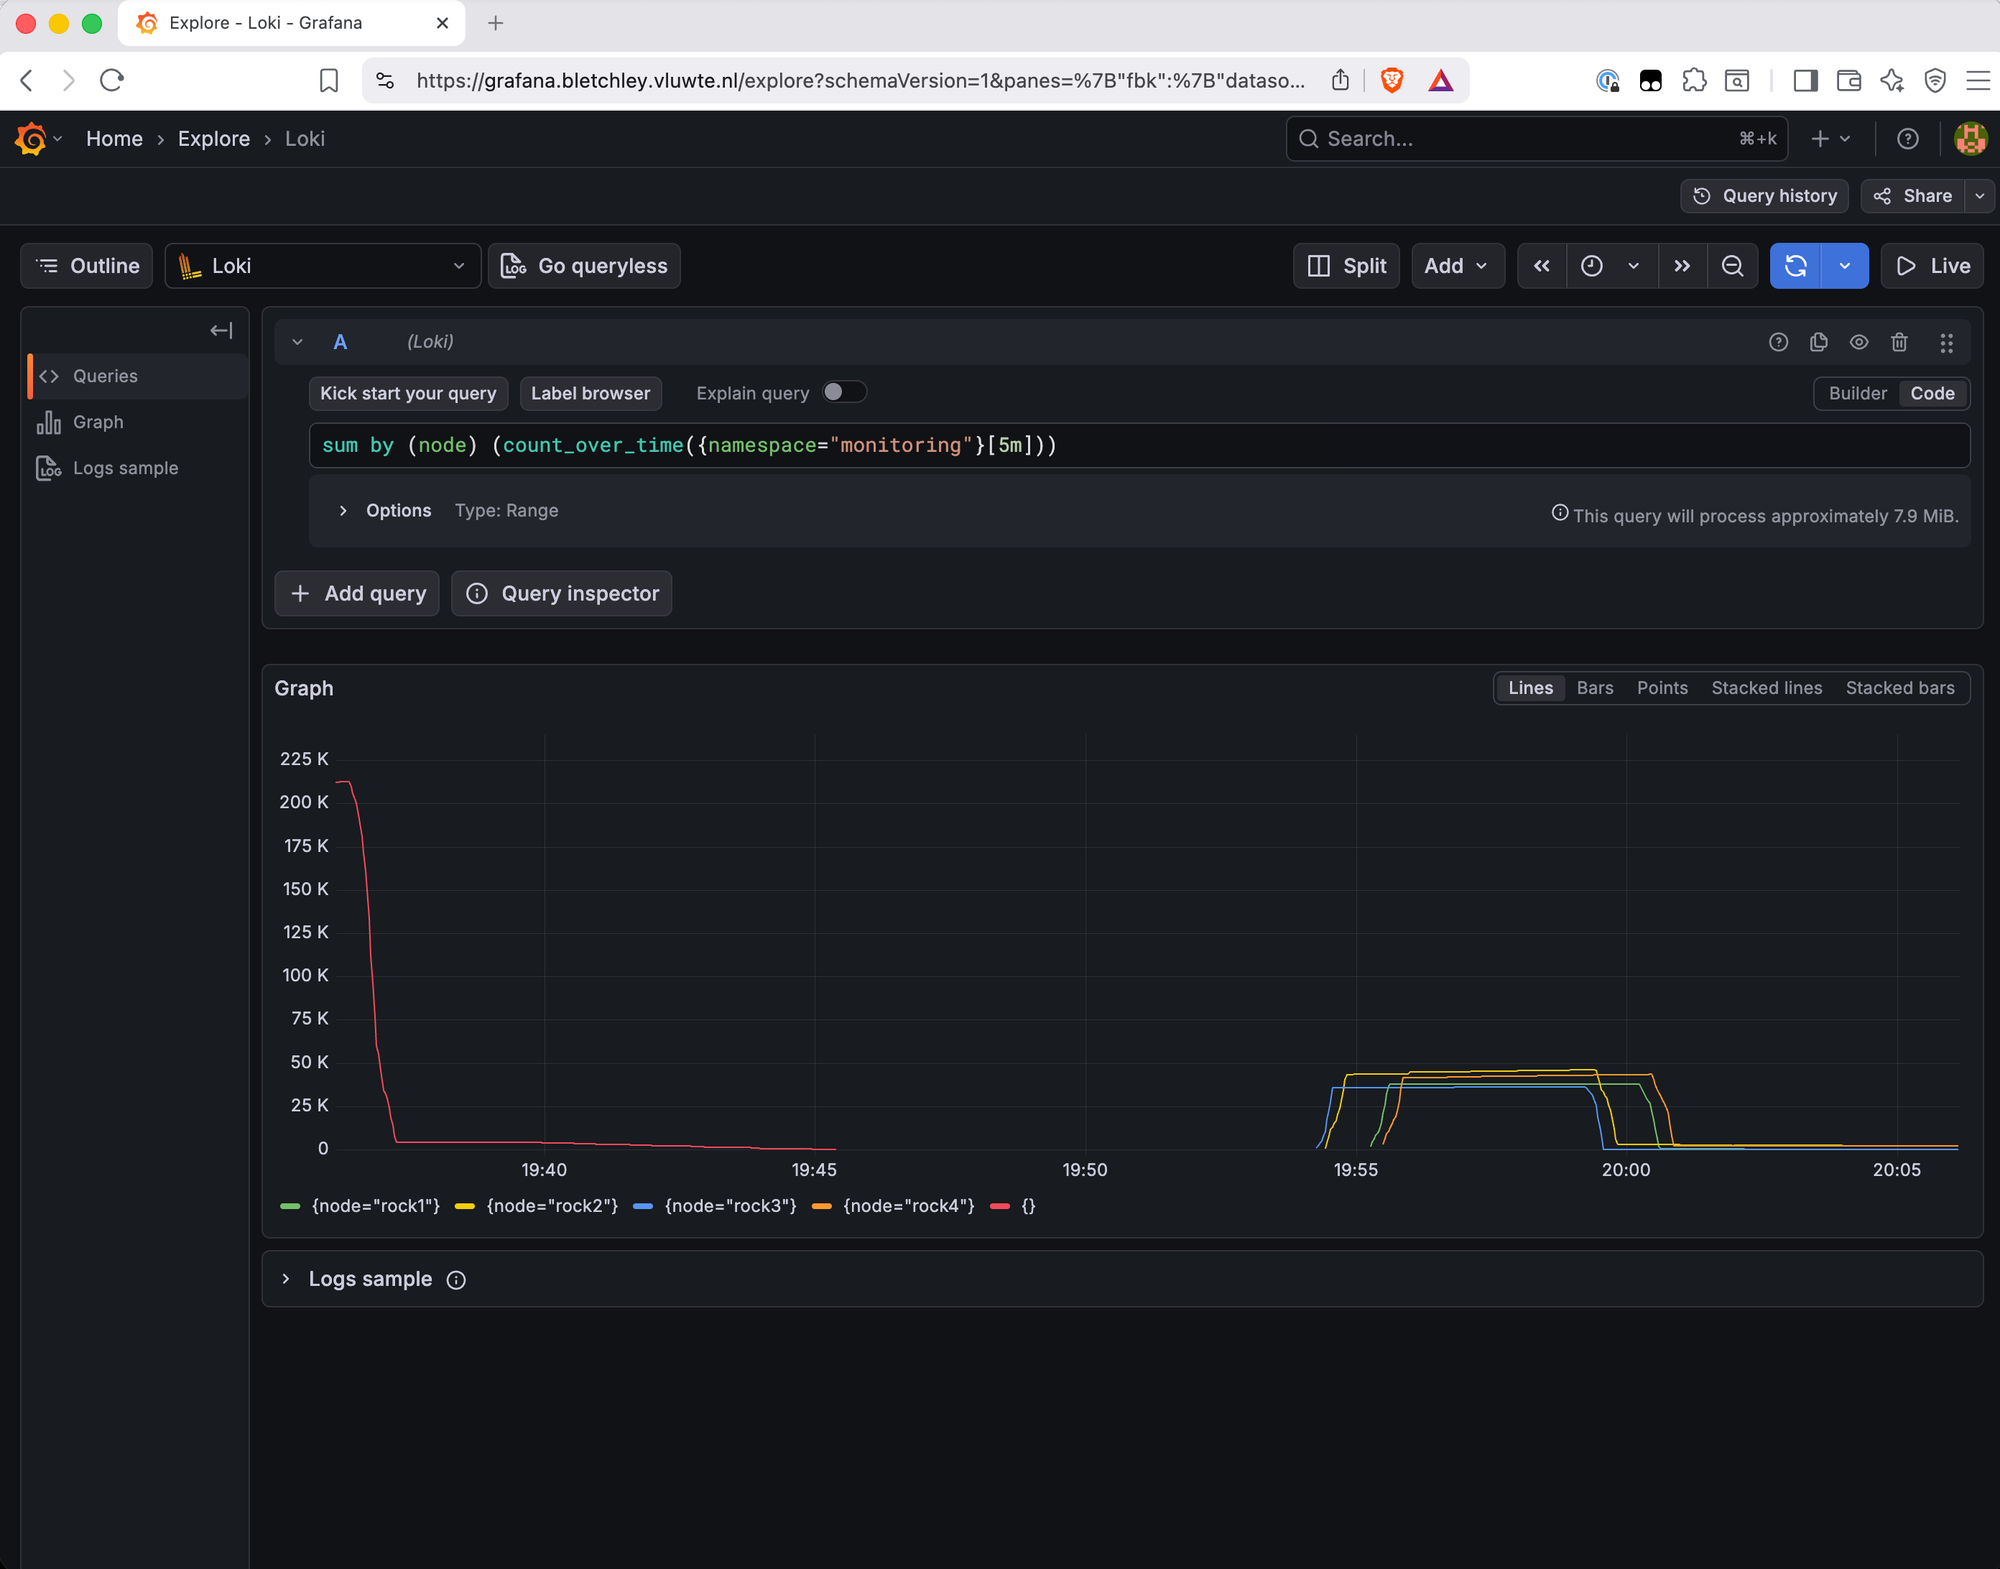
The effect is clearly visible in Grafana. Before the fix, all four Alloy pods were trying to tail all pods cluster-wide, causing log duplication and the "failed to tail" errors. After the fix, four separate steady lines — one per node, each collecting only its own logs.
The Vector config
With Alloy updated, the next step is deploying Vector. All configuration lives in values.yaml — the Vector Helm chart does not support --set-file for customConfig. It tries to iterate over the config as a structured object and fails with a template error. Everything must be inlined under customConfig:.
One other gotcha: Vector's label templates use {{ field }} syntax, which conflicts with Helm's Go template engine. Helm processes values.yaml before Vector sees it and throws "function not defined" errors for every Vector field reference. The fix is Go raw string escaping: "{{ {{ service }} }}".
The final values.yaml with the full Vector config inlined:
# apps/monitoring/vector/values.yaml
role: Agent  # DaemonSet mode

podHostNetwork: true
dnsPolicy: ClusterFirstWithHostNet

customConfig:
  data_dir: /vector-data-dir

  api:
    enabled: false

  sources:
    talos_service_logs:
      type: socket
      address: 0.0.0.0:6051
      mode: tcp
      decoding:
        codec: json
      host_key: __host

  transforms:
    talos_service_logs_xform:
      type: remap
      inputs: [talos_service_logs]
      source: |
        parsed_timestamp, err = parse_timestamp(."talos-time", format: "%Y-%m-%dT%H:%M:%S.%fZ")
        if err == null {
          .timestamp = to_unix_timestamp(parsed_timestamp)
        } else {
          .timestamp = to_unix_timestamp(now())
        }
        .message = parse_json(.msg) ?? .msg
        .level = ."talos-level"
        .service = ."talos-service"
        del(.msg)
        del(."talos-time")
        del(."talos-level")
        del(."talos-service")

  sinks:
    loki_service:
      type: loki
      inputs: [talos_service_logs_xform]
      endpoint: http://loki-gateway.monitoring.svc.cluster.local
      encoding:
        codec: json
      out_of_order_action: rewrite_timestamp
      labels:
        job: talos-service
        node: "{{ `{{ __host }}` }}"
        talos_service: "{{ `{{ service }}` }}"
        talos_level: "{{ `{{ level }}` }}"

env:
  - name: K8S_NODE_NAME
    valueFrom:
      fieldRef:
        fieldPath: spec.nodeName

tolerations:
  - operator: Exists

containerPorts:
  - name: talos-service
    containerPort: 6051
    protocol: TCP

resources:
  requests:
    cpu: 50m
    memory: 128Mi
  limits:
    cpu: 200m
    memory: 256Mi
A few things worth noting in this config:
host_key: __host — the socket source captures the source IP of the incoming TCP connection and stores it in the field named by host_key. With hostNetwork: true and per-node IP destinations (covered below), the source IP is the node IP. That IP becomes the node Loki label via "{{ {{ __host }} }}". No extraTags needed in the Talos machine config.
out_of_order_action: rewrite_timestamp — the RK1 boards have no real-time clock. Early boot log entries carry epoch-zero timestamps (1969-12-31T23:59:59) until NTP sync completes. Loki rejects out-of-order entries by default; this setting rewrites the timestamp rather than dropping the entry. The actual boot-time messages still arrive and are useful even if their timestamps are approximate.
parse_json(.msg) ?? .msg — some Talos service log messages are themselves JSON-encoded strings. This tries to parse the msg field as JSON and falls back to the raw string if it fails.
Deploy:
helm repo add vector https://helm.vector.dev
helm repo update

helm upgrade --install vector vector/vector \
  --version 0.52.0 \
  --namespace monitoring \
  --values apps/monitoring/vector/values.yaml
Verify all four pods are running and listening on the right ports:
kubectl get pods -n monitoring -l app.kubernetes.io/name=vector -o wide
NAME           READY   STATUS    RESTARTS   AGE   IP            NODE    NOMINATED NODE   READINESS GATES
vector-72wmt   1/1     Running   0          20h   10.0.140.13   rock3   <none>           <none>
vector-dgd2s   1/1     Running   0          20h   10.0.140.11   rock1   <none>           <none>
vector-jwq4g   1/1     Running   0          20h   10.0.140.12   rock2   <none>           <none>
vector-tcdld   1/1     Running   0          20h   10.0.140.14   rock4   <none>           <none>
The pod IPs match the node IPs — that's hostNetwork: true working correctly.
Patching the Talos machine config
With Vector confirmed listening, each Talos node needs to be told where to push its service logs. The straightforward approach — a single patch file using 127.0.0.1 — ran into a problem: with hostNetwork: true, connections from 127.0.0.1 arrive at Vector as host=127.0.0.1. Every node would get the same node label, making it impossible to identify which node a log came from.
The solution is per-node IP destinations. Four patch files, one per node, pointing each node at its own IP:
# infra/talos/logging-patch-rock1.yaml
machine:
  logging:
    destinations:
      - endpoint: "tcp://10.0.140.11:6051/"
        format: "json_lines"
The other three are identical except for the IP (10.0.140.12, 10.0.140.13, 10.0.140.14). Apply one at a time and verify before moving to the next:
talosctl patch machineconfig \
  --nodes rock1.vluwte.nl \
  --patch @infra/talos/logging-patch-rock1.yaml
Service log config takes effect immediately — no reboot. Check Vector logs and Grafana before applying the next node.
One issue to watch: machine.logging.destinations uses strategic merge patch semantics. Each talosctl patch machineconfig call appends to the destinations array rather than replacing it. Applying the patch twice during testing accumulated duplicate entries. Use talosctl edit mc --nodes <ip> to inspect and clean up the live machine config if this happens.
Surprise: kernel logs need no extra config
The plan included a separate kernel log facility on port 6050, configured via talos.logging.kernel=tcp://127.0.0.1:6050/ in extraKernelArgs. That kernel arg only takes effect at boot, which means a node reboot — or more precisely, a Talos upgrade, since extraKernelArgs are only applied during an upgrade, not when applying machine config.
Before going down that path, it's worth checking what's actually arriving in Loki under {job="talos-service"}. Kernel messages show up there automatically. Talos sends kernel log entries through the service log stream, at least in my setup, on port 6051, tagged as talos-service: kernel. They arrive in Loki as {job="talos-service", talos_service="kernel"} — no separate port, no reboot, no kernel arg needed.
{job="talos-service", talos_service="kernel"}
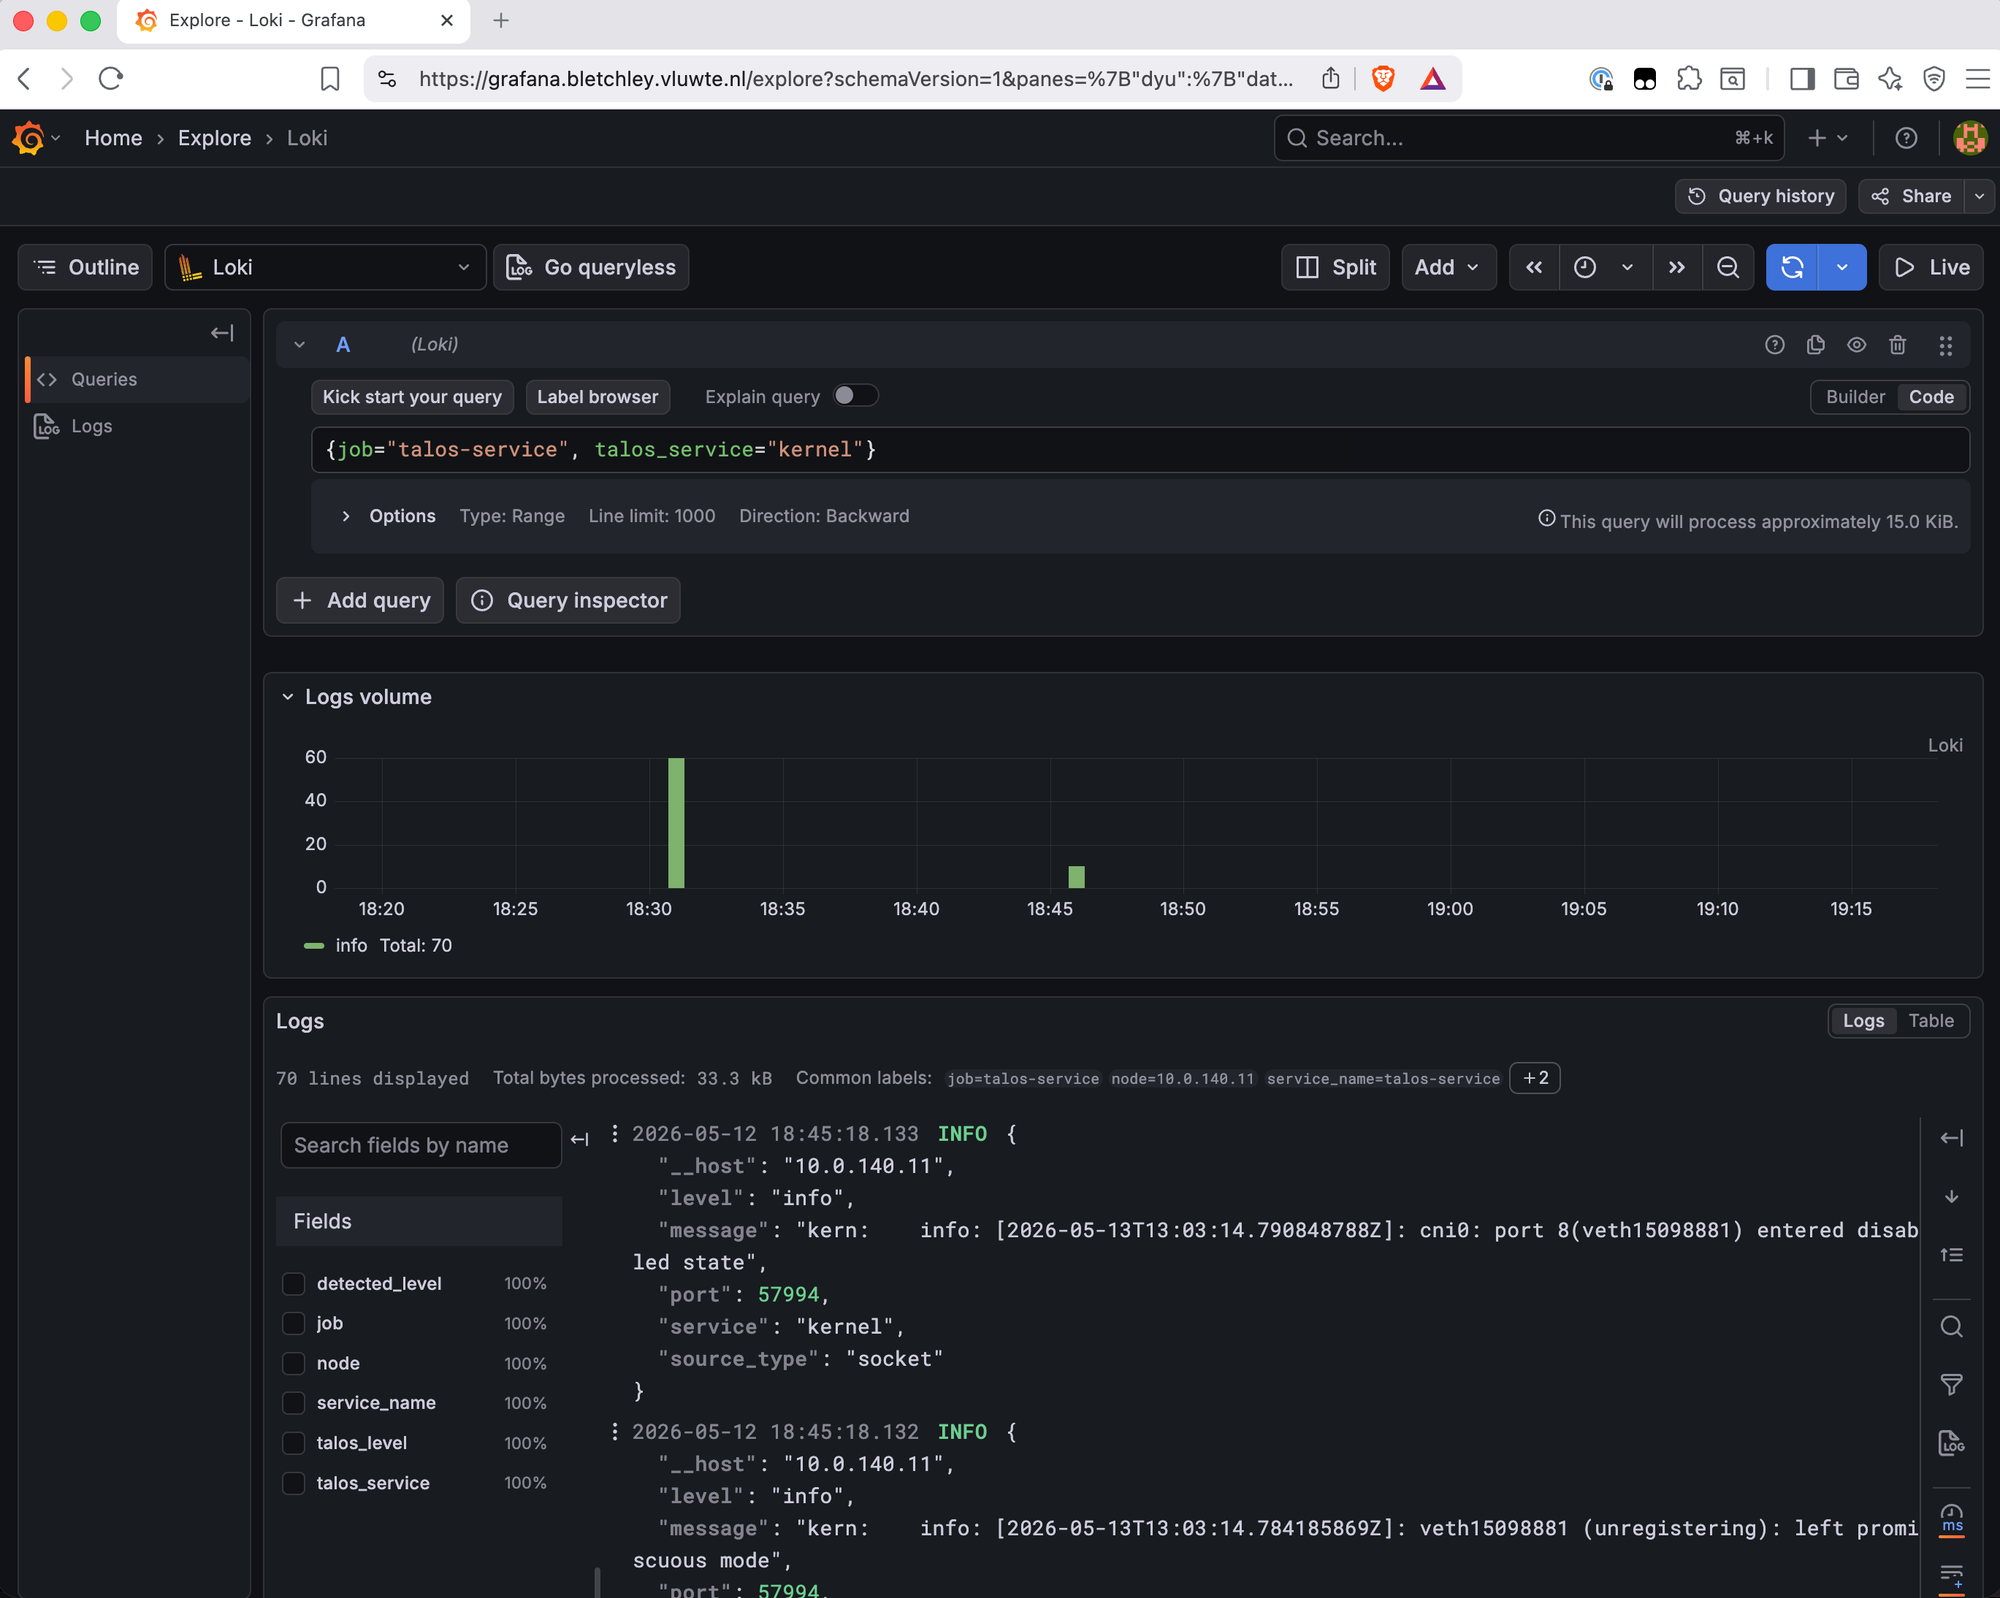
The talos.logging.kernel approach still works if you specifically need kernel logs isolated to their own stream with a separate port. But for most purposes — seeing what the kernel logged during a node event, checking network interface messages, watching the boot sequence — {talos_service="kernel"} is sufficient.
Verifying in Grafana
With all four nodes patched and Vector running, four additional LogQL queries confirm everything is working.
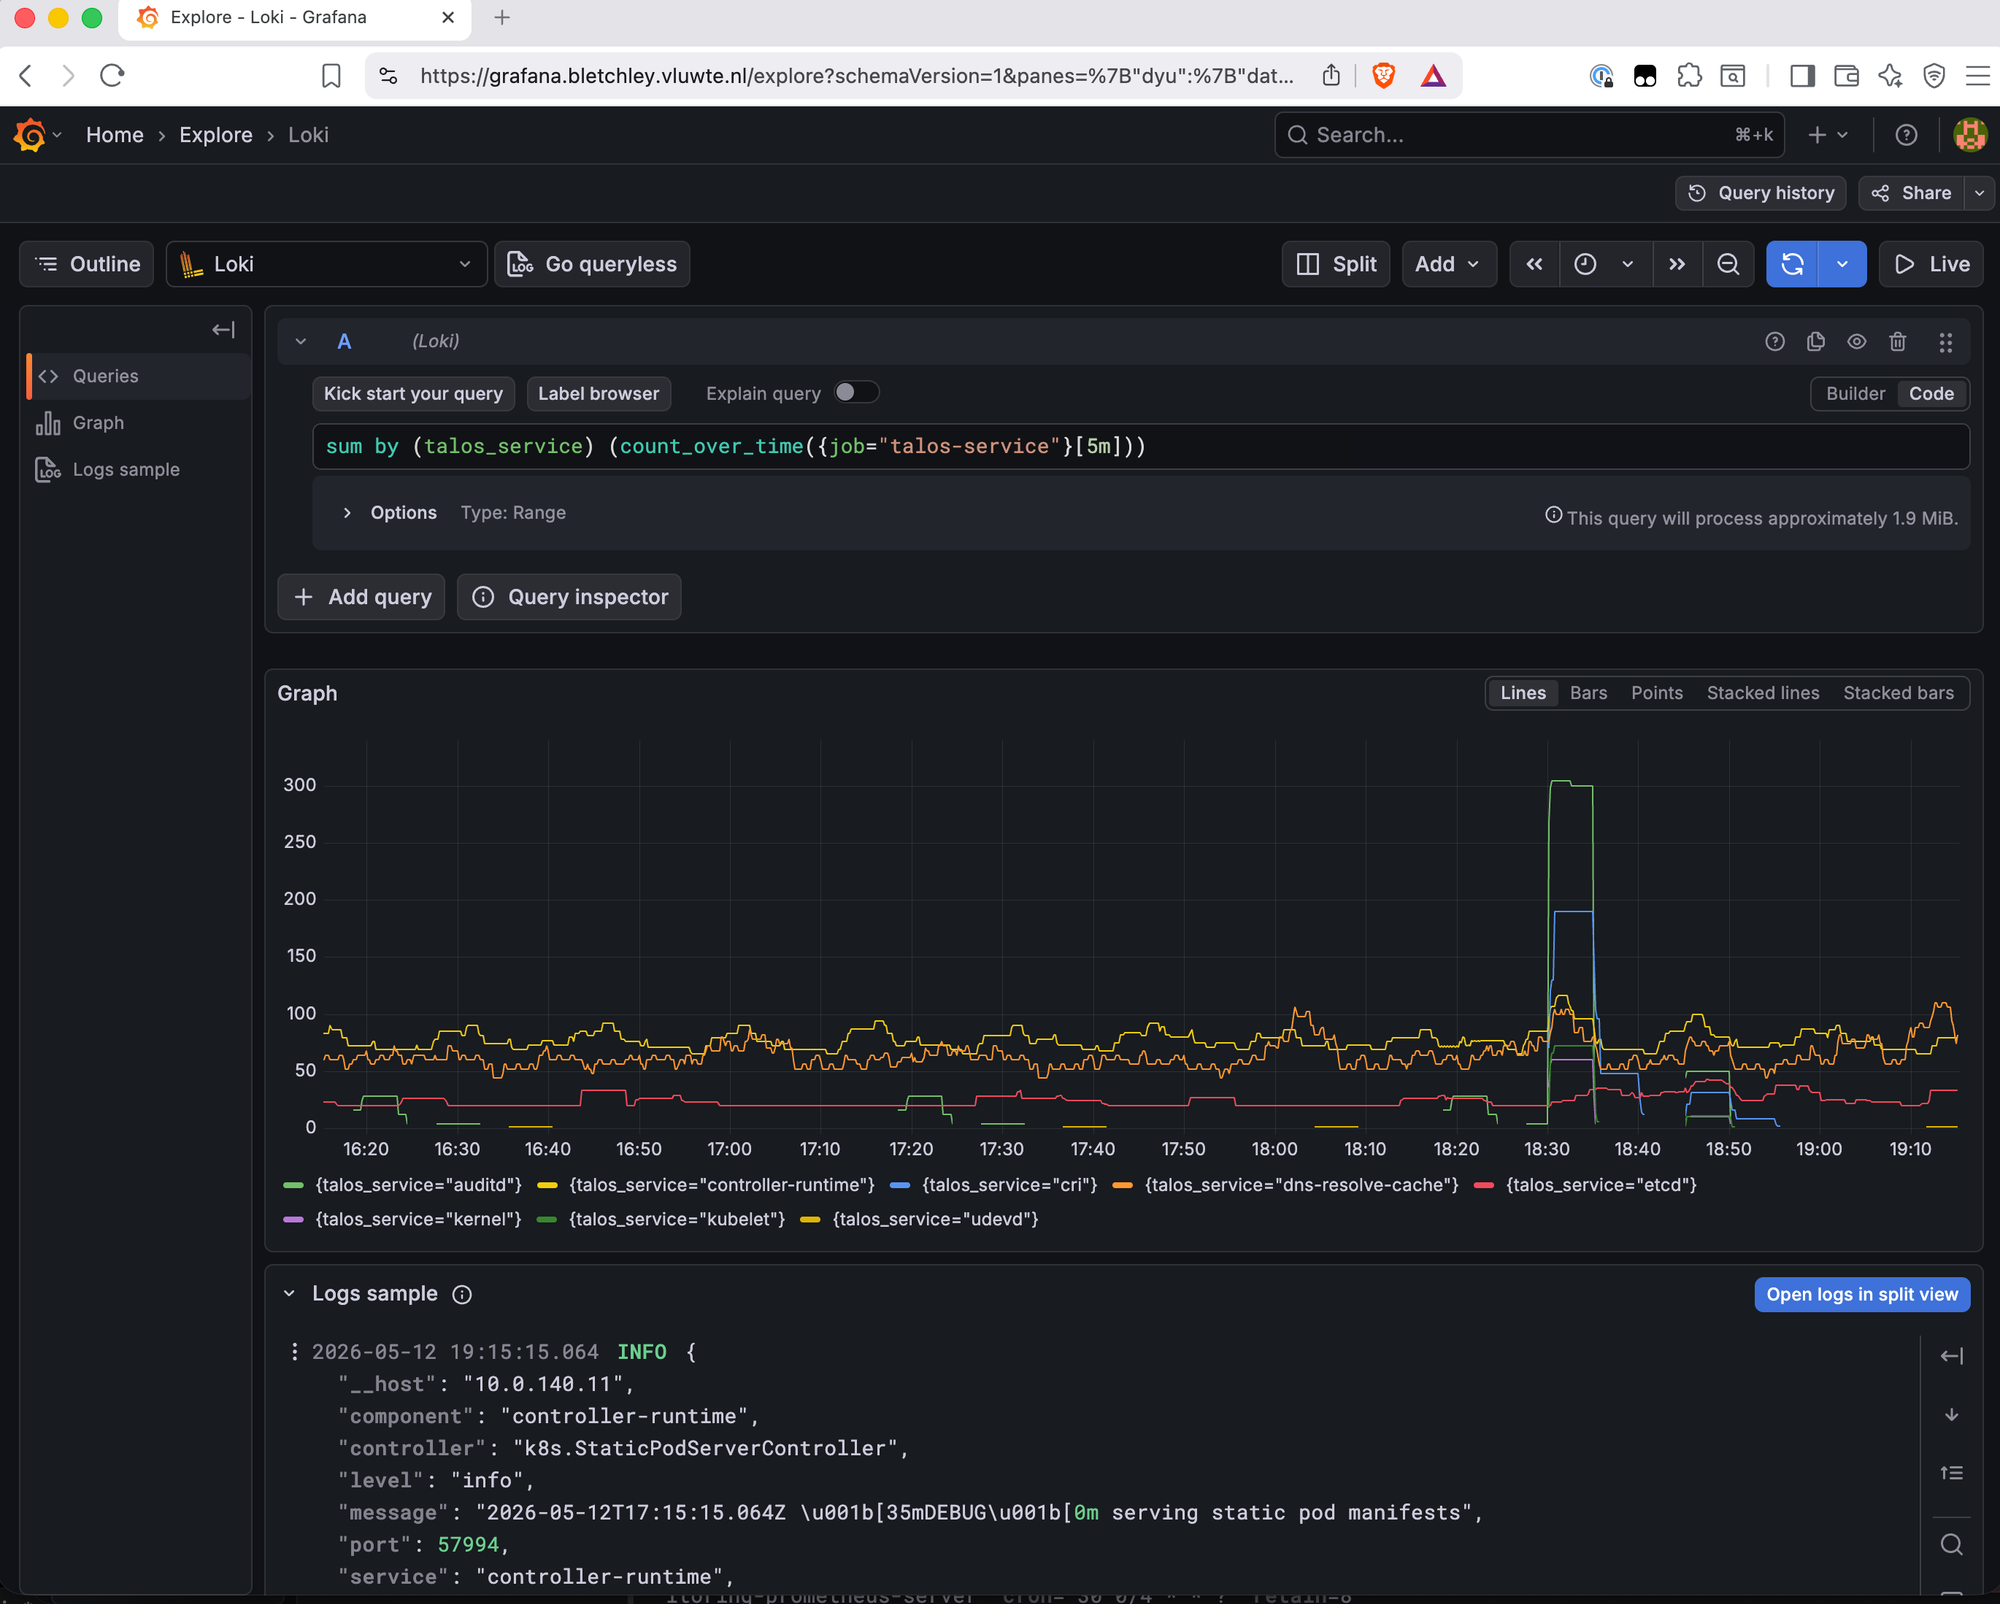
All Talos services flowing, with log volume broken down by service:
sum by (talos_service) (count_over_time({job="talos-service"}[5m]))
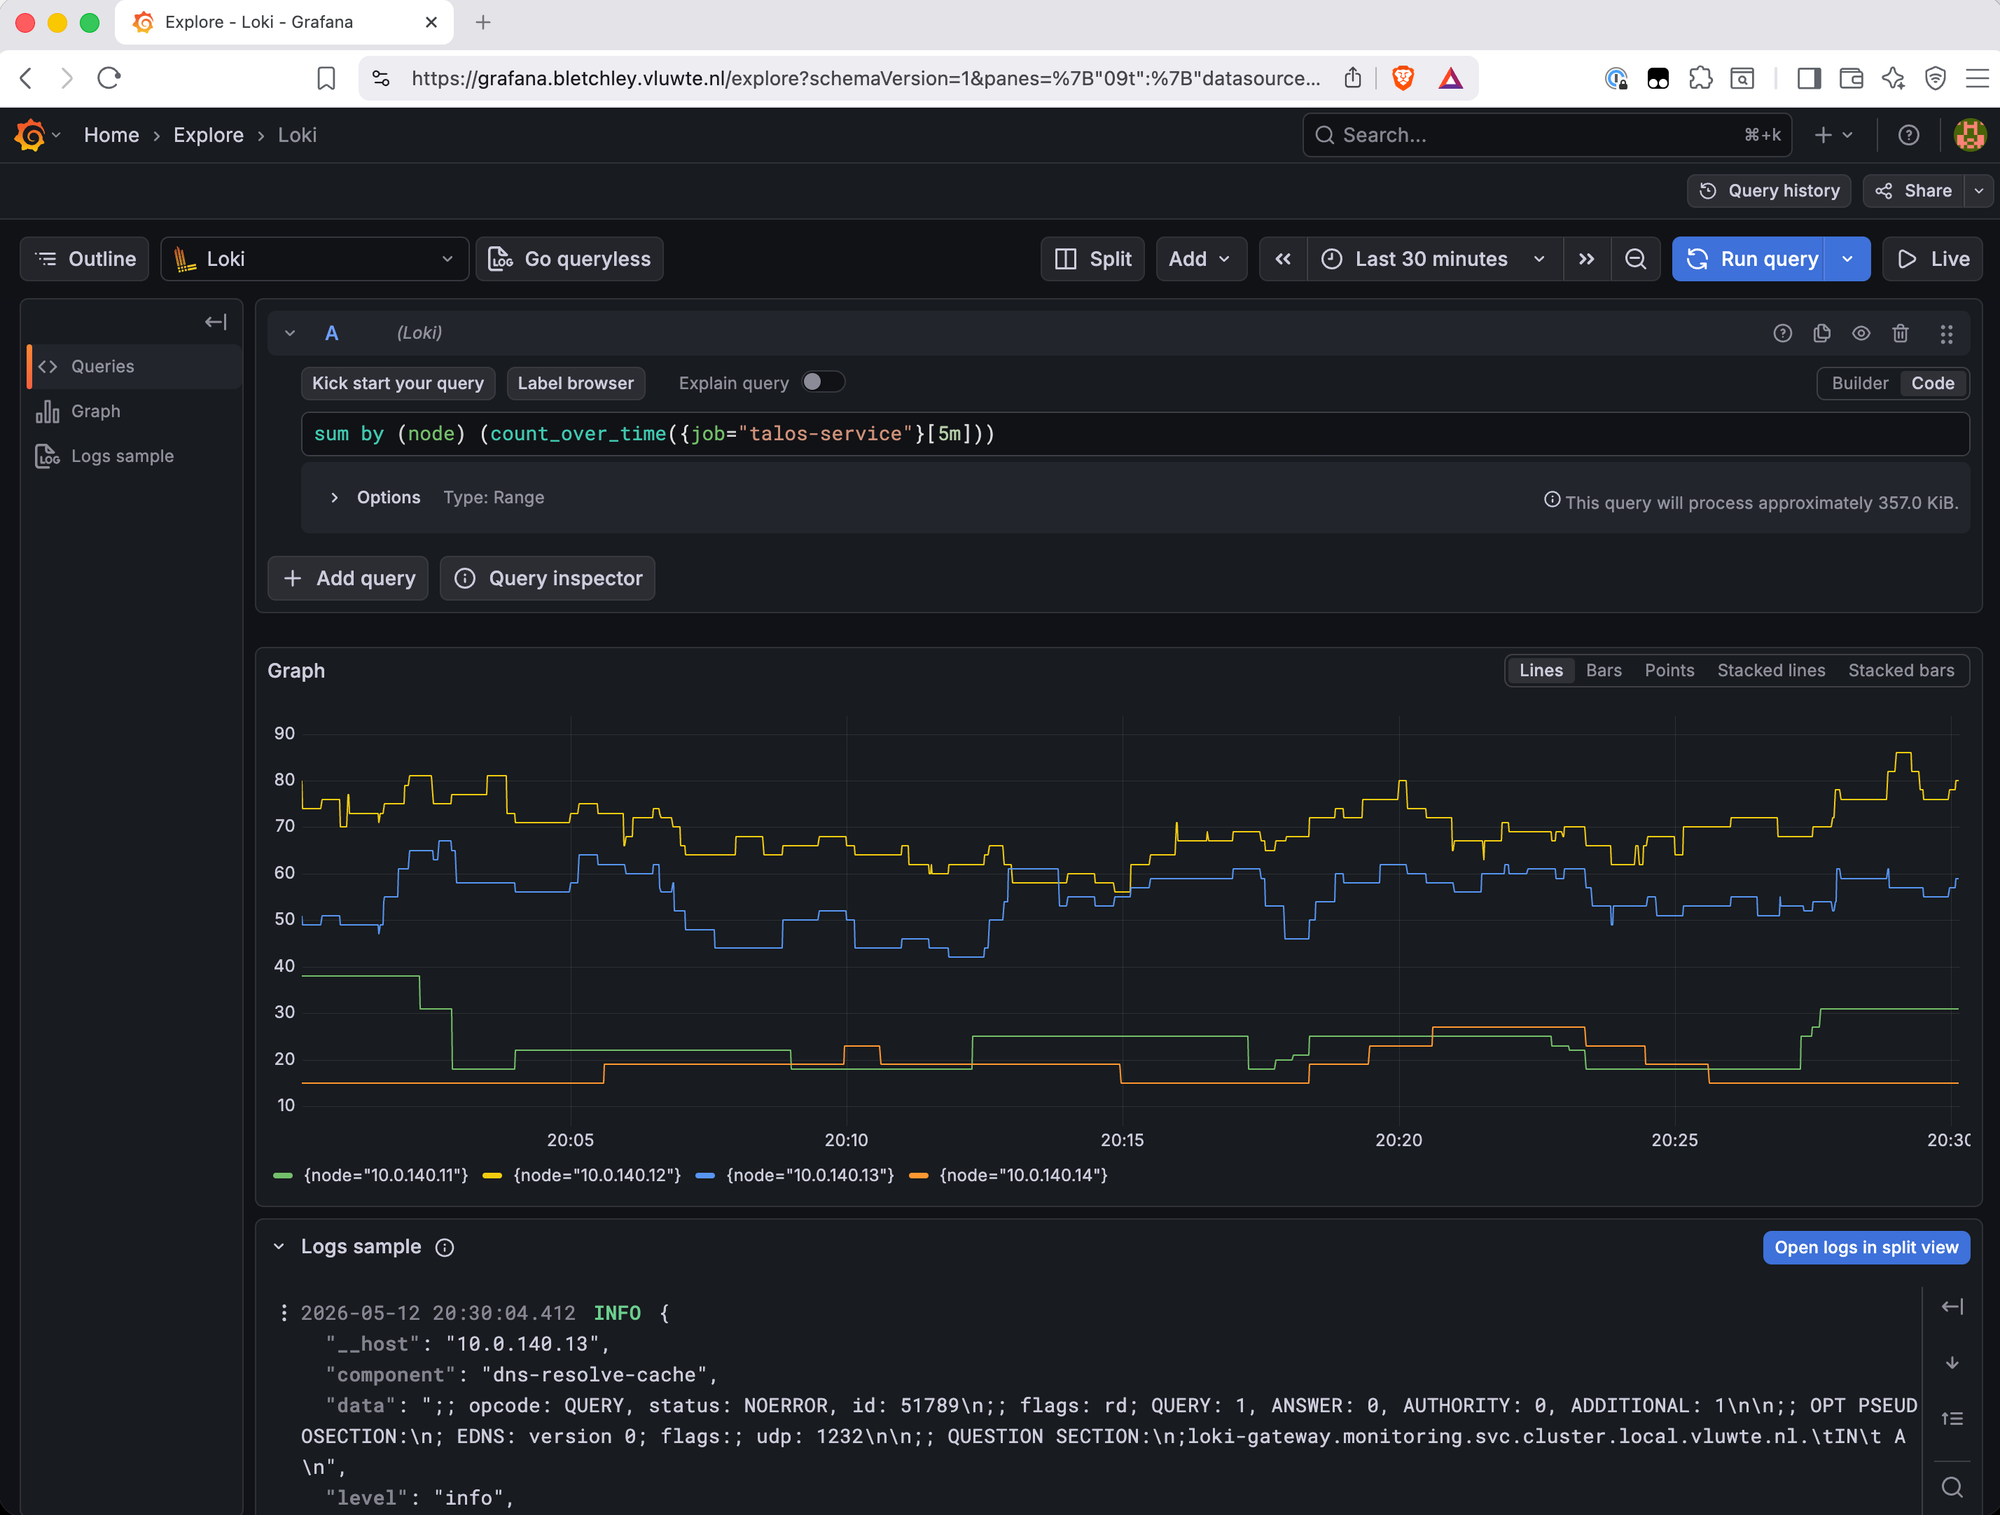
All four nodes represented:
sum by (node) (count_over_time({job="talos-service"}[5m]))
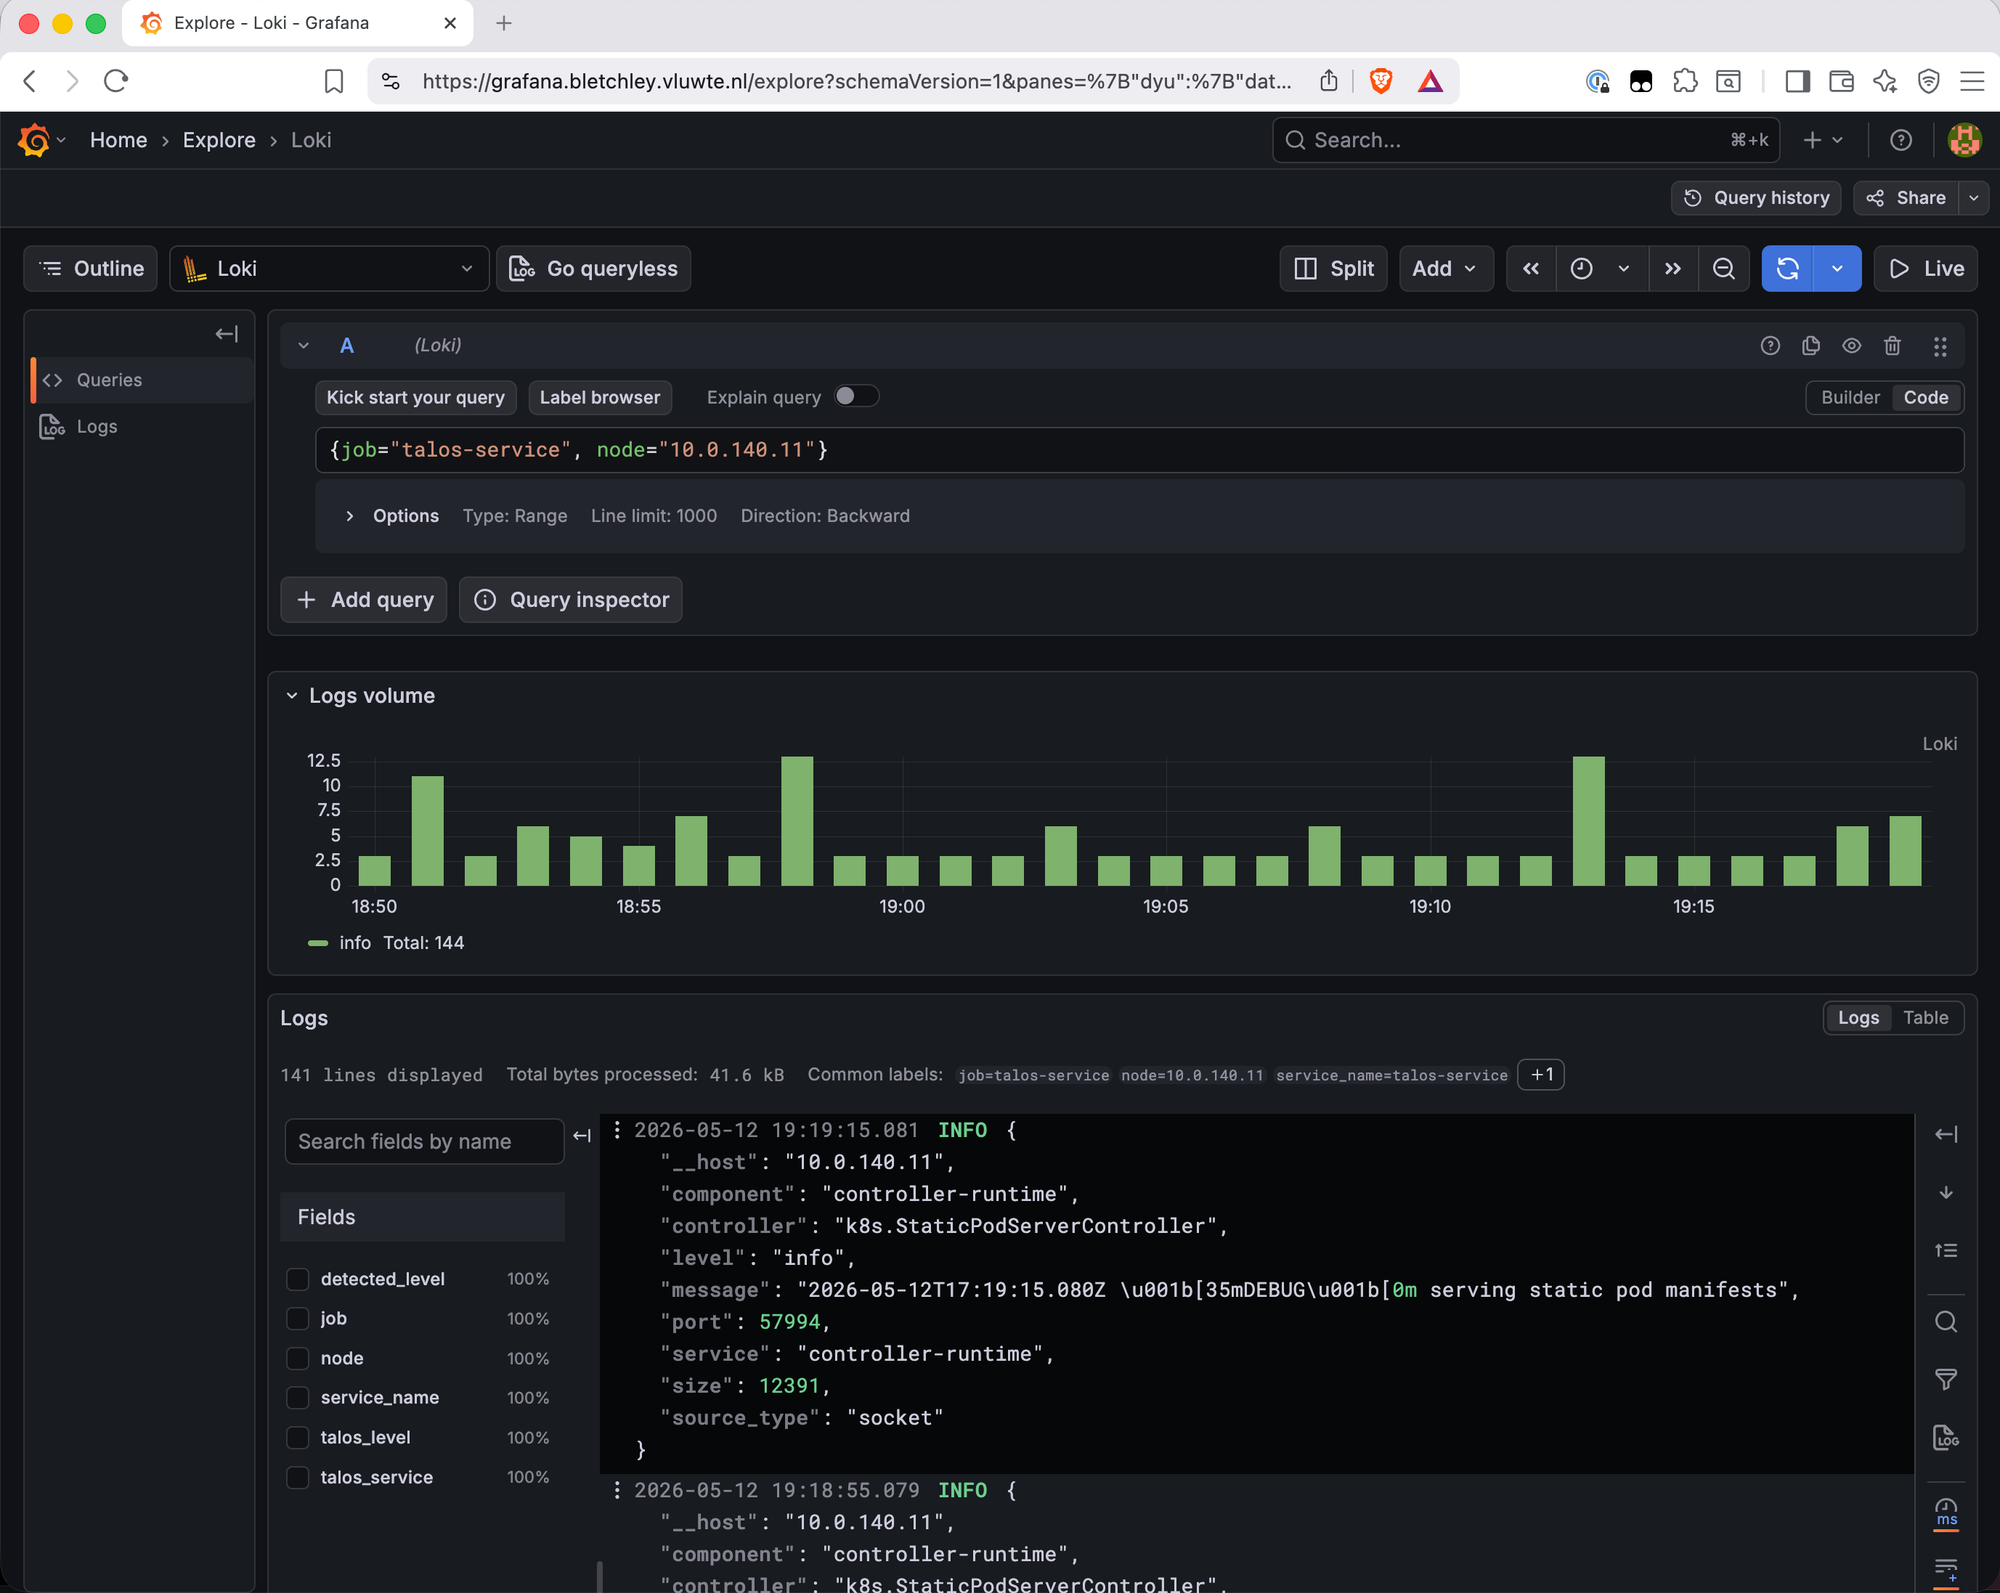
One node's logs:
{job="talos-service", node="10.0.140.11"}
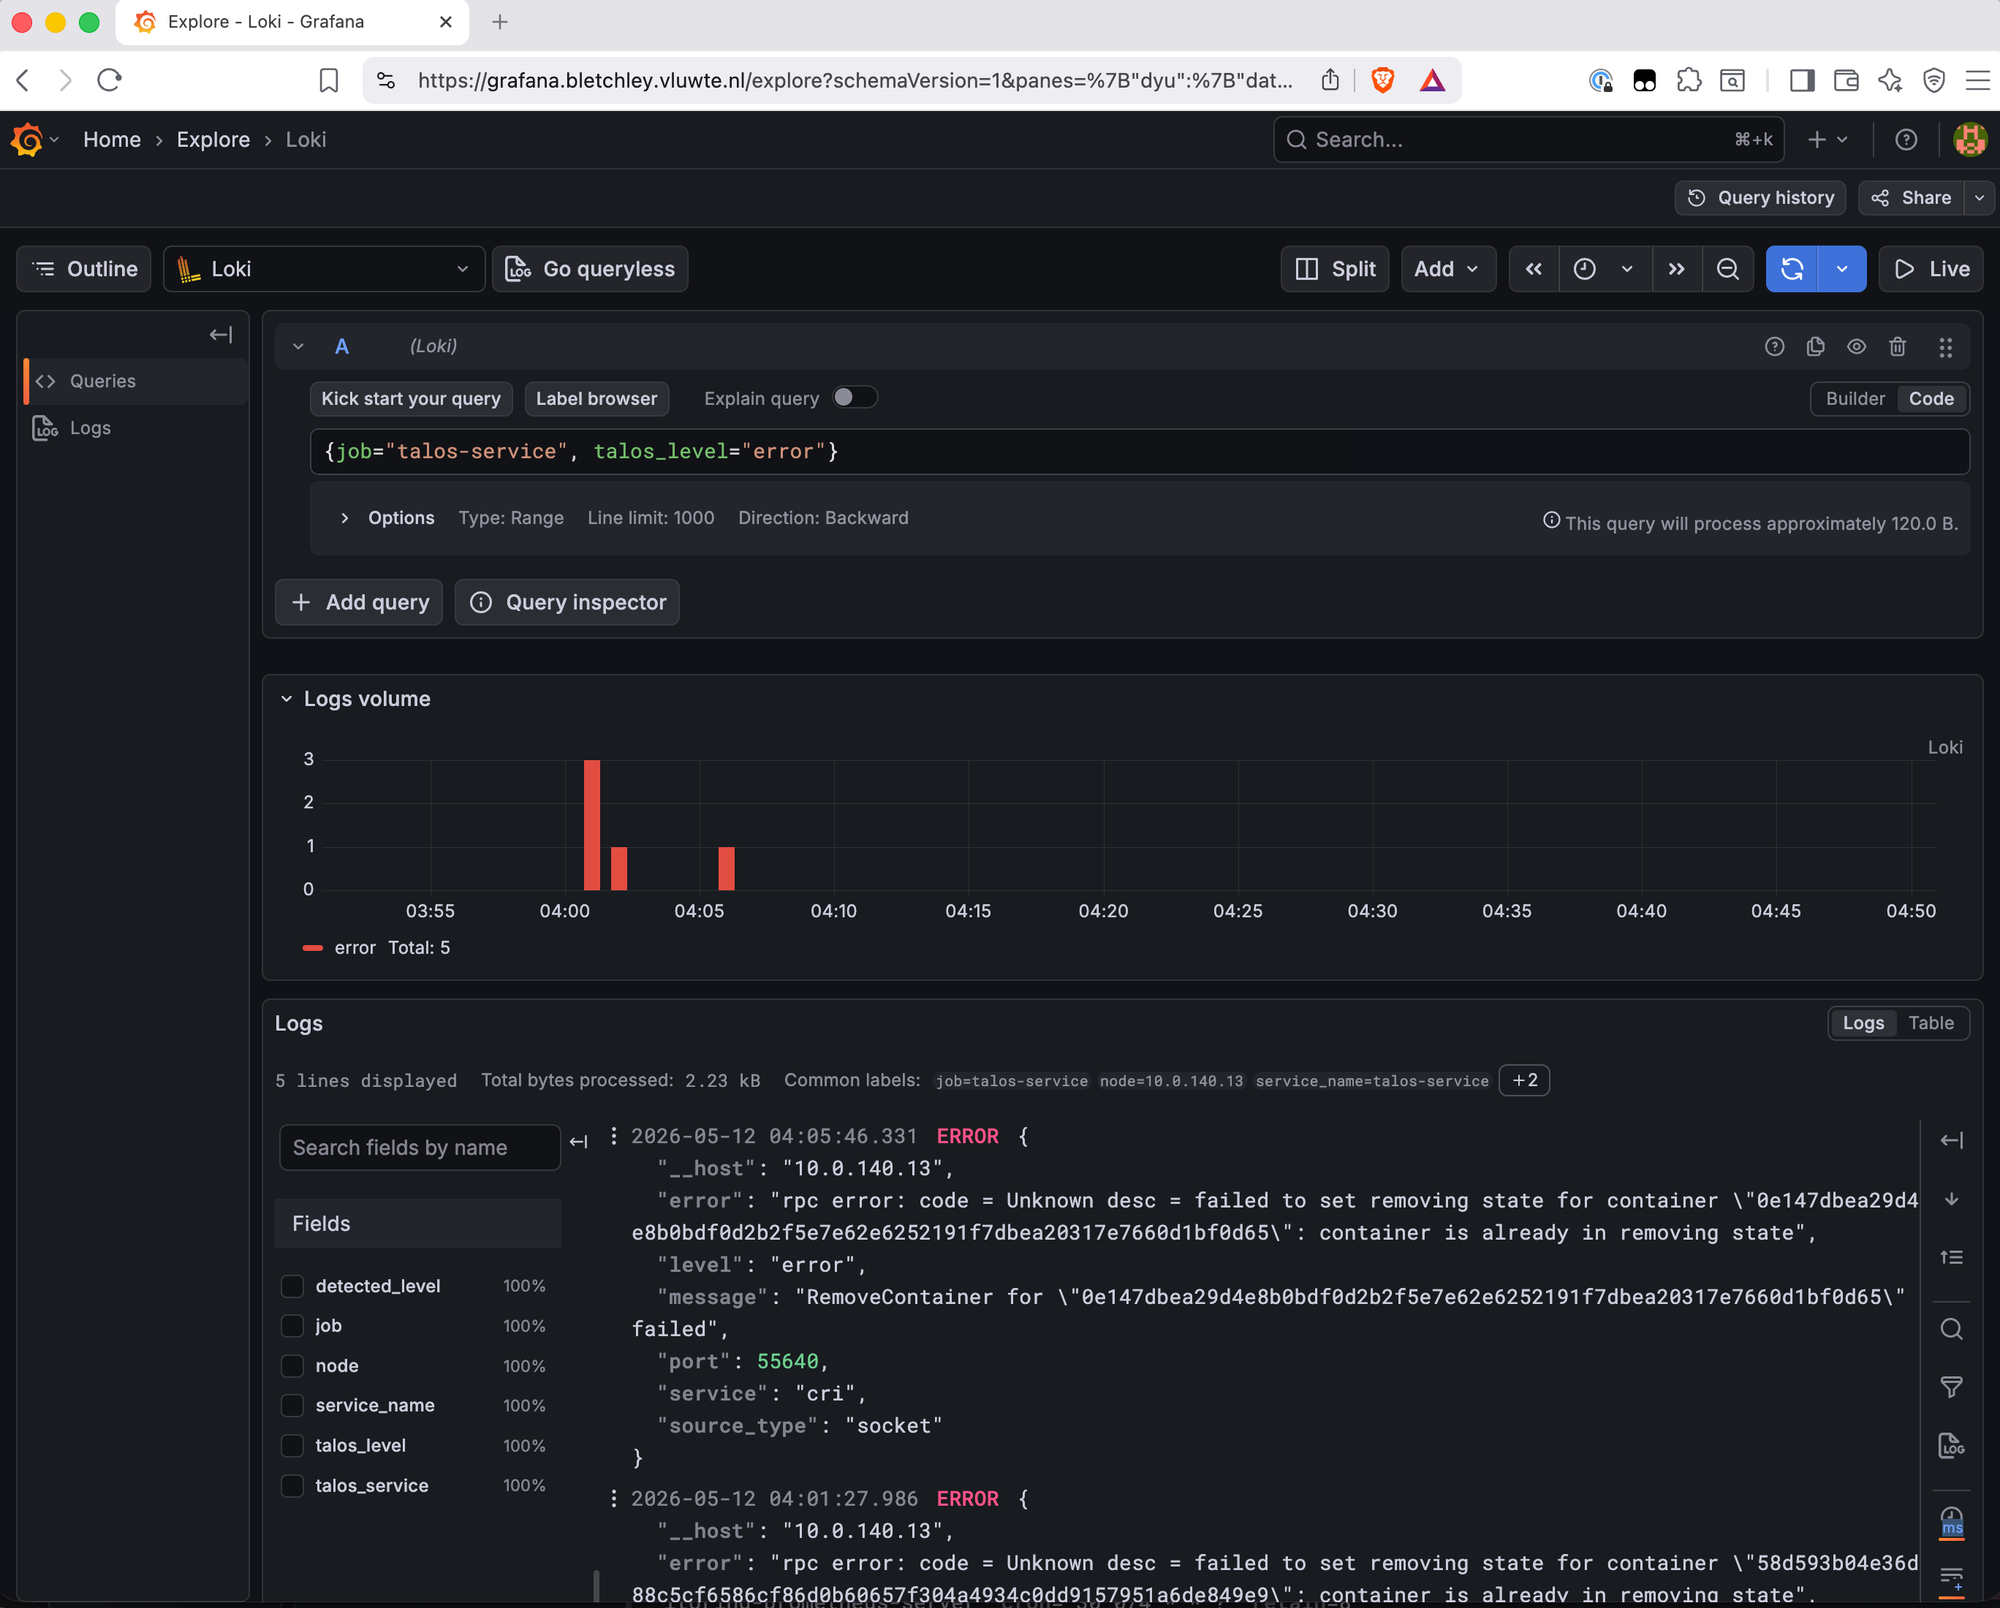
Error-level logs across all nodes:
{job="talos-service", talos_level="error"}
What's Working Now
- ✅ Alloy DaemonSet running on all 4 nodes with node-local filtering via
env("HOSTNAME")and__meta_kubernetes_pod_node_name— cross-node "failed to tail" errors eliminated - ✅ Vector DaemonSet running on all 4 nodes (ARM64, chart 0.52.0, Vector 0.55.0) with
hostNetwork: true, listening on TCP port 6051 - ✅ Talos machine config patched on all 4 nodes — service logs pushed to node IP (
tcp://10.0.140.1x:6051/) withhost_key: __hostproviding correct node attribution - ✅ All Talos services flowing into Loki under
{job="talos-service"}withnode,talos_service, andtalos_levellabels - ✅ Kernel logs arriving automatically via the service log stream as
{talos_service="kernel"}— no separate port or node reboot required - ✅ Error-level logs queryable across all nodes via
{job="talos-service", talos_level="error"} - ⚠️ Known limitation:
nodelabel is the node IP (10.0.140.11) rather than hostname (rock1) — a consequence of usinghost_key: __hostwith per-node IP destinations. Consistent and unambiguous but not human-friendly. - ⚠️ Known limitation:
out_of_order_action: rewrite_timestampadded to the Loki sink to handle epoch-zero timestamps from early boot on RK1 boards (no RTC). Early boot log entries will show the rewrite timestamp rather than the actual boot time.
Lessons Learned
- Read the actual component list before planning —
loki.source.tcpwas assumed to exist because the name followed an obvious pattern. It doesn't.helm search repo alloyor the Alloy component reference would have caught this before any config was written. - Empty string regex matches everything —
env("VAR")in Alloy River returns an empty string if the variable isn't set. An empty regex matches everything, which means thekeeprule silently passes all targets. No error, no warning. Always verify the filter is working by checking the component output, not just by the absence of errors. - Use the Alloy component graph to debug label issues —
kubectl port-forward -n monitoring <alloy-pod> 12345:12345exposes a UI that shows actual targets and their labels. When the keep rule was passing everything (wrong label name), the targets JSON showed what label names were actually present on the targets. HOSTNAMEis already set — Kubernetes setsHOSTNAMEon every pod to the pod name. For DaemonSet pods on Talos, that's the node name. No explicit injection needed.- Vector Helm chart requires inlined config —
--set-filedoesn't work forcustomConfig. The template engine iterates over the value as a structured object. Inline everything undercustomConfig:invalues.yaml. - Escape Helm templates in Vector config — Vector's
{{ field }}label syntax conflicts with Helm's Go template engine. Use"{{{{ field }}}}"to pass Vector field references through Helm unchanged. - Strategic merge patch appends arrays —
machine.logging.destinationsaccumulates entries with eachtalosctl patch machineconfigcall. Applying the same patch during debugging or retrying left duplicate destinations in the machine config. Usetalosctl edit mcto inspect and reset. extraKernelArgsonly apply during upgrades — applying a machine config containingextraKernelArgswithtalosctl patch machineconfigdoes not activate those args. They are only applied when the node is upgraded (upgrading to the same version counts). The kernel log kernel arg approach requires this — which is why it turned out to be unnecessary here.
What's Next
Talos system logs and container logs are both in Loki. The next step is making structured use of them: building LogQL queries that surface real issues, writing alerting rules for log patterns that matter, and understanding what's worth watching versus what's noise. That's Part 9.
← Previous: Log Aggregation with Loki and Grafana Alloy
Questions or suggestions? Leave a comment below or reach out at igor@vluwte.nl.