Cluster Observability Part 9: Know Your Logs Before You Hunt Them
Before hunting errors with LogQL, you need to know your log formats. Format discovery, the Garage INFO trap, klog envelopes, cardinality constraints, and fixing missing kube-system static pod logs.
Introduction
Parts 7 and 8 built the logging pipeline. Pod and container logs flow via Grafana Alloy; Talos system logs arrive via Vector. Everything lands in Loki. The pipeline is validated, the data is there — and now the question is what to do with it.
The instinct is to jump straight into querying. Run a wide error filter, see what comes back, start digging. That works fine when you know your sources. When you don't, you write a query that looks correct, get zero results, and have no idea whether the silence means no errors or just a broken query. Log formats vary enough between applications that this is a real risk: the same level=error query that works perfectly against an Authelia logfmt log stream returns nothing against a Garage log, because Garage doesn't use that field.
Before running any error queries, this post covers the prerequisite step: format discovery. What format does each namespace use? Where is detected_level reliable, and where does it silently mislead? What's the correct filter for each source? The format map that comes out of this shapes every query in Part 10.
There's also a fix — discovered mid-investigation. The kube-system static pod logs weren't being collected at all. The API server, controller-manager, and scheduler had been running silently, invisible to Loki, for weeks. The cause was a structural issue in how Kubernetes log path discovery works, and the fix was a single new config block. That story is worth telling on its own.
This post is part of the Cluster Observability sub-series.
- Part 5: Hardware Health Collectors
- Part 6: Hardware Health Dashboards and Alerts
- Part 7: Log Aggregation
- Part 8: Talos System Logs
- Part 9: Know Your Logs Before You Hunt Them
What's Flowing Into Loki
Two streams are available. Pod and container logs come via Grafana Alloy running as a DaemonSet — one Alloy pod per node, tailing /var/log/pods/ and forwarding to Loki with namespace, pod, container, and node labels. Talos system logs come via Vector, which receives logs over TCP from each node's machine.logging.destinations configuration and adds talos_service and node labels before forwarding.
The retention window extends back to approximately April 22nd for kube-system static pod logs (more on that shortly) and to around May 11–13th for most other namespaces, depending on when Alloy was first successfully configured on each node. There are also some quirks in that early window — log collection involved several Alloy config iterations between May 11 and 13, and that period has artefacts. That matters more for the hunt in Part 10 than for format discovery, but it's worth knowing now.
The monitoring namespace is excluded from cluster-wide queries — Loki logs its own query execution, so any query containing the word "error" would self-referentially match.
Why Format Discovery Matters
Grafana Explore presents a polished view. Log lines get colour-coded severity badges — a yellow WARN badge, a red ERROR badge — and structured fields are extracted and displayed cleanly. It looks like Loki understands your logs.
It doesn't, not automatically. The badges come from Loki's heuristic level detection rather than an application-provided severity field. Grafana Explore renders this as detected_level, but that value is inferred from log content patterns and should not be treated as authoritative. Sometimes it's right. Sometimes it detects the word "error" in the body of an info-level message and marks the whole line as error-level. Sometimes it finds nothing and labels the line unknown. Grafana Explore's presentation can obscure how heuristic and source-dependent the severity detection actually is.
This is the reason to run format discovery before writing error queries. The detected_level="error" filter that works cleanly for Authelia (which uses logfmt with a proper level= field) behaves completely differently for Garage (Rust tracing format where errors appear inside INFO-level lines) or for klog sources like cert-manager (where the severity is encoded as a single letter prefix, E0514 ..., and the line otherwise looks like unknown to Loki's detection).
There are three things format discovery establishes: which parser works (logfmt, json, none), whether detected_level is reliable, and what the correct error filter is. The third is what actually gets used in queries.
The Discovery Queries
The basic approach is to try each parser and observe whether it extracts a meaningful field:
# Does logfmt extract a level field? (not just parse without crashing)
{namespace="authelia"} | logfmt | level != ""

# Does JSON extract a level field?
{namespace="garage"} | json | level != ""

# What detected_level values does Loki assign? (no parser needed)
sum by (detected_level) (
  count_over_time({namespace="cert-manager"} | detected_level != "" [1h])
)
The key lesson from __error__="" as a format test: it only confirms the parser didn't crash, not that it extracted anything useful. Many plain-text lines pass through logfmt parsing without producing useful fields. The right test is whether it extracts a field you actually need.
The Format Map
After running discovery across all namespaces, this is what the cluster looks like:
| Namespace | Format | detected_level reliable? |
Correct error filter |
|---|---|---|---|
authelia |
logfmt | yes | detected_level="error" |
cert-manager |
klog | partial | |~ "\\bE[0-9]{4}\\b" |
external-secrets |
logfmt | yes | detected_level="error" |
traefik |
mixed | partial | detected_level="error" for app logs; |~ " [45][0-9]{2} " for access logs |
garage |
Rust tracing text | no | |= " 404 " or |~ " [45][0-9]{2} " |
postgres (PostgreSQL) |
plain text | unreliable | |~ " (ERROR|FATAL|PANIC): " |
forgejo |
custom Forgejo format | no | |~ "\[E\]" |
longhorn-system |
mixed | partial | detected_level="error" with container filter |
openbao |
custom HashiCorp bracket | mixed | detected_level="error" |
metallb-system |
logfmt | yes | detected_level="error" |
backup-controller |
logfmt | yes | detected_level="error" |
kube-system (kube-apiserver) |
klog + embedded JSON | partial | |~ "\\bE[0-9]{4}\\b" |
kube-system (kube-controller-manager) |
klog | partial | |~ "\\bE[0-9]{4}\\b" |
kube-system (kube-scheduler) |
klog | partial | |~ "\\bE[0-9]{4}\\b" |
kube-system (coredns) |
mixed | partial | detected_level="error" + |= "error" pass |
kube-system (kube-proxy) |
logfmt | yes | detected_level="error" |
talos-service (all) |
JSON | yes | detected_level="error" |
Four namespaces had no logs at all — nfs-server, kube-node-lease, kube-public, and default — and were excluded from all further queries.
One deliberate choice here: nothing found during format discovery was promoted into a Loki label. Labels are indexed and drive cardinality — high-cardinality labels like request IDs, user IDs, or URLs can make Loki expensive and difficult to operate at scale. The label set stays fixed at namespace, pod, container, and node. Larger organizations often normalize logs during ingestion into canonical fields like severity and service to reduce per-source query complexity, but that trades pipeline simplicity for standardization. This cluster accepts per-source query logic instead and keeps logs in their original format — which is exactly what makes format discovery worth doing. Part 11 will add one more label when configuring alerting rules, and that will be a deliberate choice too.
Three Lessons Worth Calling Out
The klog envelope. Kubernetes control plane components use klog, which produces lines like:
2026-05-16T07:27:18.252265356Z stderr F I0516 07:27:18.252003 1 cidrallocator.go:278] updated ClusterIP allocator...
The stderr F at the start is the container runtime envelope added by kubelet before writing to disk — it's not part of the original log line. The klog severity letter (I, W, E, F) sits at position 11 of the original line, well after the envelope. Loki's level detection heuristics recognize the E prefix as error-like severity, but I (info) produces unknown because klog has no readable level= field for those lines. This is expected. The right filter for klog errors is |~ "\\bE[0-9]{4}\\b" — a regex anchored on the klog error prefix, which avoids false matches on longer strings like ERROR1234.
The Garage INFO trap. Garage logs HTTP response outcomes in request-level tracing output rather than emitting dedicated ERROR-severity events for each failing request. The result is that queries looking for explicit ERROR lines return nothing useful, even when real HTTP failures are present:
garage_api_common::generic_server: error 404 Not Found, Key not found in response to...
The word "error" appears in the message body of an INFO-level line. detected_level picks up the word and marks the line as error — but filtering by |= " ERROR " (uppercase, as you might write for a structured source) returns nothing. The result: detected_level="error" is misleading for Garage, and filtering for an ERROR-severity line returns nothing useful, even when real errors are present. The only reliable approach is to filter by HTTP status code: |= " 404 " or |~ " [45][0-9]{2} ". Format discovery is the only way to know this before writing the query.
The kube-controller-manager false positive. Loki's heuristics mark lines warn if they detect the word "Warning" in the body — even when the klog prefix says I (info). The controller-manager produces lines like:
I0511 ... "Warning: skipping controller..."
This appears as detected_level="warn" on what is actually an info-level line. Using detected_level="warn" for klog sources would pull these in as warnings when they're not. The word-bounded klog prefix filter avoids the ambiguity entirely.
An Unexpected Find: Static Pod Logs Were Missing
While working through the format discovery checklist, something was missing. The kube-system namespace had logs — kube-flannel, kube-proxy, CoreDNS were all present — but the control plane components weren't. No kube-apiserver, no kube-controller-manager, no kube-scheduler. Not a thin stream. Nothing at all, from any node, after May 11th.
The Cause: Mirror Pod UID Mismatch
Alloy discovers pod log paths by watching the Kubernetes API for running pods, building the path to the pod's log directory from the pod's UID: /var/log/pods/<namespace>_<pod-name>_<UID>/. For normal pods this works correctly — the API returns the same UID that kubelet used when writing the logs to disk.
Static pods are different. Static pods are managed directly by kubelet from local manifests in /etc/kubernetes/manifests/. kubelet creates mirror pod objects in the API server so they appear in normal Kubernetes workflows — kubectl get pods shows them, controllers can reference them — but the mirror pod metadata does not fully match the runtime pod identity used for on-disk log paths. Specifically, the UID in the mirror pod object differs from the UID kubelet assigned when writing logs to disk.
Alloy queries the API, gets the mirror pod UID, builds a path from it, and looks for logs there. The path doesn't exist. kubelet wrote the logs to a path based on its own local UID, not the mirror UID. The glob never resolves. The logs sit on disk, unread.
This is not unique to Alloy — Promtail and other Kubernetes log collectors that rely on Kubernetes API metadata to construct pod log paths hit the same static-pod discovery edge case. It's a structural consequence of how Kubernetes represents static pods, not a deficiency in any particular collector.
The Fix: Name-Based Glob
The solution is to bypass API-based path discovery for static pods entirely and match by pod name instead. Static pods have predictable names: kube-apiserver-<nodename>, kube-controller-manager-<nodename>, kube-scheduler-<nodename>. A glob on the name resolves correctly regardless of what UID kubelet assigned.
A second source block was added to config.alloy:
// Source 2 — Static pod logs from /var/log/pods/
// Static pods are managed directly by kubelet from local manifests.
// kubelet creates mirror pod objects in the API server, but the mirror pod
// metadata does not match the runtime pod identity used for on-disk log paths.
// The UID in the mirror pod differs from the UID kubelet assigned on disk —
// so the API-derived path construction used in Source 1 never resolves.
// Solution: match by pod name glob directly, bypassing API discovery.

local.file_match "static_pod_logs" {
  path_targets = [
    {
      __path__ = "/var/log/pods/kube-system_kube-apiserver-*/*/*.log",
      namespace = "kube-system",
      pod       = "kube-apiserver",
      container = "kube-apiserver",
      node      = env("HOSTNAME"),
    },
    {
      __path__ = "/var/log/pods/kube-system_kube-controller-manager-*/*/*.log",
      namespace = "kube-system",
      pod       = "kube-controller-manager",
      container = "kube-controller-manager",
      node      = env("HOSTNAME"),
    },
    {
      __path__ = "/var/log/pods/kube-system_kube-scheduler-*/*/*.log",
      namespace = "kube-system",
      pod       = "kube-scheduler",
      container = "kube-scheduler",
      node      = env("HOSTNAME"),
    },
  ]
  sync_period = "5s"
}

loki.source.file "static_pod_logs" {
  targets    = local.file_match.static_pod_logs.targets
  forward_to = [loki.write.default.receiver]
}
The Alloy upgrade was applied with helm upgrade, and the Alloy logs confirmed all three static pods on all nodes started tailing immediately:
ts=2026-05-16T07:26:39.693426259Z level=info msg="start tailing file"
  component_id=loki.source.file.static_pod_logs
  path=/var/log/pods/kube-system_kube-apiserver-rock1_.../kube-apiserver/0.log
Retroactive Coverage
The fix had an immediate side effect: three weeks of API server, controller-manager, and scheduler logs — sitting on disk, unread since April 22nd — were ingested into Loki at once. All four nodes, all three components.
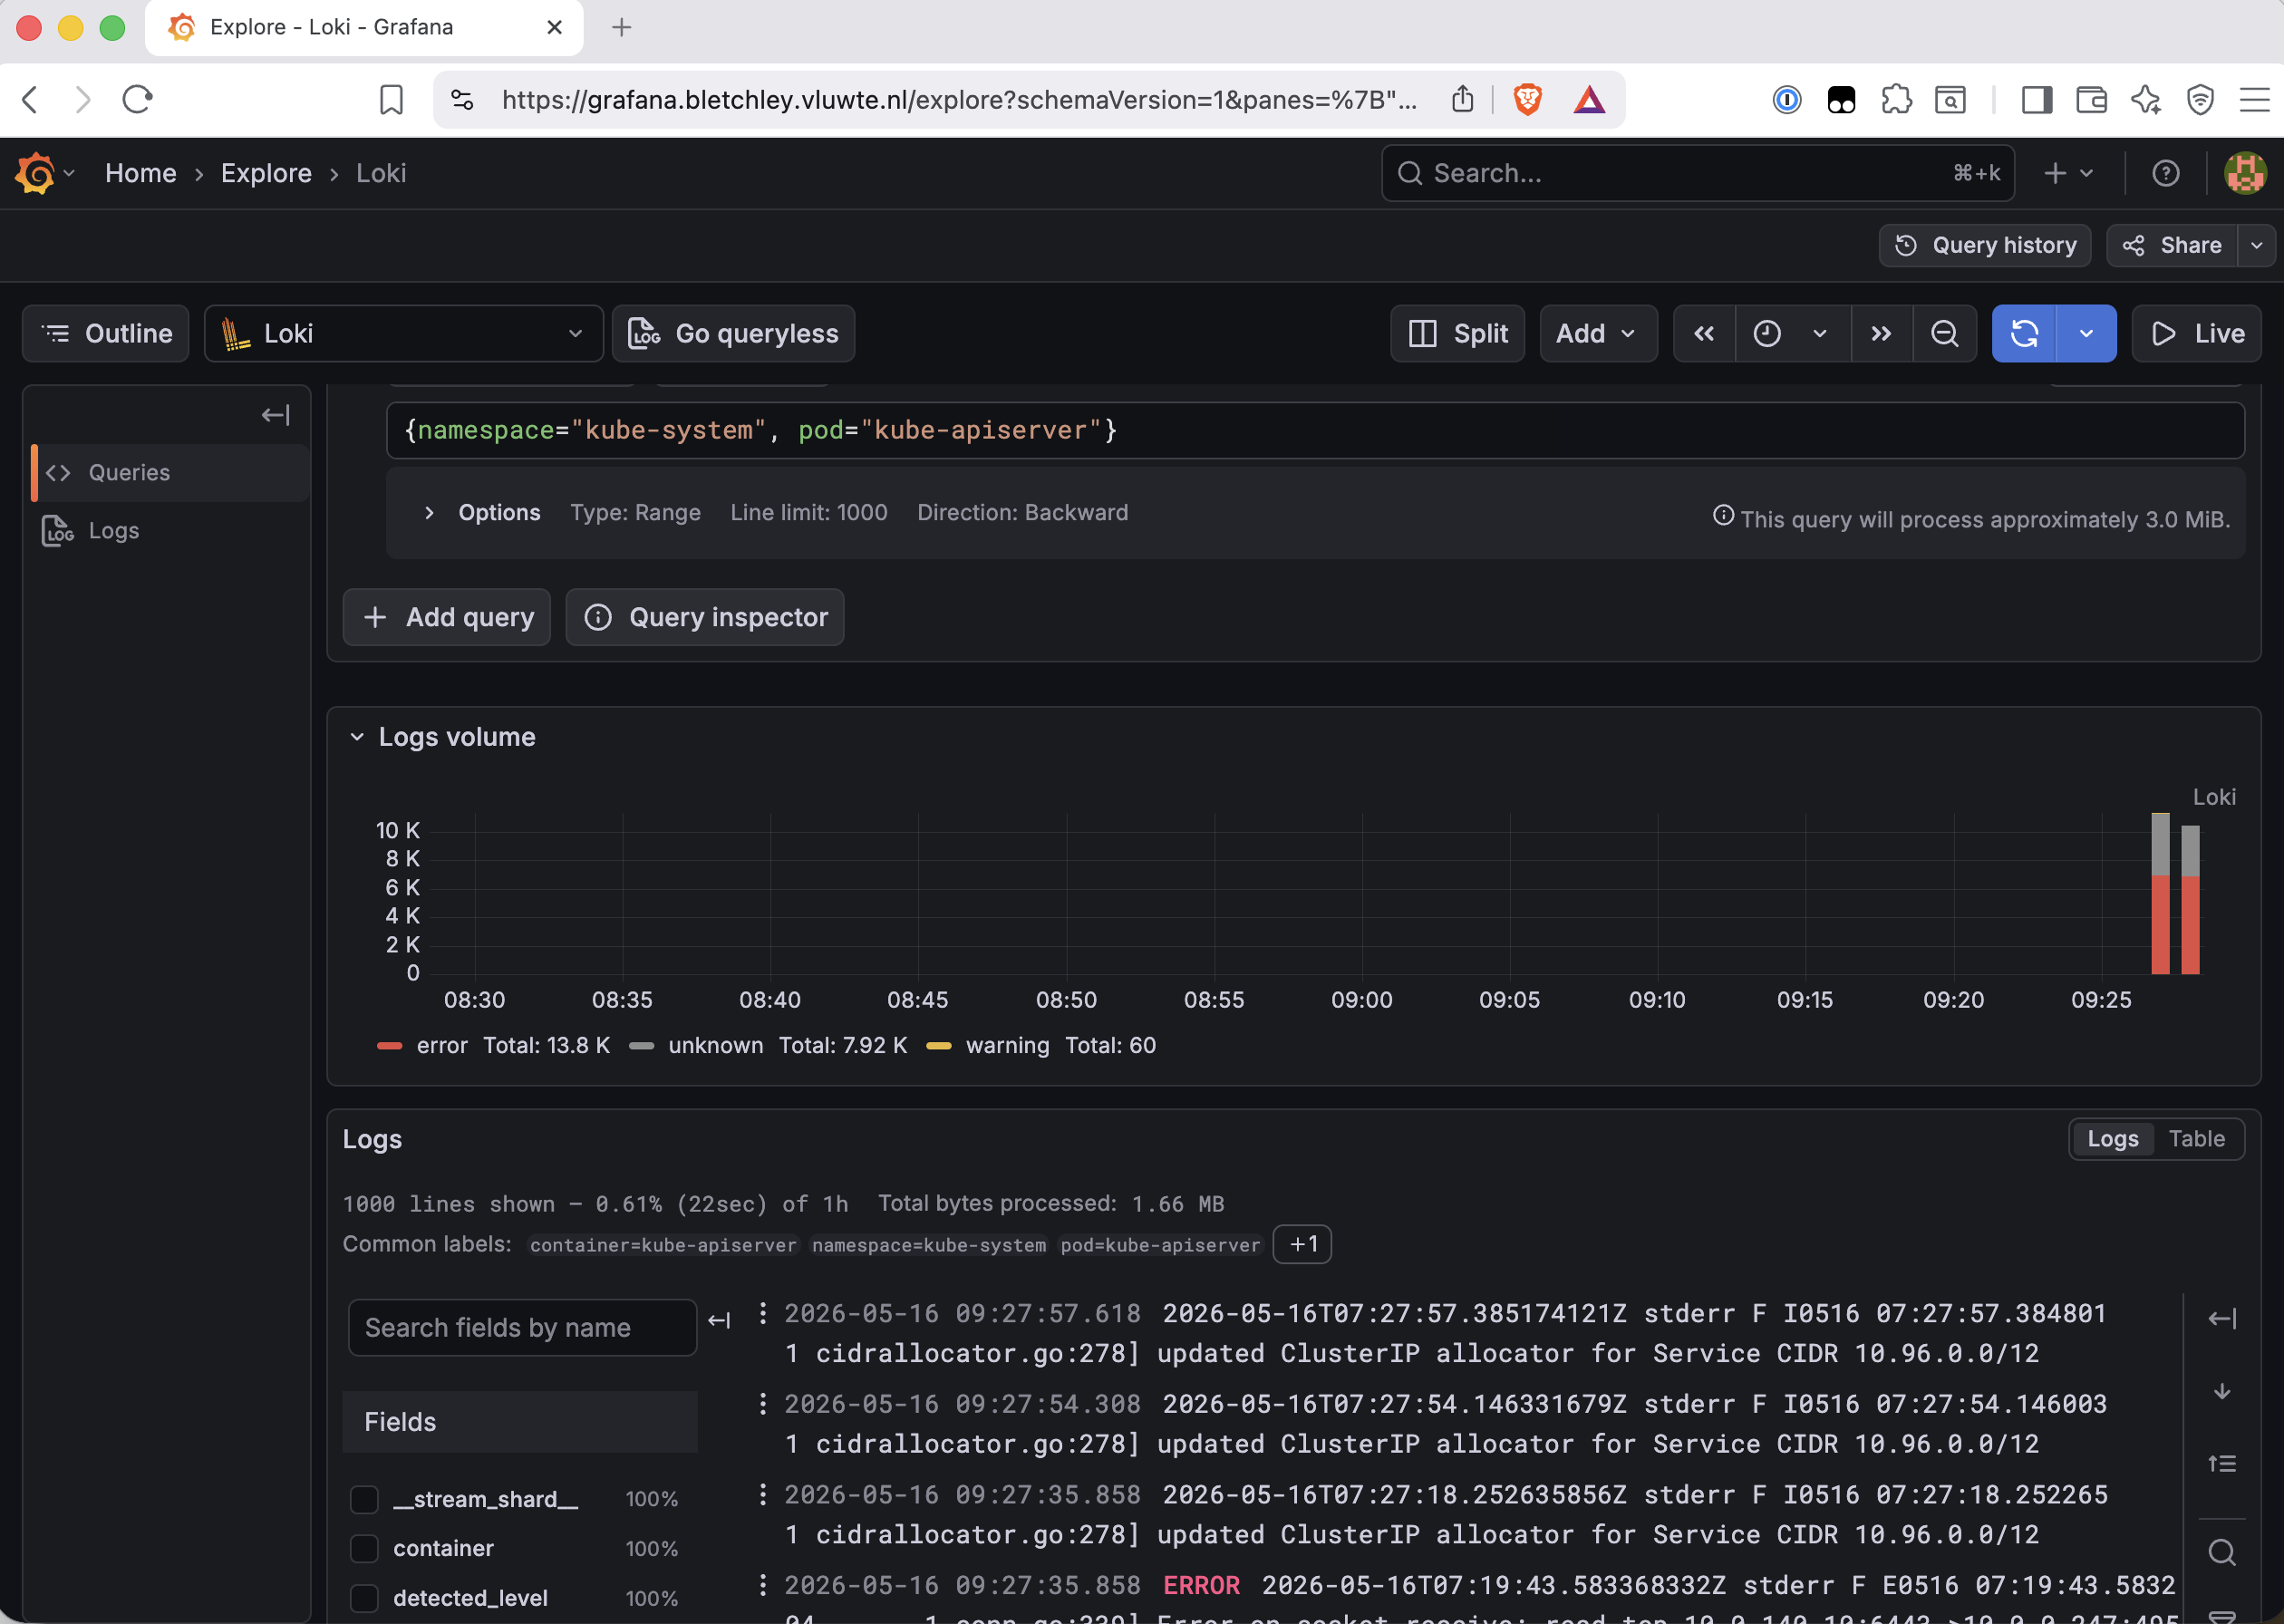
This is important to understand before reading any of the kube-system error queries in Part 10: a log line with a Loki ingestion timestamp of May 16th and an app timestamp of April 22nd is not a new error. It's a historical error that was always in the log file — Loki just received it now. Reading the app timestamp (the one embedded in the log line itself) rather than the ingestion timestamp is essential for kube-system throughout Part 10.
What's Ready to Query
With format discovery complete and the static pod fix applied, the full cluster log surface is now covered:
- All pod and container logs from all namespaces
- kube-system static pod logs back to April 22nd (retroactive)
- Talos system logs from all four nodes via the
talos-servicestream
The format map above gives the correct filter for each source. Part 10 uses this map throughout — every query in the investigation is written with the right filter for the namespace it targets.
Two things to keep in mind going into Part 10. First, pre-May 13 data across most namespaces is unreliable — the Alloy bootstrap period produced duplicate ingestion artefacts. All investigations use May 13 as the start of the reliable window. Second, kube-system data before May 16th arrived as retroactive backlog — app timestamps need to be read, not ingestion timestamps.
What's Next
Part 10 uses this foundation to run the actual error hunt: wide-net queries across the cluster, triage, and six individual investigations into what the logs turn up. Some findings are noise, some are real incidents, and two required fixes during the investigation itself.
Log-based alerting — the Loki ruler sending alerts directly to Alertmanager — is Part 11.
← Previous: Part 8: Talos System Logs
Questions or suggestions? Leave a comment below or reach out at igor@vluwte.nl.