The Backup That Wasn't: Eight Days, Five Root Causes
A stale Grafana metric, eight days of silent failure, and five root causes that each made sense in isolation. How a backup stopped without anyone noticing.
Introduction
The alerting review that became Auditing the Alerts was supposed to be a tidy exercise in noise reduction. Tune the fan alert, add a few missing rules, call it done. What I found instead, while poking around the Grafana dashboards, was a metric that hadn't moved in eight days: postgres_backup_last_success_timestamp_seconds, frozen over a week earlier. No alert had fired. No email had arrived. The backup had simply stopped, silently, and nothing had noticed.
Eight days is long enough for a real data loss event to become unrecoverable. The umami analytics database — the only PostgreSQL workload running on the cluster — wasn't large or critical, but the principle holds regardless of the payload. A backup that isn't running isn't a backup at all. It's just a CronJob that looks healthy on paper.
What followed was a debugging session with five distinct root causes. Each one was reasonable in isolation. Together they created something self-concealing: a failure that could only be found by noticing what wasn't there.
🏠 This is part of the Homelab Journey series - building a production Kubernetes cluster from scratch.
- Longhorn Storage Upgrade
- The Backup That Wasn't: Eight Days, Five Root Causes (you are here)
How It Was Found
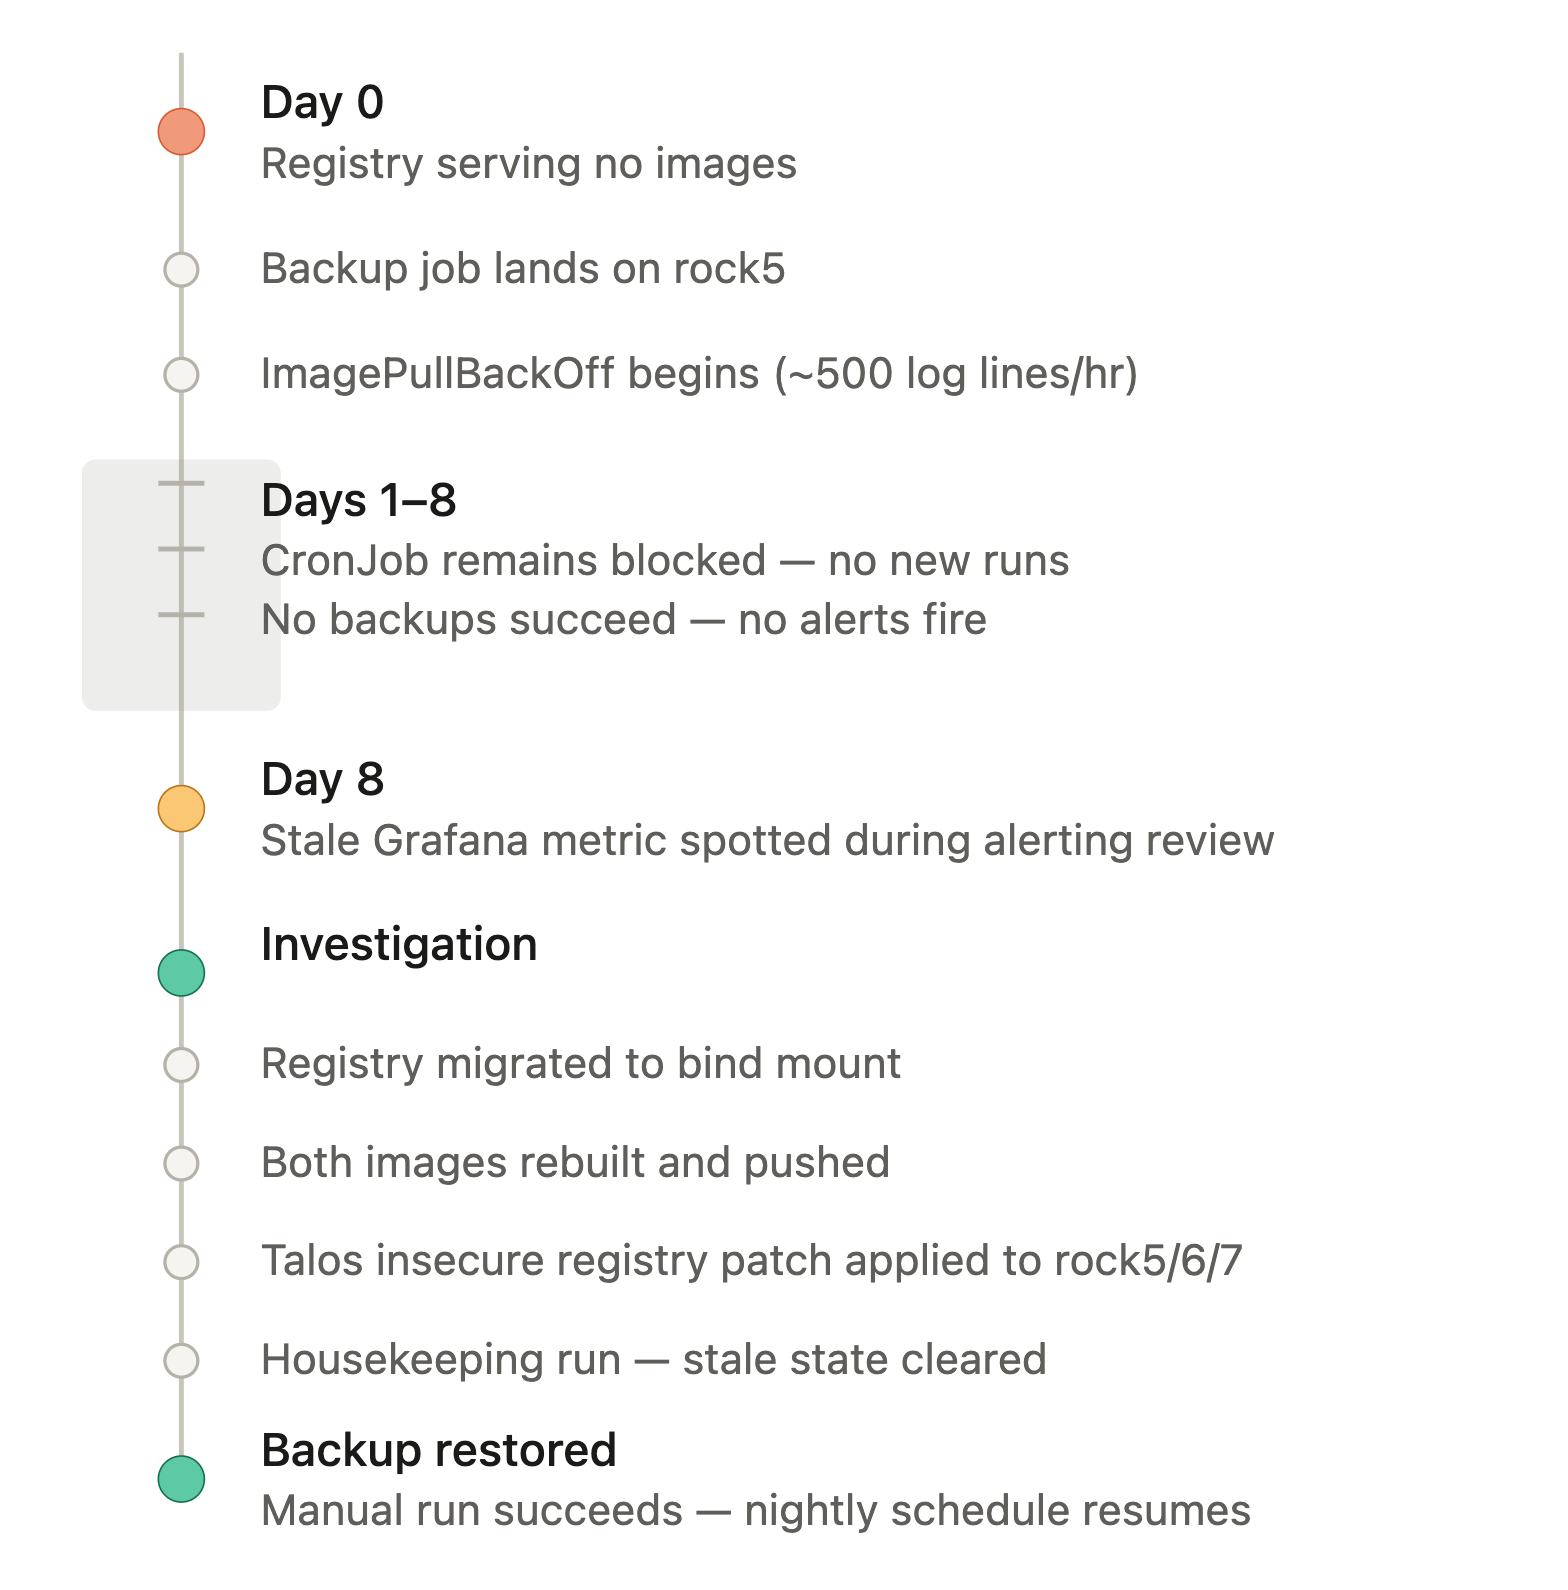
During the alerting review, I pulled up the Grafana dashboard for PostgreSQL backups. The panel shows postgres_backup_last_success_timestamp_seconds — the Unix timestamp of the last successful backup run. The value was frozen: over a week earlier, 03:00 AM. Eight days without a successful backup.
A quick check confirmed no PostgresBackupMissing alert had fired. That wasn't a bug in the alert rule — it was working exactly as designed. But it pointed to something important about how Grafana and Prometheus handle absent metrics differently.
Why No Alert Fired
The PostgresBackupMissing alert watches postgres_backup_last_success_timestamp_seconds. If the metric is present and stale for more than 26 hours, the alert fires.
The metric was not present at all.
The postgres-backup exporter is a sidecar: it scrapes the backup state and exposes it to Prometheus, running as part of the same pod as the backup logic. When the pod isn't running, neither is the exporter. No exporter, no metric — and Prometheus can't fire an alert on a metric that doesn't exist. What Grafana showed was the last recorded value before the exporter went silent; Prometheus had nothing live to evaluate. Something had stopped the pod from running. That's where the root causes begin.
This is a known limitation of metric-based alerting. The alert was correct for the case it was designed to catch: backup runs that fail but still report. It wasn't designed for the case where the reporter itself goes silent. That gap is worth noting, though fixing it properly (with an absent() wrapper rule) is a separate exercise and wasn't part of this review's scope.
Root Cause 1: The Registry Was Empty
The private Docker registry on docker.luwte.net is a plain registry:2 container — self-hosted, unencrypted (HTTP only, no TLS), served on port 5000. It had been running since the early days of the cluster, started as an ad-hoc docker run command:
docker run -d --name registry --restart always -p 5000:5000 -v registry-data:/var/lib/registry registry:2
When I pulled up the registry during the investigation, it showed no images. Why exactly — I'm not sure. The data was still sitting in the named volume on disk. Something about the registry's state meant it wasn't serving it.
Rather than chase the root cause of the original setup, I used this as the push to do it properly. The ad-hoc container became a compose service, and the named volume became a bind mount to a dedicated partition:
services:
  registry:
    image: registry:2
    container_name: registry
    restart: always
    ports:
      - "5000:5000"
    volumes:
      - /registry:/var/lib/registry
Now the data lives at a known path, the setup is in version control alongside the other Docker services on docker.luwte.net, and the registry's storage won't be affected by container lifecycle events.
The new registry was clean and empty. Both images had to be rebuilt and pushed before anything else could proceed. That's where the next root cause comes in.
Root Cause 2: Two Makefiles, Two Images, One Moment of Confusion
The postgres-backup and postgres-backup-runner are separate components with separate repositories and separate Makefiles. postgres-backup-runner is the image pulled by both the CronJob and the exporter sidecar. postgres-backup is the controller logic. Both needed to be rebuilt and pushed to the now-empty registry.
With two related repos open and an incident in progress, it wasn't immediately obvious which build target produced which image — and using the wrong one would have pushed under a mismatched tag, leaving the CronJob still unable to pull with nothing obvious to show for it.
The correct approach: trace the image name from the CronJob spec back to the build target in each repository, confirm the tag matches what the spec expects, then push both. Both images rebuilt and pushed cleanly.
The longer-term fix — migrating both images to the Forgejo registry and building via CI — removes this class of problem entirely. That remains an open item.
Root Cause 3: New Nodes Weren't Patched for the Insecure Registry
Talos Linux uses containerd for image pulling. containerd enforces HTTPS by default. Pulling from a plain HTTP registry requires an explicit insecure registry entry in the Talos machine config.
The original four nodes (rock1–4) had this patch applied when the registry was first set up. When rock5, rock6, and rock7 were added to the cluster in late May (Growing the Cluster), the insecure registry patch was not part of the node provisioning checklist. The patch had never been documented as a required step — it was applied ad-hoc on the original nodes and quietly forgotten.
The Talos patch looks like this:
machine:
  registries:
    mirrors:
      10.0.0.80:5000:
        endpoints:
          - http://10.0.0.80:5000
        overridePath: true
    config:
      10.0.0.80:5000:
        tls:
          insecureSkipVerify: true
Applied via:
talosctl patch machineconfig --nodes 10.0.140.15,10.0.140.16,10.0.140.17 \
  --patch @insecure-registry-patch.yaml
Once applied, containerd on rock5/6/7 could reach the registry. This is now a documented mandatory step in the node provisioning procedure — skipping it means any workload pulling from the internal registry will silently fail on those nodes.
Root Cause 4: The Backup Pod Landed on rock5
Kubernetes schedules pods across available nodes. The backup CronJob had no node affinity rules and no tolerations that would confine it to specific nodes. When the job ran, it landed on rock5 — one of the newly provisioned nodes without the insecure registry patch.
The pod entered ImagePullBackOff immediately. Kubernetes retried with exponential backoff. By the time the investigation started, the pod had made 30,605 retry attempts over eight days. The event log made this visible immediately:
kubectl describe pod postgres-backup-29658420-xxxxx -n postgres
The Events section showed a wall of Back-off pulling image "10.0.0.80:5000/postgres-backup-runner:latest" entries, stretching back over a week.
Loki shows around 500 ImagePullBackOff log lines per hour coming from rock5, sustained for the entire eight days — thousands of retries, all silently discarded. The job itself was stuck in a running state — Kubernetes considers a job still running as long as its pod hasn't terminated. The CronJob controller won't start a new run while a previous run is still active. Every subsequent backup window — 03:00 AM, daily — was silently skipped.
Root Cause 5: The State Machine Blocked Recovery Until Housekeeping Ran
The postgres-backup controller uses a state file to track run status. After a successful backup, it writes a .backup-complete marker. Before a new run, it checks for this marker.
The run that had been stuck in ImagePullBackOff — had set the state to "in progress" before the pod failed. The controller saw an in-progress state from eight days ago and refused to start a new run, correctly interpreting this as a potentially concurrent execution.
Housekeeping had to run first to clear the stale state:
kubectl create job --from=cronjob/postgres-housekeeping housekeeping-manual -n postgres
Once housekeeping completed and the stale marker was cleared, a manual backup run succeeded:
kubectl create job --from=cronjob/postgres-backup backup-manual -n postgres
The job completed cleanly. Logs confirmed:
Backup complete: 71,971 bytes dump, 9,533,107 bytes DB
Uploaded to s3://postgres-backups/daily/[date]/umami.custom
The Fix, Summarised
Five things had to happen, in order:
- Migrate the registry from a named Docker volume to a host bind mount at
/registry - Rebuild and push both images —
postgres-backup-runnerandpostgres-backup— using the correct Makefile for each - Apply the insecure registry Talos patch to rock5, rock6, and rock7
- Delete the stuck job and run housekeeping manually to clear stale state
- Run a manual backup to confirm end-to-end recovery
After step 5, the Grafana metric started moving again. The nightly 03:00 run the following morning completed without intervention.
Structural Debt Remaining
Fixing the immediate failure is not the same as preventing recurrence. A few things remain open:
Node provisioning checklist — the insecure registry patch is now documented as a mandatory step for any new node. It should be part of the worker node provisioning sequence, applied alongside the worker and Longhorn patches. It wasn't, because it was never written down.
Registry and CI — both images need to move to the Forgejo registry and build via CI. The manual rebuild-and-push process works, but it requires knowing which Makefile belongs to which component under pressure. That's the kind of thing that slows down incident recovery. This is on the backlog.
ImagePullBackOff alerting — Loki was logging ~500 lines per hour for eight days. An alert on ImagePullBackOff events would have caught this on day one, well before the backup staleness became visible in Grafana. This is a straightforward addition to the alerting setup and goes on the backlog alongside the other gaps found during the alerting review.
The absent() gap — a backup exporter that goes silent doesn't trigger the existing threshold-based alert. An absent() wrapper rule on postgres_backup_last_success_timestamp_seconds would catch the case where the metric disappears entirely. This wasn't added as part of the alerting review scope — it's the kind of improvement that belongs in a follow-up pass once the current rule set has settled.
Lessons Learned
- Self-concealing failures are the dangerous ones. The backup stopped, the alert for the backup stopping relied on a metric produced by the same broken component, and so silence read as health. When the thing that would have warned you is itself the thing that's broken, you need an outer layer of detection.
- Named Docker volumes and compose recreates don't mix. If data needs to survive container lifecycle events, use a bind mount to a path you control. Named volumes are convenient for development; they're a footgun in production.
- New nodes need the full provisioning checklist, not just the basics. rock5/6/7 were added correctly in terms of Talos and Longhorn setup. The insecure registry patch was a non-obvious dependency that lived only in the memory of having done it once on rock1–4. Writing it down once would have prevented eight days of silent failure.
- Check Grafana panels that haven't moved, not just ones that are alerting. The
ALERTS_FOR_STATEquery and the active alerts list won't show you a metric that's absent. Stale timestamps in dashboards are a signal worth paying attention to during any operational review.
What's Next
The alert rules that came out of Auditing the Alerts are now implemented in prometheus-values.yaml. That implementation work — the fan rule redesign, the new NTP and certificate rules, the group restructure, and promtool check rules output — is covered in Fixing the Alerts: New Rules, Better Groups, Less Noise.
The Longhorn fstrim issue — where Longhorn's allocation floor is rising independent of filesystem usage — is a separate thread. Without StorageClass discard support configured, manual trim attempts have had no effect, and the prometheus-server PVC is still sitting at ~97% Longhorn allocation. That's the next operational item to resolve.
← Previous: Auditing the Alerts
Questions or suggestions? Leave a comment below or reach out at igor@vluwte.nl.